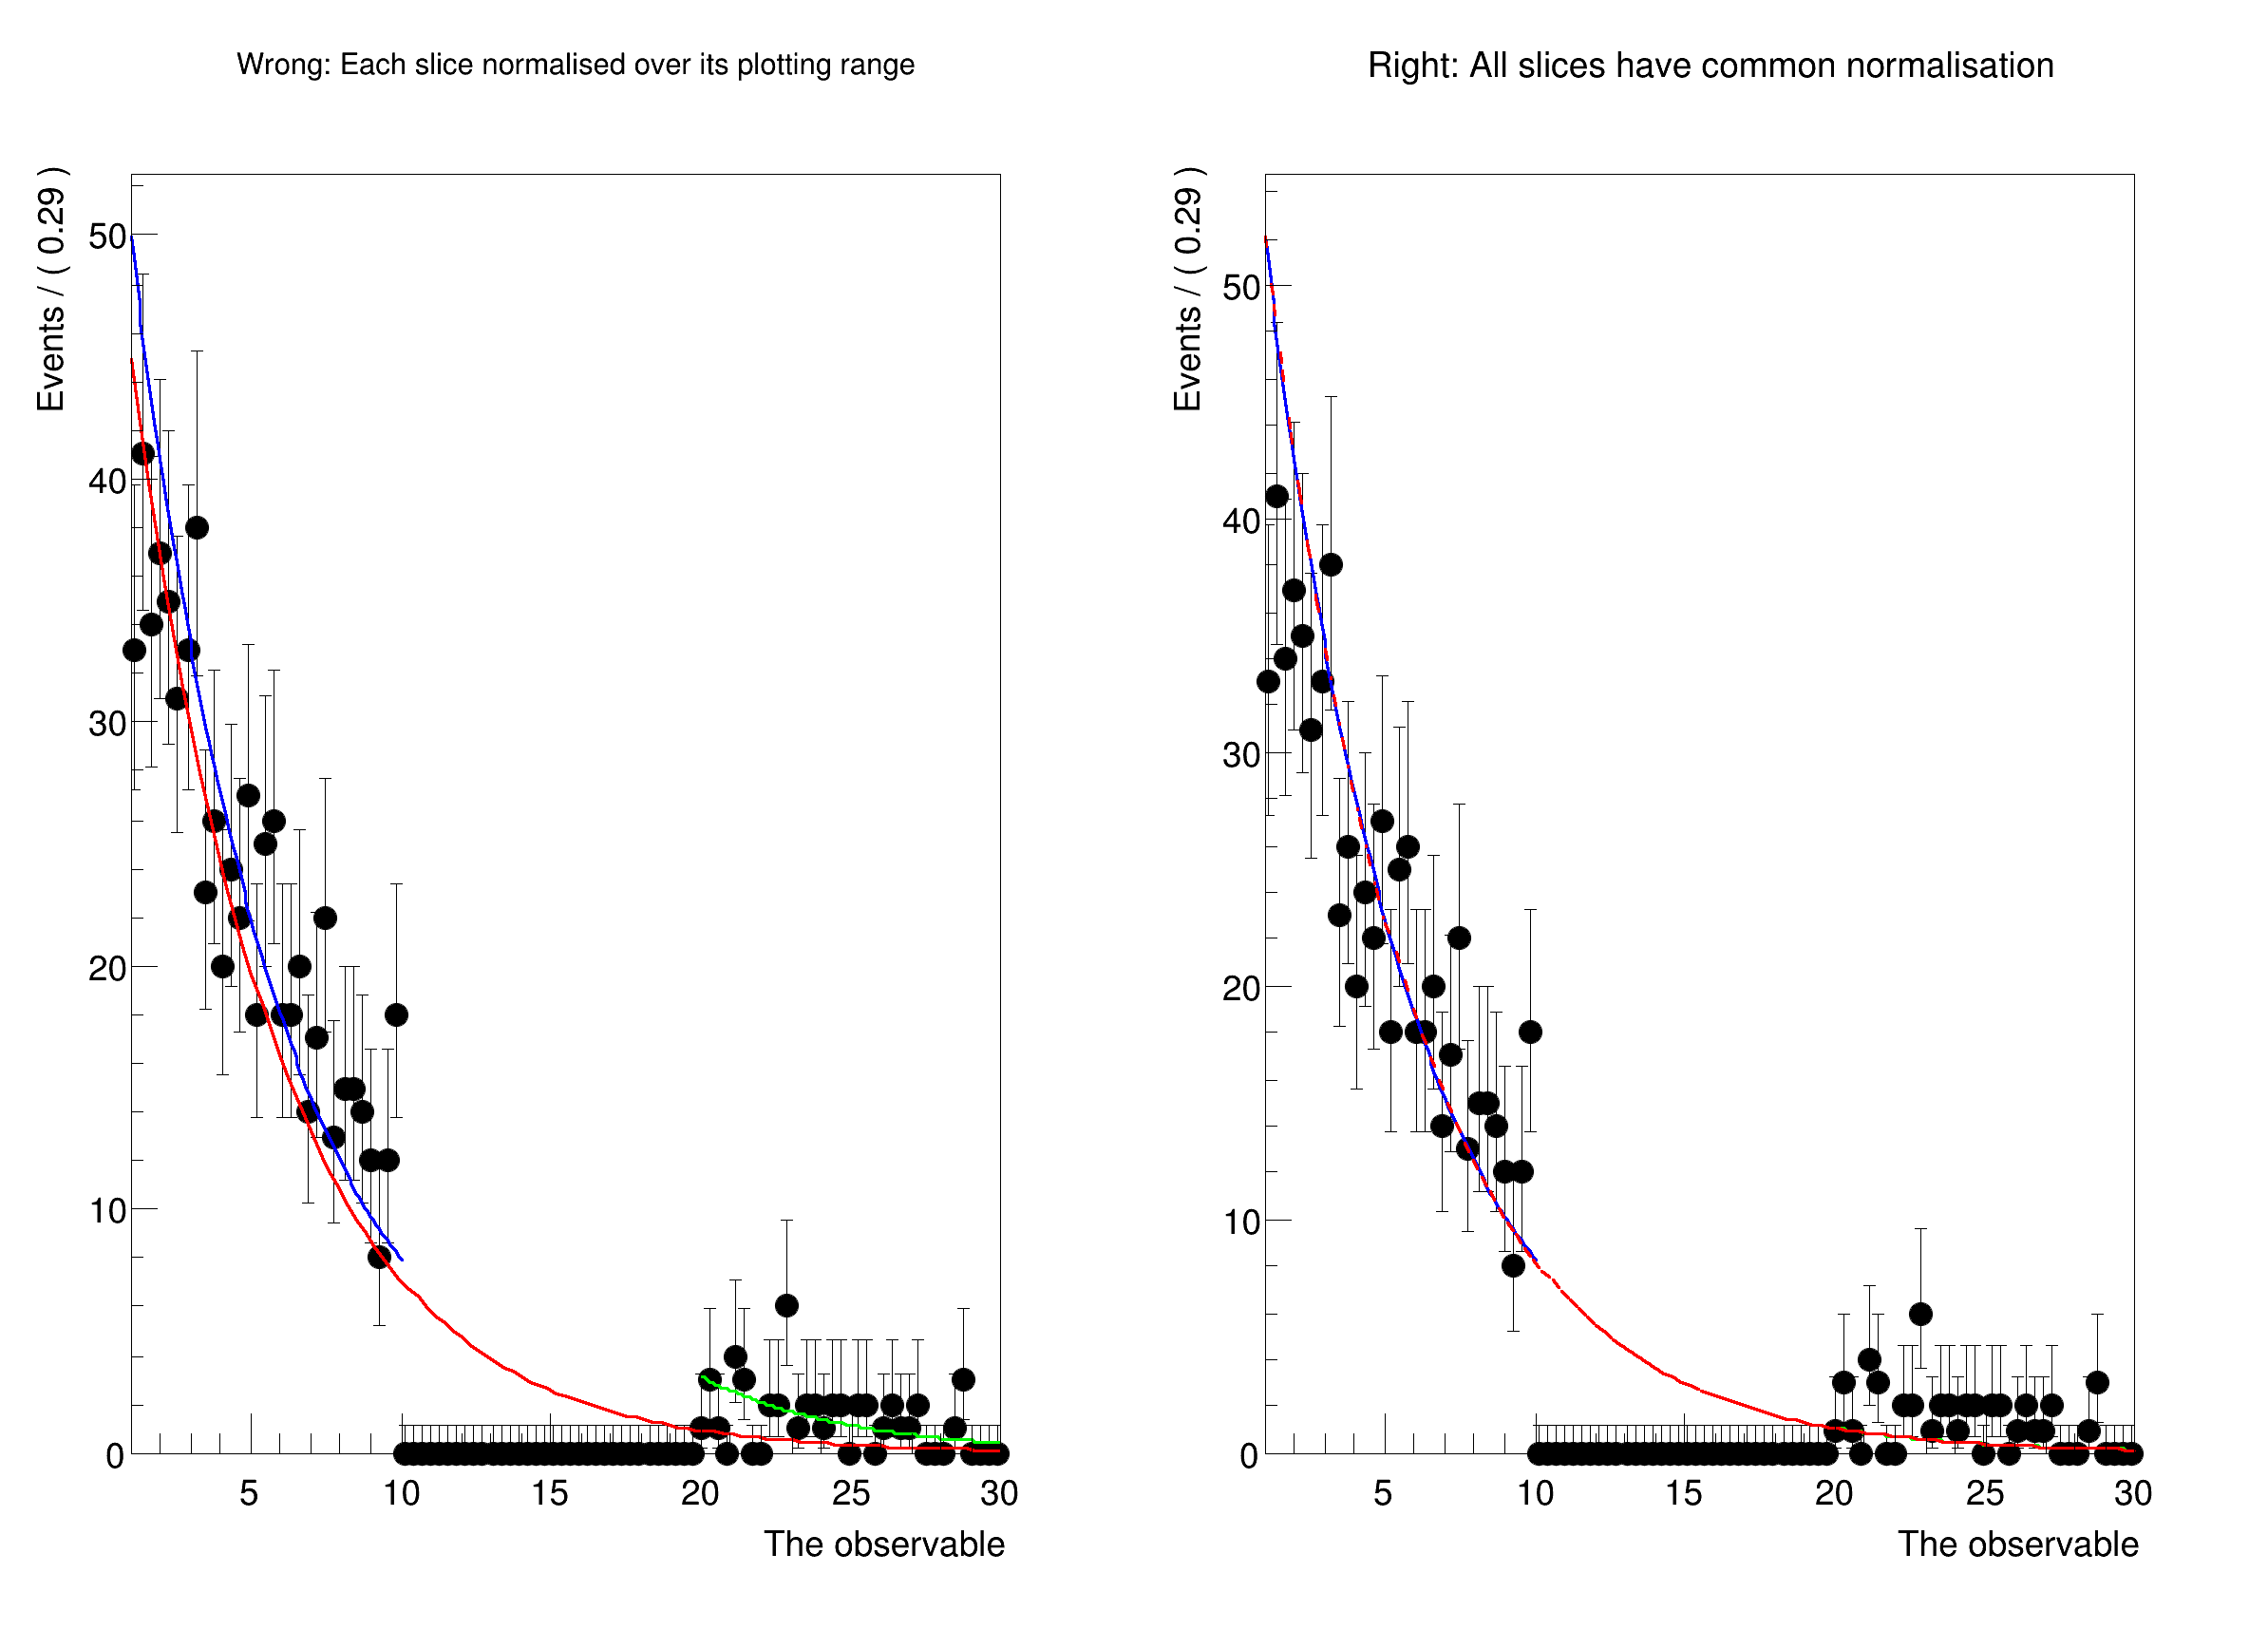
Plot a PDF in disjunct ranges, and get normalisation right.
Usually, when comparing a fit to data, one should first plot the data, and then the PDF. In this case, the PDF is automatically normalised to match the number of data events in the plot. However, when plotting only a sub-range, when e.g. a signal region has to be blinded, one has to exclude the blinded region from the computation of the normalisation.
In this tutorial, we show how to explicitly choose the normalisation when plotting using NormRange().
Thanks to Marc Escalier for asking how to do this correctly.
void rf212_plottingInRanges_blinding()
{
RooRealVar tau(
"tau",
"The exponent", -0.1337, -10., -0.1);
x.setRange(
"full", 1, 30);
x.setRange(
"left", 1, 10);
x.setRange(
"right", 20, 30);
tau.setVal(-2.);
std::cout << "Now plotting with unique normalisation for each slice." << std::endl;
blindedData->plotOn(plotFrame);
std::cout << "\n\nNow plotting with correct norm ranges:" << std::endl;
blindedData->plotOn(plotFrameWithNormRange);
plotFrameWithNormRange->
Draw();
}
RooAbsData * reduce(const RooCmdArg &arg1, const RooCmdArg &arg2=RooCmdArg(), const RooCmdArg &arg3=RooCmdArg(), const RooCmdArg &arg4=RooCmdArg(), const RooCmdArg &arg5=RooCmdArg(), const RooCmdArg &arg6=RooCmdArg(), const RooCmdArg &arg7=RooCmdArg(), const RooCmdArg &arg8=RooCmdArg())
Create a reduced copy of this dataset.
RooDataSet is a container class to hold unbinned data.
A RooPlot is a plot frame and a container for graphics objects within that frame.
virtual void Draw(Option_t *options=0)
Draw this plot and all of the elements it contains.
RooRealVar represents a variable that can be changed from the outside.
virtual void Draw(Option_t *option="")
Draw a canvas.
TVirtualPad * cd(Int_t subpadnumber=0)
Set current canvas & pad.
virtual void Divide(Int_t nx=1, Int_t ny=1, Float_t xmargin=0.01, Float_t ymargin=0.01, Int_t color=0)
Automatic pad generation by division.
RooCmdArg Title(const char *name)
RooCmdArg NormRange(const char *rangeNameList)
RooCmdArg CutRange(const char *rangeName)
RooCmdArg LineColor(Color_t color)
RooCmdArg LineStyle(Style_t style)
The namespace RooFit contains mostly switches that change the behaviour of functions of PDFs (or othe...
␛[1mRooFit v3.60 -- Developed by Wouter Verkerke and David Kirkby␛[0m
Copyright (C) 2000-2013 NIKHEF, University of California & Stanford University
All rights reserved, please read http://roofit.sourceforge.net/license.txt
[#1] INFO:Eval -- RooRealVar::setRange(x) new range named 'full' created with bounds [1,30]
[#1] INFO:Eval -- RooRealVar::setRange(x) new range named 'left' created with bounds [1,10]
[#1] INFO:Eval -- RooRealVar::setRange(x) new range named 'right' created with bounds [20,30]
[#1] INFO:Minization -- RooMinimizer::optimizeConst: activating const optimization
**********
** 1 **SET PRINT 1
**********
**********
** 2 **SET NOGRAD
**********
PARAMETER DEFINITIONS:
NO. NAME VALUE STEP SIZE LIMITS
1 tau -2.00000e+00 9.50000e-01 -1.00000e+01 -1.00000e-01
**********
** 3 **SET ERR 0.5
**********
**********
** 4 **SET PRINT 1
**********
**********
** 5 **SET STR 1
**********
NOW USING STRATEGY 1: TRY TO BALANCE SPEED AGAINST RELIABILITY
**********
** 6 **MIGRAD 500 1
**********
FIRST CALL TO USER FUNCTION AT NEW START POINT, WITH IFLAG=4.
START MIGRAD MINIMIZATION. STRATEGY 1. CONVERGENCE WHEN EDM .LT. 1.00e-03
FCN=6752.91 FROM MIGRAD STATUS=INITIATE 4 CALLS 5 TOTAL
EDM= unknown STRATEGY= 1 NO ERROR MATRIX
EXT PARAMETER CURRENT GUESS STEP FIRST
NO. NAME VALUE ERROR SIZE DERIVATIVE
1 tau -2.00000e+00 9.50000e-01 2.51381e-01 -1.27116e+04
ERR DEF= 0.5
MIGRAD MINIMIZATION HAS CONVERGED.
MIGRAD WILL VERIFY CONVERGENCE AND ERROR MATRIX.
COVARIANCE MATRIX CALCULATED SUCCESSFULLY
FCN=1941.97 FROM MIGRAD STATUS=CONVERGED 30 CALLS 31 TOTAL
EDM=3.68147e-07 STRATEGY= 1 ERROR MATRIX ACCURATE
EXT PARAMETER STEP FIRST
NO. NAME VALUE ERROR SIZE DERIVATIVE
1 tau -2.04501e-01 7.81359e-03 2.33650e-04 -7.85653e-02
ERR DEF= 0.5
EXTERNAL ERROR MATRIX. NDIM= 25 NPAR= 1 ERR DEF=0.5
6.105e-05
**********
** 7 **SET ERR 0.5
**********
**********
** 8 **SET PRINT 1
**********
**********
** 9 **HESSE 500
**********
COVARIANCE MATRIX CALCULATED SUCCESSFULLY
FCN=1941.97 FROM HESSE STATUS=OK 5 CALLS 36 TOTAL
EDM=3.6779e-07 STRATEGY= 1 ERROR MATRIX ACCURATE
EXT PARAMETER INTERNAL INTERNAL
NO. NAME VALUE ERROR STEP SIZE VALUE
1 tau -2.04501e-01 7.81358e-03 4.67300e-05 1.36495e+00
ERR DEF= 0.5
EXTERNAL ERROR MATRIX. NDIM= 25 NPAR= 1 ERR DEF=0.5
6.105e-05
[#1] INFO:Minization -- RooMinimizer::optimizeConst: deactivating const optimization
Now plotting with unique normalisation for each slice.
[#1] INFO:Plotting -- RooAbsPdf::plotOn(exp) only plotting range 'full', curve is normalized to data in given range
[#1] INFO:Plotting -- RooAbsPdf::plotOn(exp) only plotting range 'left', curve is normalized to data in given range
[#1] INFO:Plotting -- RooAbsPdf::plotOn(exp) only plotting range 'right', curve is normalized to data in given range
Now plotting with correct norm ranges:
[#1] INFO:Plotting -- RooAbsPdf::plotOn(exp) only plotting range 'left'
[#1] INFO:Plotting -- RooAbsPdf::plotOn(exp) p.d.f. curve is normalized using explicit choice of ranges 'left,right'
[#1] INFO:Plotting -- RooAbsPdf::plotOn(exp) only plotting range 'right'
[#1] INFO:Plotting -- RooAbsPdf::plotOn(exp) p.d.f. curve is normalized using explicit choice of ranges 'left,right'
[#1] INFO:Plotting -- RooAbsPdf::plotOn(exp) only plotting range 'full'
[#1] INFO:Plotting -- RooAbsPdf::plotOn(exp) p.d.f. curve is normalized using explicit choice of ranges 'left,right'