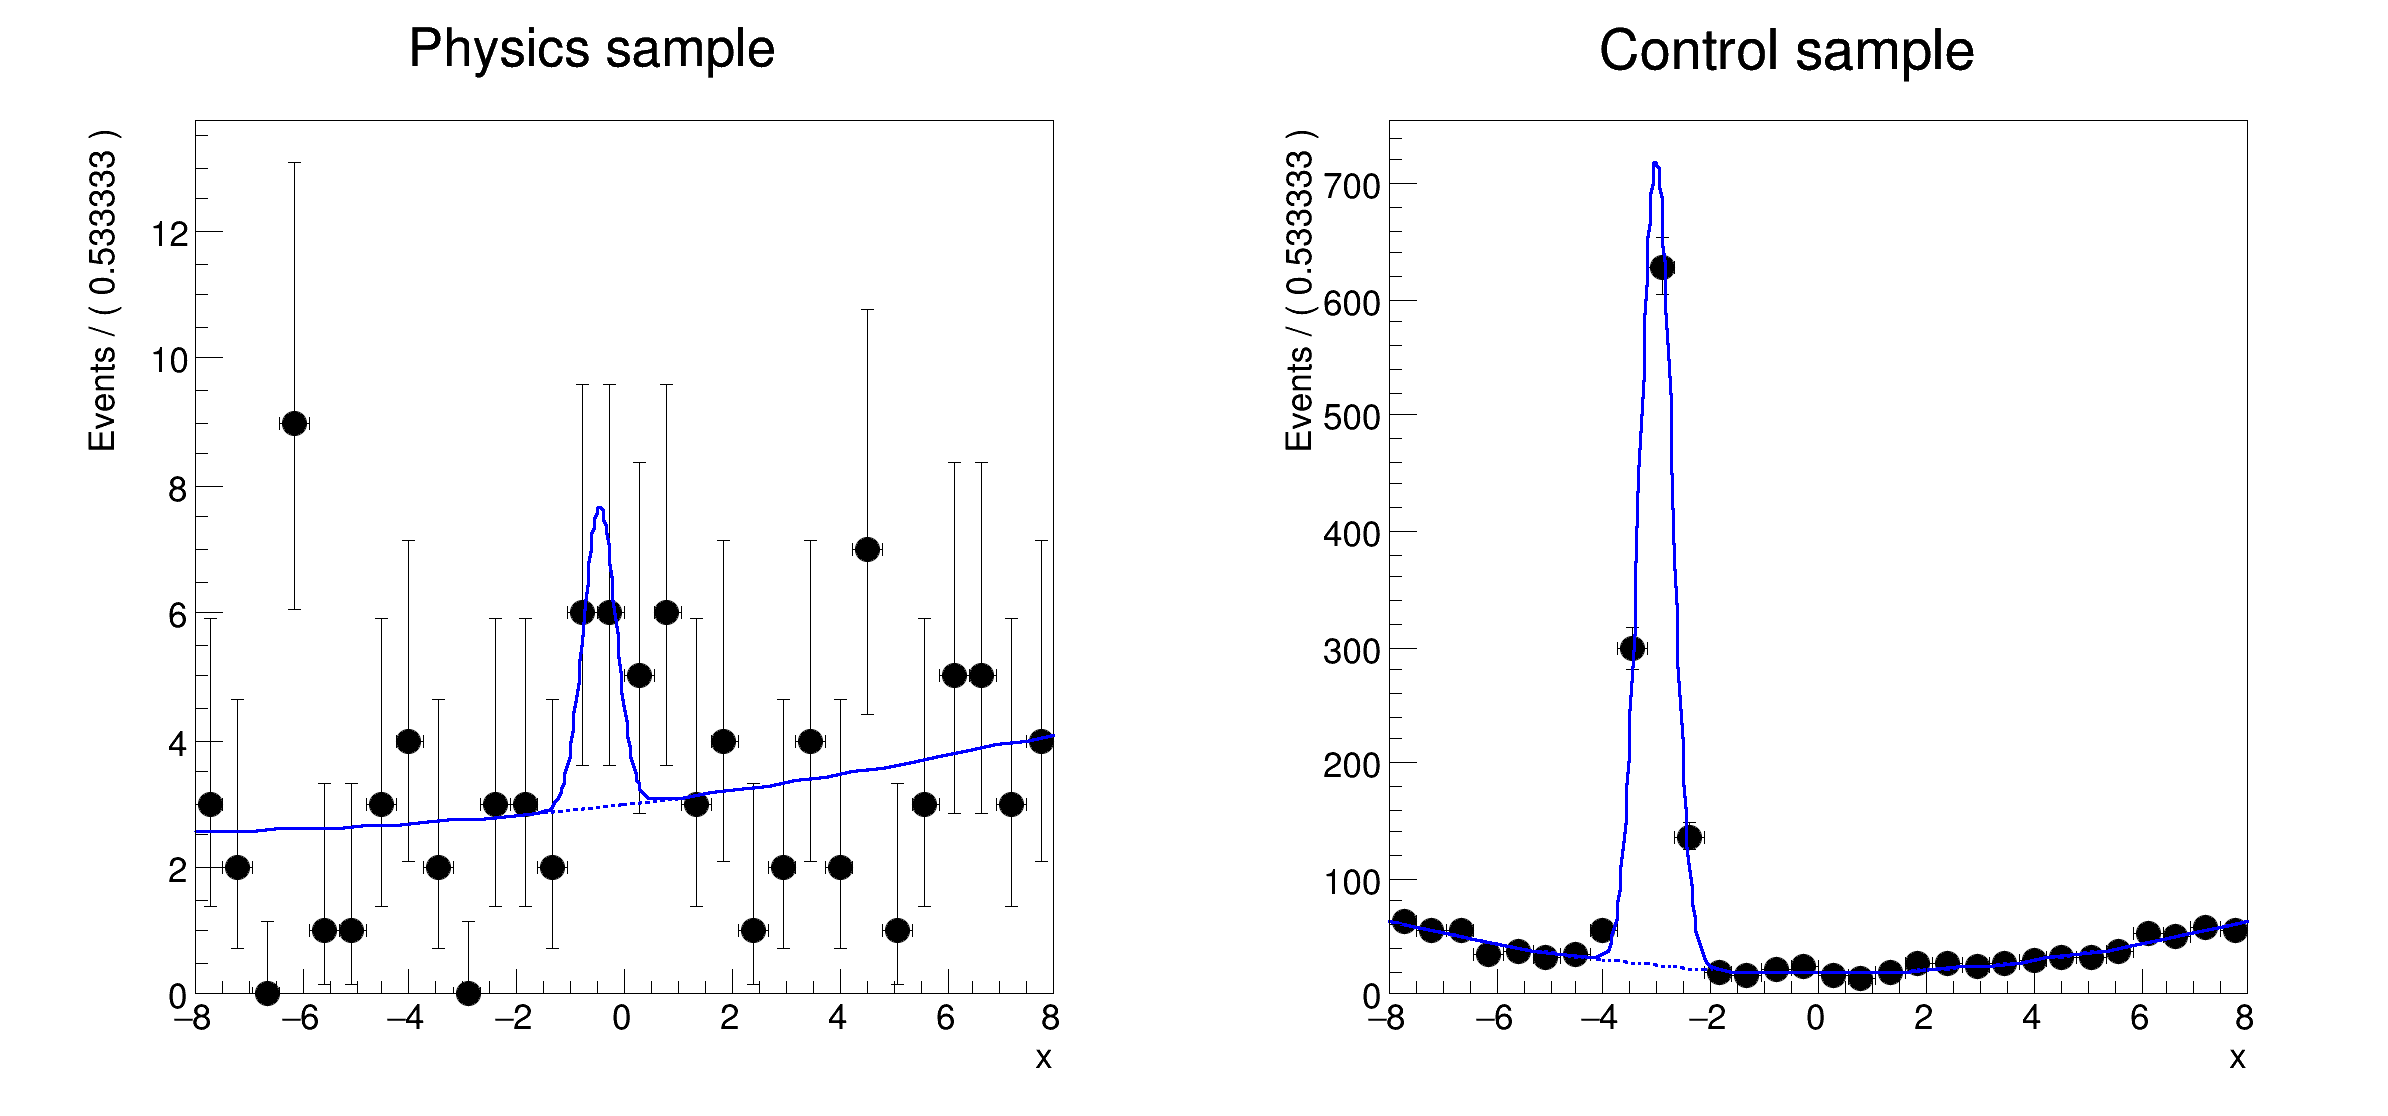
Organisation and simultaneous fits: using simultaneous p.d.f.s to describe simultaneous fits to multiple datasets
␛[1mRooFit v3.60 -- Developed by Wouter Verkerke and David Kirkby␛[0m
Copyright (C) 2000-2013 NIKHEF, University of California & Stanford University
All rights reserved, please read http://roofit.sourceforge.net/license.txt
[#1] INFO:Minization -- RooMinimizer::optimizeConst: activating const optimization
RooAbsTestStatistic::initSimMode: creating slave calculator #0 for state control (2000 dataset entries)
RooAbsTestStatistic::initSimMode: creating slave calculator #1 for state physics (100 dataset entries)
[#1] INFO:Fitting -- RooAbsTestStatistic::initSimMode: created 2 slave calculators.
[#1] INFO:Minization -- The following expressions will be evaluated in cache-and-track mode: (gx_ctl,px_ctl)
[#1] INFO:Minization -- The following expressions will be evaluated in cache-and-track mode: (gx,px)
**********
** 1 **SET PRINT 1
**********
**********
** 2 **SET NOGRAD
**********
PARAMETER DEFINITIONS:
NO. NAME VALUE STEP SIZE LIMITS
1 a0 -1.00000e-01 2.00000e-01 -1.00000e+00 1.00000e+00
2 a0_ctl -1.00000e-01 2.00000e-01 -1.00000e+00 1.00000e+00
3 a1 4.00000e-03 2.00000e-01 -1.00000e+00 1.00000e+00
4 a1_ctl 5.00000e-01 1.10000e-01 -1.00000e-01 1.00000e+00
5 f 2.00000e-01 1.00000e-01 0.00000e+00 1.00000e+00
6 f_ctl 5.00000e-01 1.00000e-01 0.00000e+00 1.00000e+00
7 mean 0.00000e+00 1.60000e+00 -8.00000e+00 8.00000e+00
8 mean_ctl -3.00000e+00 1.60000e+00 -8.00000e+00 8.00000e+00
9 sigma 3.00000e-01 1.00000e-01 1.00000e-01 1.00000e+01
**********
** 3 **SET ERR 0.5
**********
**********
** 4 **SET PRINT 1
**********
**********
** 5 **SET STR 1
**********
NOW USING STRATEGY 1: TRY TO BALANCE SPEED AGAINST RELIABILITY
**********
** 6 **MIGRAD 4500 1
**********
FIRST CALL TO USER FUNCTION AT NEW START POINT, WITH IFLAG=4.
START MIGRAD MINIMIZATION. STRATEGY 1. CONVERGENCE WHEN EDM .LT. 1.00e-03
FCN=5785.6 FROM MIGRAD STATUS=INITIATE 59 CALLS 60 TOTAL
EDM= unknown STRATEGY= 1 NO ERROR MATRIX
EXT PARAMETER CURRENT GUESS STEP FIRST
NO. NAME VALUE ERROR SIZE DERIVATIVE
1 a0 -1.00000e-01 2.00000e-01 0.00000e+00 -1.10268e+01
2 a0_ctl -1.00000e-01 2.00000e-01 0.00000e+00 -3.03978e+01
3 a1 4.00000e-03 2.00000e-01 0.00000e+00 -4.60041e+00
4 a1_ctl 5.00000e-01 1.10000e-01 0.00000e+00 -1.47265e+01
5 f 2.00000e-01 1.00000e-01 0.00000e+00 2.26641e+01
6 f_ctl 5.00000e-01 1.00000e-01 0.00000e+00 1.20766e+01
7 mean -3.77080e-01 1.60000e+00 -4.71524e-02 2.02184e+00
8 mean_ctl -3.00000e+00 1.60000e+00 0.00000e+00 1.67852e+03
9 sigma 3.00000e-01 1.00000e-01 0.00000e+00 -1.23150e+02
ERR DEF= 0.5
MIGRAD MINIMIZATION HAS CONVERGED.
MIGRAD WILL VERIFY CONVERGENCE AND ERROR MATRIX.
COVARIANCE MATRIX CALCULATED SUCCESSFULLY
FCN=5773.95 FROM MIGRAD STATUS=CONVERGED 215 CALLS 216 TOTAL
EDM=9.09231e-05 STRATEGY= 1 ERROR MATRIX ACCURATE
EXT PARAMETER STEP FIRST
NO. NAME VALUE ERROR SIZE DERIVATIVE
1 a0 2.43686e-01 1.75097e-01 9.50931e-03 -7.77735e-03
2 a0_ctl -4.39571e-03 5.28744e-02 2.72797e-03 6.60274e-02
3 a1 5.26925e-02 1.77733e-01 9.06411e-03 2.03859e-03
4 a1_ctl 5.44744e-01 3.69884e-02 3.54360e-03 8.08507e-02
5 f 6.83909e-02 3.85769e-02 7.72754e-03 1.99892e-02
6 f_ctl 5.02785e-01 1.23886e-02 1.26625e-03 -9.15907e-02
7 mean -4.64804e-01 2.34303e-01 1.53296e-03 8.01574e-02
8 mean_ctl -3.02635e+00 1.07683e-02 7.60384e-05 -2.92641e-01
9 sigma 3.07857e-01 8.77009e-03 3.15225e-04 6.75178e-01
ERR DEF= 0.5
EXTERNAL ERROR MATRIX. NDIM= 25 NPAR= 9 ERR DEF=0.5
3.100e-02 -8.236e-08 1.691e-03 -4.475e-08 2.119e-04 -2.634e-08 -8.743e-04 9.753e-09 -1.074e-07
-8.236e-08 2.798e-03 1.939e-05 1.721e-04 9.709e-06 8.897e-05 9.896e-05 -2.017e-05 5.899e-05
1.691e-03 1.939e-05 3.193e-02 1.054e-05 1.763e-03 6.202e-06 2.141e-03 -2.297e-06 2.529e-05
-4.475e-08 1.721e-04 1.054e-05 1.370e-03 5.276e-06 5.210e-05 5.377e-05 4.385e-06 3.206e-05
2.119e-04 9.709e-06 1.763e-03 5.276e-06 1.500e-03 3.105e-06 1.103e-03 -1.150e-06 1.266e-05
-2.634e-08 8.897e-05 6.202e-06 5.210e-05 3.105e-06 1.535e-04 3.165e-05 -4.850e-06 1.887e-05
-8.743e-04 9.896e-05 2.141e-03 5.377e-05 1.103e-03 3.165e-05 5.491e-02 -1.172e-05 1.290e-04
9.753e-09 -2.017e-05 -2.297e-06 4.385e-06 -1.150e-06 -4.850e-06 -1.172e-05 1.160e-04 -6.986e-06
-1.074e-07 5.899e-05 2.529e-05 3.206e-05 1.266e-05 1.887e-05 1.290e-04 -6.986e-06 7.692e-05
PARAMETER CORRELATION COEFFICIENTS
NO. GLOBAL 1 2 3 4 5 6 7 8 9
1 0.06243 1.000 -0.000 0.054 -0.000 0.031 -0.000 -0.021 0.000 -0.000
2 0.18516 -0.000 1.000 0.002 0.088 0.005 0.136 0.008 -0.035 0.127
3 0.25986 0.054 0.002 1.000 0.002 0.255 0.003 0.051 -0.001 0.016
4 0.15513 -0.000 0.088 0.002 1.000 0.004 0.114 0.006 0.011 0.099
5 0.27900 0.031 0.005 0.255 0.004 1.000 0.006 0.122 -0.003 0.037
6 0.22716 -0.000 0.136 0.003 0.114 0.006 1.000 0.011 -0.036 0.174
7 0.13877 -0.021 0.008 0.051 0.006 0.122 0.011 1.000 -0.005 0.063
8 0.08428 0.000 -0.035 -0.001 0.011 -0.003 -0.036 -0.005 1.000 -0.074
9 0.23447 -0.000 0.127 0.016 0.099 0.037 0.174 0.063 -0.074 1.000
**********
** 7 **SET ERR 0.5
**********
**********
** 8 **SET PRINT 1
**********
**********
** 9 **HESSE 4500
**********
COVARIANCE MATRIX CALCULATED SUCCESSFULLY
FCN=5773.95 FROM HESSE STATUS=OK 73 CALLS 289 TOTAL
EDM=9.09933e-05 STRATEGY= 1 ERROR MATRIX ACCURATE
EXT PARAMETER INTERNAL INTERNAL
NO. NAME VALUE ERROR STEP SIZE VALUE
1 a0 2.43686e-01 1.75089e-01 1.90186e-03 2.46164e-01
2 a0_ctl -4.39571e-03 5.28750e-02 5.45594e-04 -4.39572e-03
3 a1 5.26925e-02 1.77738e-01 3.62564e-04 5.27169e-02
4 a1_ctl 5.44744e-01 3.69886e-02 7.08720e-04 1.73125e-01
5 f 6.83909e-02 3.86045e-02 1.54551e-03 -1.04161e+00
6 f_ctl 5.02785e-01 1.23892e-02 2.53250e-04 5.57046e-03
7 mean -4.64804e-01 2.34476e-01 6.13182e-05 -5.81332e-02
8 mean_ctl -3.02635e+00 1.07691e-02 1.52077e-05 -3.87952e-01
9 sigma 3.07857e-01 8.77063e-03 6.30449e-05 -1.27998e+00
ERR DEF= 0.5
EXTERNAL ERROR MATRIX. NDIM= 25 NPAR= 9 ERR DEF=0.5
3.100e-02 -3.186e-08 1.673e-03 -1.730e-08 2.112e-04 -1.019e-08 -8.472e-04 3.826e-09 -4.152e-08
-3.186e-08 2.798e-03 1.944e-05 1.721e-04 9.725e-06 8.903e-05 9.780e-05 -2.018e-05 5.905e-05
1.673e-03 1.944e-05 3.193e-02 1.056e-05 1.765e-03 6.219e-06 2.280e-03 -2.333e-06 2.532e-05
-1.730e-08 1.721e-04 1.056e-05 1.370e-03 5.282e-06 5.212e-05 5.312e-05 4.372e-06 3.207e-05
2.112e-04 9.725e-06 1.765e-03 5.282e-06 1.502e-03 3.111e-06 1.167e-03 -1.167e-06 1.267e-05
-1.019e-08 8.903e-05 6.219e-06 5.212e-05 3.111e-06 1.535e-04 3.129e-05 -4.856e-06 1.889e-05
-8.472e-04 9.780e-05 2.280e-03 5.312e-05 1.167e-03 3.129e-05 5.499e-02 -1.174e-05 1.274e-04
3.826e-09 -2.018e-05 -2.333e-06 4.372e-06 -1.167e-06 -4.856e-06 -1.174e-05 1.160e-04 -7.086e-06
-4.152e-08 5.905e-05 2.532e-05 3.207e-05 1.267e-05 1.889e-05 1.274e-04 -7.086e-06 7.692e-05
PARAMETER CORRELATION COEFFICIENTS
NO. GLOBAL 1 2 3 4 5 6 7 8 9
1 0.06177 1.000 -0.000 0.053 -0.000 0.031 -0.000 -0.021 0.000 -0.000
2 0.18523 -0.000 1.000 0.002 0.088 0.005 0.136 0.008 -0.035 0.127
3 0.25994 0.053 0.002 1.000 0.002 0.255 0.003 0.054 -0.001 0.016
4 0.15515 -0.000 0.088 0.002 1.000 0.004 0.114 0.006 0.011 0.099
5 0.28144 0.031 0.005 0.255 0.004 1.000 0.006 0.128 -0.003 0.037
6 0.22733 -0.000 0.136 0.003 0.114 0.006 1.000 0.011 -0.036 0.174
7 0.14455 -0.021 0.008 0.054 0.006 0.128 0.011 1.000 -0.005 0.062
8 0.08514 0.000 -0.035 -0.001 0.011 -0.003 -0.036 -0.005 1.000 -0.075
9 0.23472 -0.000 0.127 0.016 0.099 0.037 0.174 0.062 -0.075 1.000
[#1] INFO:Minization -- RooMinimizer::optimizeConst: deactivating const optimization
[#1] INFO:Plotting -- RooTreeData::plotOn: plotting 100 events out of 2100 total events
[#1] INFO:Plotting -- RooSimultaneous::plotOn(simPdf) plot on x represents a slice in the index category (sample)
[#1] INFO:Plotting -- RooAbsReal::plotOn(model) slice variable sample was not projected anyway
[#1] INFO:Plotting -- RooSimultaneous::plotOn(simPdf) plot on x represents a slice in the index category (sample)
[#1] INFO:Plotting -- RooAbsPdf::plotOn(model) directly selected PDF components: (px)
[#1] INFO:Plotting -- RooAbsPdf::plotOn(model) indirectly selected PDF components: ()
[#1] INFO:Plotting -- RooAbsReal::plotOn(model) slice variable sample was not projected anyway
[#1] INFO:Plotting -- RooTreeData::plotOn: plotting 2000 events out of 2100 total events
[#1] INFO:Plotting -- RooSimultaneous::plotOn(simPdf) plot on x represents a slice in the index category (sample)
[#1] INFO:Plotting -- RooAbsReal::plotOn(model_ctl) slice variable sample was not projected anyway
[#1] INFO:Plotting -- RooSimultaneous::plotOn(simPdf) plot on x represents a slice in the index category (sample)
[#1] INFO:Plotting -- RooAbsPdf::plotOn(model_ctl) directly selected PDF components: (px_ctl)
[#1] INFO:Plotting -- RooAbsPdf::plotOn(model_ctl) indirectly selected PDF components: ()
[#1] INFO:Plotting -- RooAbsReal::plotOn(model_ctl) slice variable sample was not projected anyway