␛[1mRooFit v3.60 -- Developed by Wouter Verkerke and David Kirkby␛[0m
Copyright (C) 2000-2013 NIKHEF, University of California & Stanford University
All rights reserved, please read http://roofit.sourceforge.net/license.txt
[#0] WARNING:InputArguments -- The parameter 'sigma_g1' with range [-1e+30, 1e+30] of the RooGaussian 'g1' exceeds the safe range of (0, inf). Advise to limit its range.
[#1] INFO:Minization -- RooMinimizer::optimizeConst: activating const optimization
[#1] INFO:Minization -- The following expressions will be evaluated in cache-and-track mode: (g1,g2)
**********
** 1 **SET PRINT 1
**********
**********
** 2 **SET NOGRAD
**********
PARAMETER DEFINITIONS:
NO. NAME VALUE STEP SIZE LIMITS
1 frac 5.00000e-01 1.00000e-01 0.00000e+00 1.00000e+00
2 mean 0.00000e+00 2.00000e-01 -1.00000e+00 1.00000e+00
3 sigma_g2 4.00000e+00 2.00000e-01 3.00000e+00 5.00000e+00
**********
** 3 **SET ERR 0.5
**********
**********
** 4 **SET PRINT 1
**********
**********
** 5 **SET STR 1
**********
NOW USING STRATEGY 1: TRY TO BALANCE SPEED AGAINST RELIABILITY
**********
** 6 **MIGRAD 1500 1
**********
FIRST CALL TO USER FUNCTION AT NEW START POINT, WITH IFLAG=4.
START MIGRAD MINIMIZATION. STRATEGY 1. CONVERGENCE WHEN EDM .LT. 1.00e-03
FCN=2523.5 FROM MIGRAD STATUS=INITIATE 10 CALLS 11 TOTAL
EDM= unknown STRATEGY= 1 NO ERROR MATRIX
EXT PARAMETER CURRENT GUESS STEP FIRST
NO. NAME VALUE ERROR SIZE DERIVATIVE
1 frac 5.00000e-01 1.00000e-01 2.01358e-01 -1.31418e+01
2 mean 0.00000e+00 2.00000e-01 2.01358e-01 4.68351e+00
3 sigma_g2 4.00000e+00 2.00000e-01 2.01358e-01 5.45887e+00
ERR DEF= 0.5
MIGRAD MINIMIZATION HAS CONVERGED.
MIGRAD WILL VERIFY CONVERGENCE AND ERROR MATRIX.
COVARIANCE MATRIX CALCULATED SUCCESSFULLY
FCN=2522.85 FROM MIGRAD STATUS=CONVERGED 50 CALLS 51 TOTAL
EDM=4.43971e-05 STRATEGY= 1 ERROR MATRIX ACCURATE
EXT PARAMETER STEP FIRST
NO. NAME VALUE ERROR SIZE DERIVATIVE
1 frac 5.43820e-01 5.60284e-02 2.70800e-03 8.34315e-02
2 mean -4.18828e-02 9.05559e-02 3.14649e-03 -5.37978e-03
3 sigma_g2 4.01280e+00 2.08953e-01 4.84455e-03 -4.10552e-02
ERR DEF= 0.5
EXTERNAL ERROR MATRIX. NDIM= 25 NPAR= 3 ERR DEF=0.5
3.153e-03 -3.621e-04 8.647e-03
-3.621e-04 8.223e-03 -1.611e-03
8.647e-03 -1.611e-03 4.431e-02
PARAMETER CORRELATION COEFFICIENTS
NO. GLOBAL 1 2 3
1 0.73165 1.000 -0.071 0.732
2 0.08551 -0.071 1.000 -0.084
3 0.73231 0.732 -0.084 1.000
**********
** 7 **SET ERR 0.5
**********
**********
** 8 **SET PRINT 1
**********
**********
** 9 **HESSE 1500
**********
COVARIANCE MATRIX CALCULATED SUCCESSFULLY
FCN=2522.85 FROM HESSE STATUS=OK 16 CALLS 67 TOTAL
EDM=4.43683e-05 STRATEGY= 1 ERROR MATRIX ACCURATE
EXT PARAMETER INTERNAL INTERNAL
NO. NAME VALUE ERROR STEP SIZE VALUE
1 frac 5.43820e-01 5.60802e-02 5.41601e-04 8.77525e-02
2 mean -4.18828e-02 9.05561e-02 6.29298e-04 -4.18951e-02
3 sigma_g2 4.01280e+00 2.09149e-01 9.68910e-04 1.27960e-02
ERR DEF= 0.5
EXTERNAL ERROR MATRIX. NDIM= 25 NPAR= 3 ERR DEF=0.5
3.158e-03 -3.614e-04 8.670e-03
-3.614e-04 8.223e-03 -1.615e-03
8.670e-03 -1.615e-03 4.440e-02
PARAMETER CORRELATION COEFFICIENTS
NO. GLOBAL 1 2 3
1 0.73224 1.000 -0.071 0.732
2 0.08555 -0.071 1.000 -0.085
3 0.73291 0.732 -0.085 1.000
[#1] INFO:Minization -- RooMinimizer::optimizeConst: deactivating const optimization
{
RooRealVar mean(
"mean",
"mean of g1 and g2", 0, -1, 1);
RooRealVar sigma_g1(
"sigma_g1",
"width of g1", 2);
RooRealVar sigma_g2(
"sigma_g2",
"width of g2", 4, 3.0, 5.0);
new TCanvas(
"rf608_fitresultaspdf_1",
"rf608_fitresultaspdf_1", 600, 600);
TCanvas *
c2 =
new TCanvas(
"rf608_fitresultaspdf_2",
"rf608_fitresultaspdf_2", 900, 600);
gPad->SetLeftMargin(0.15);
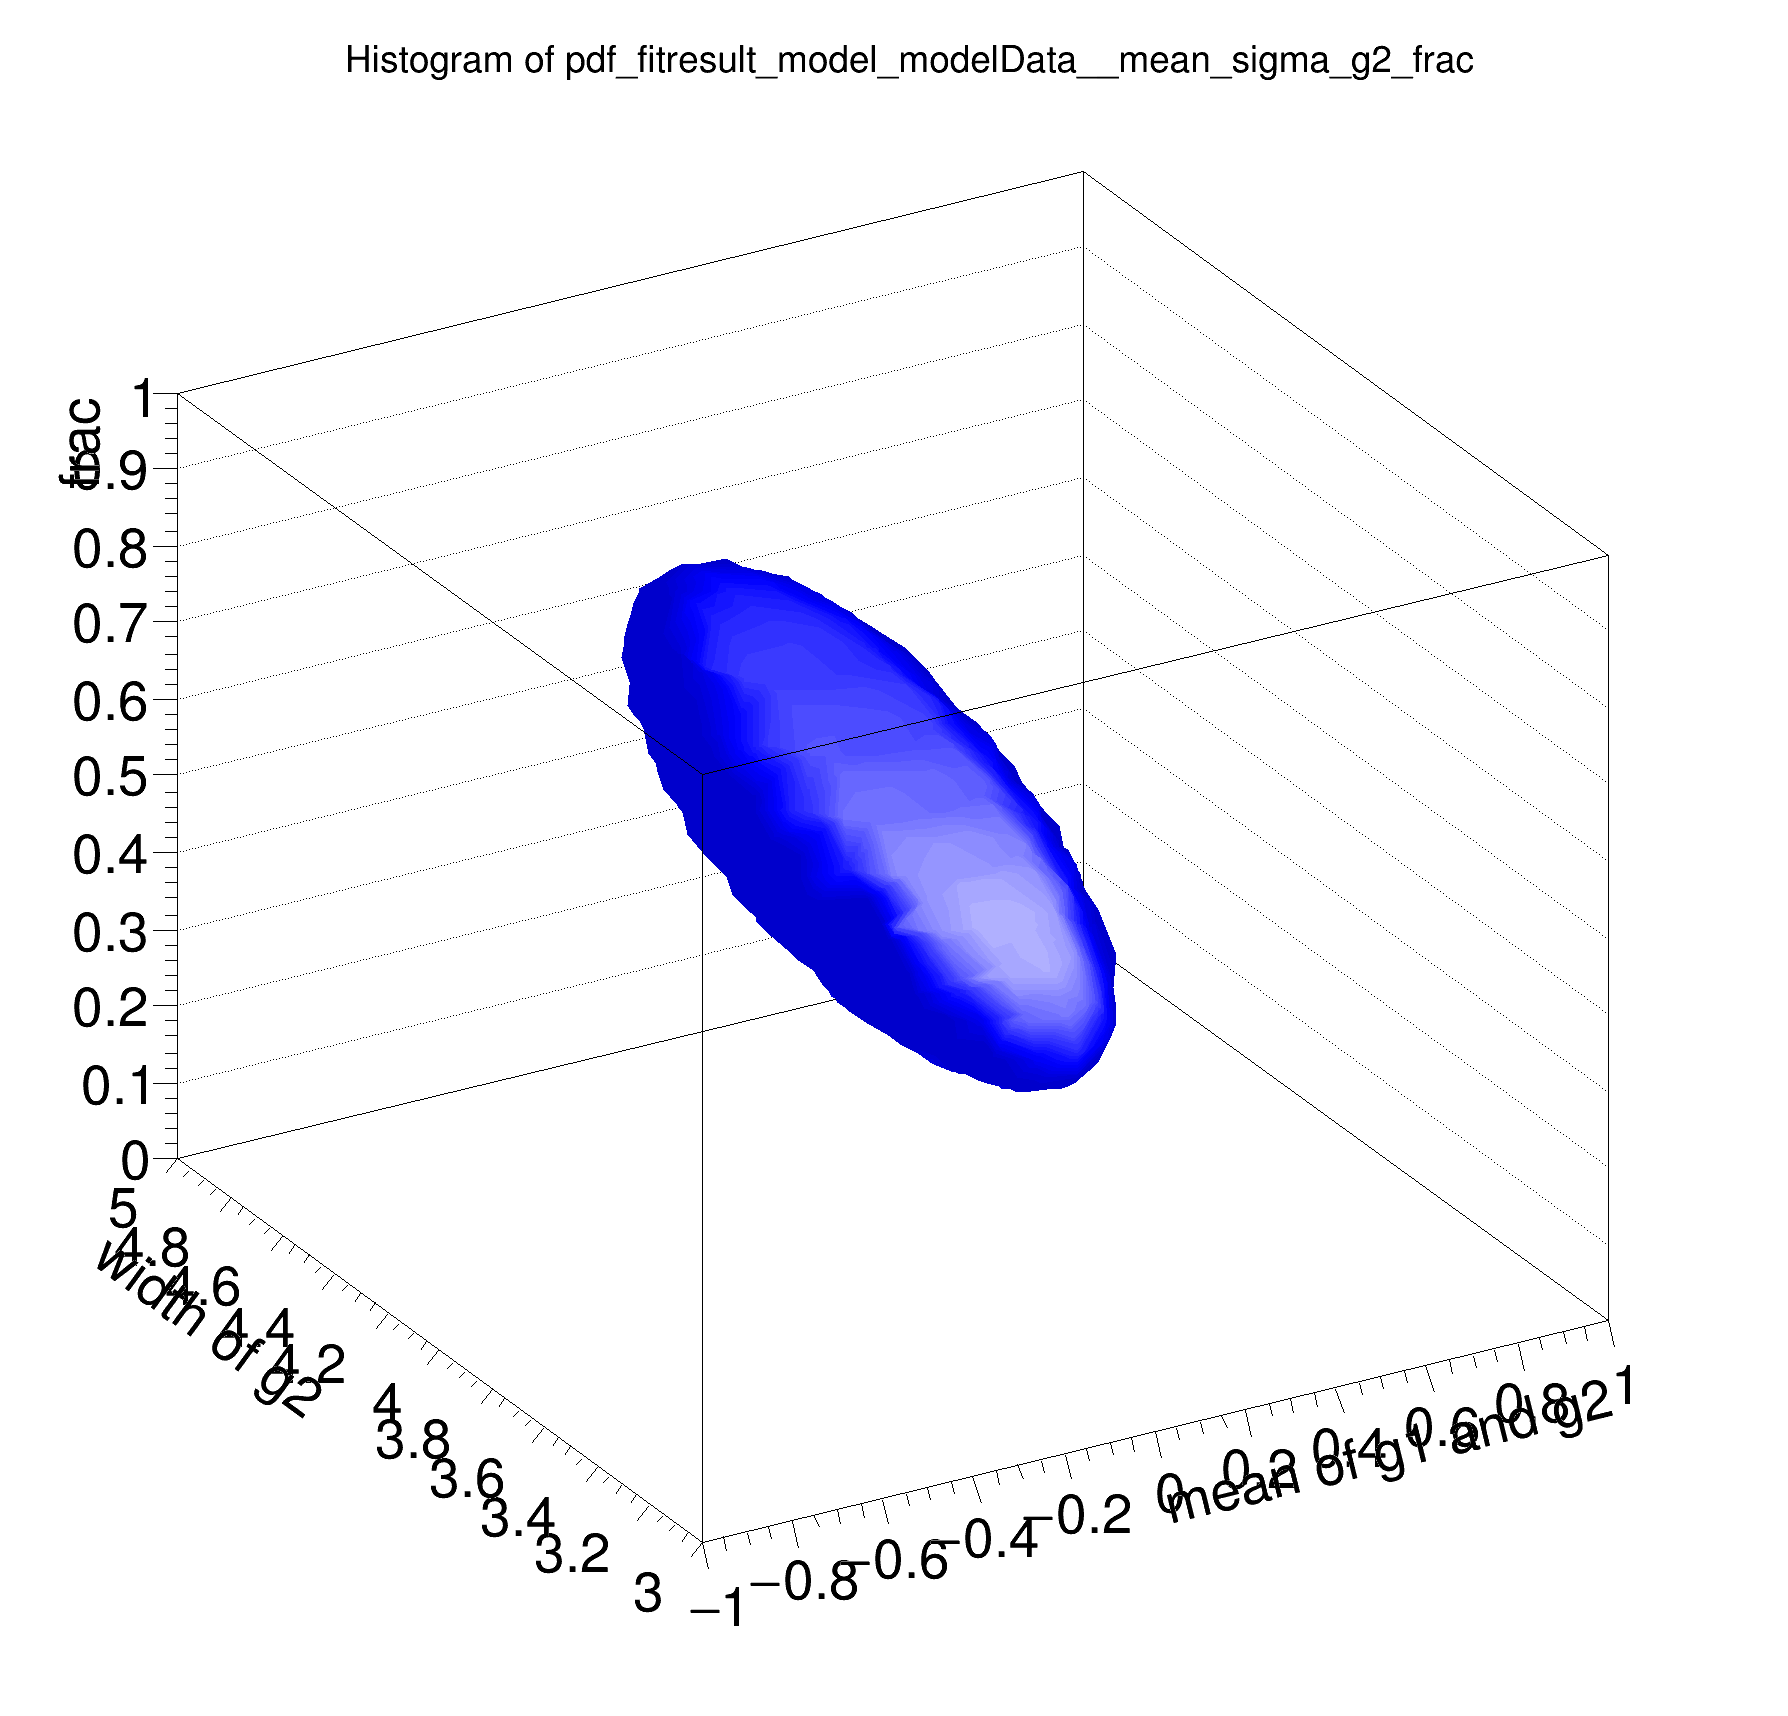
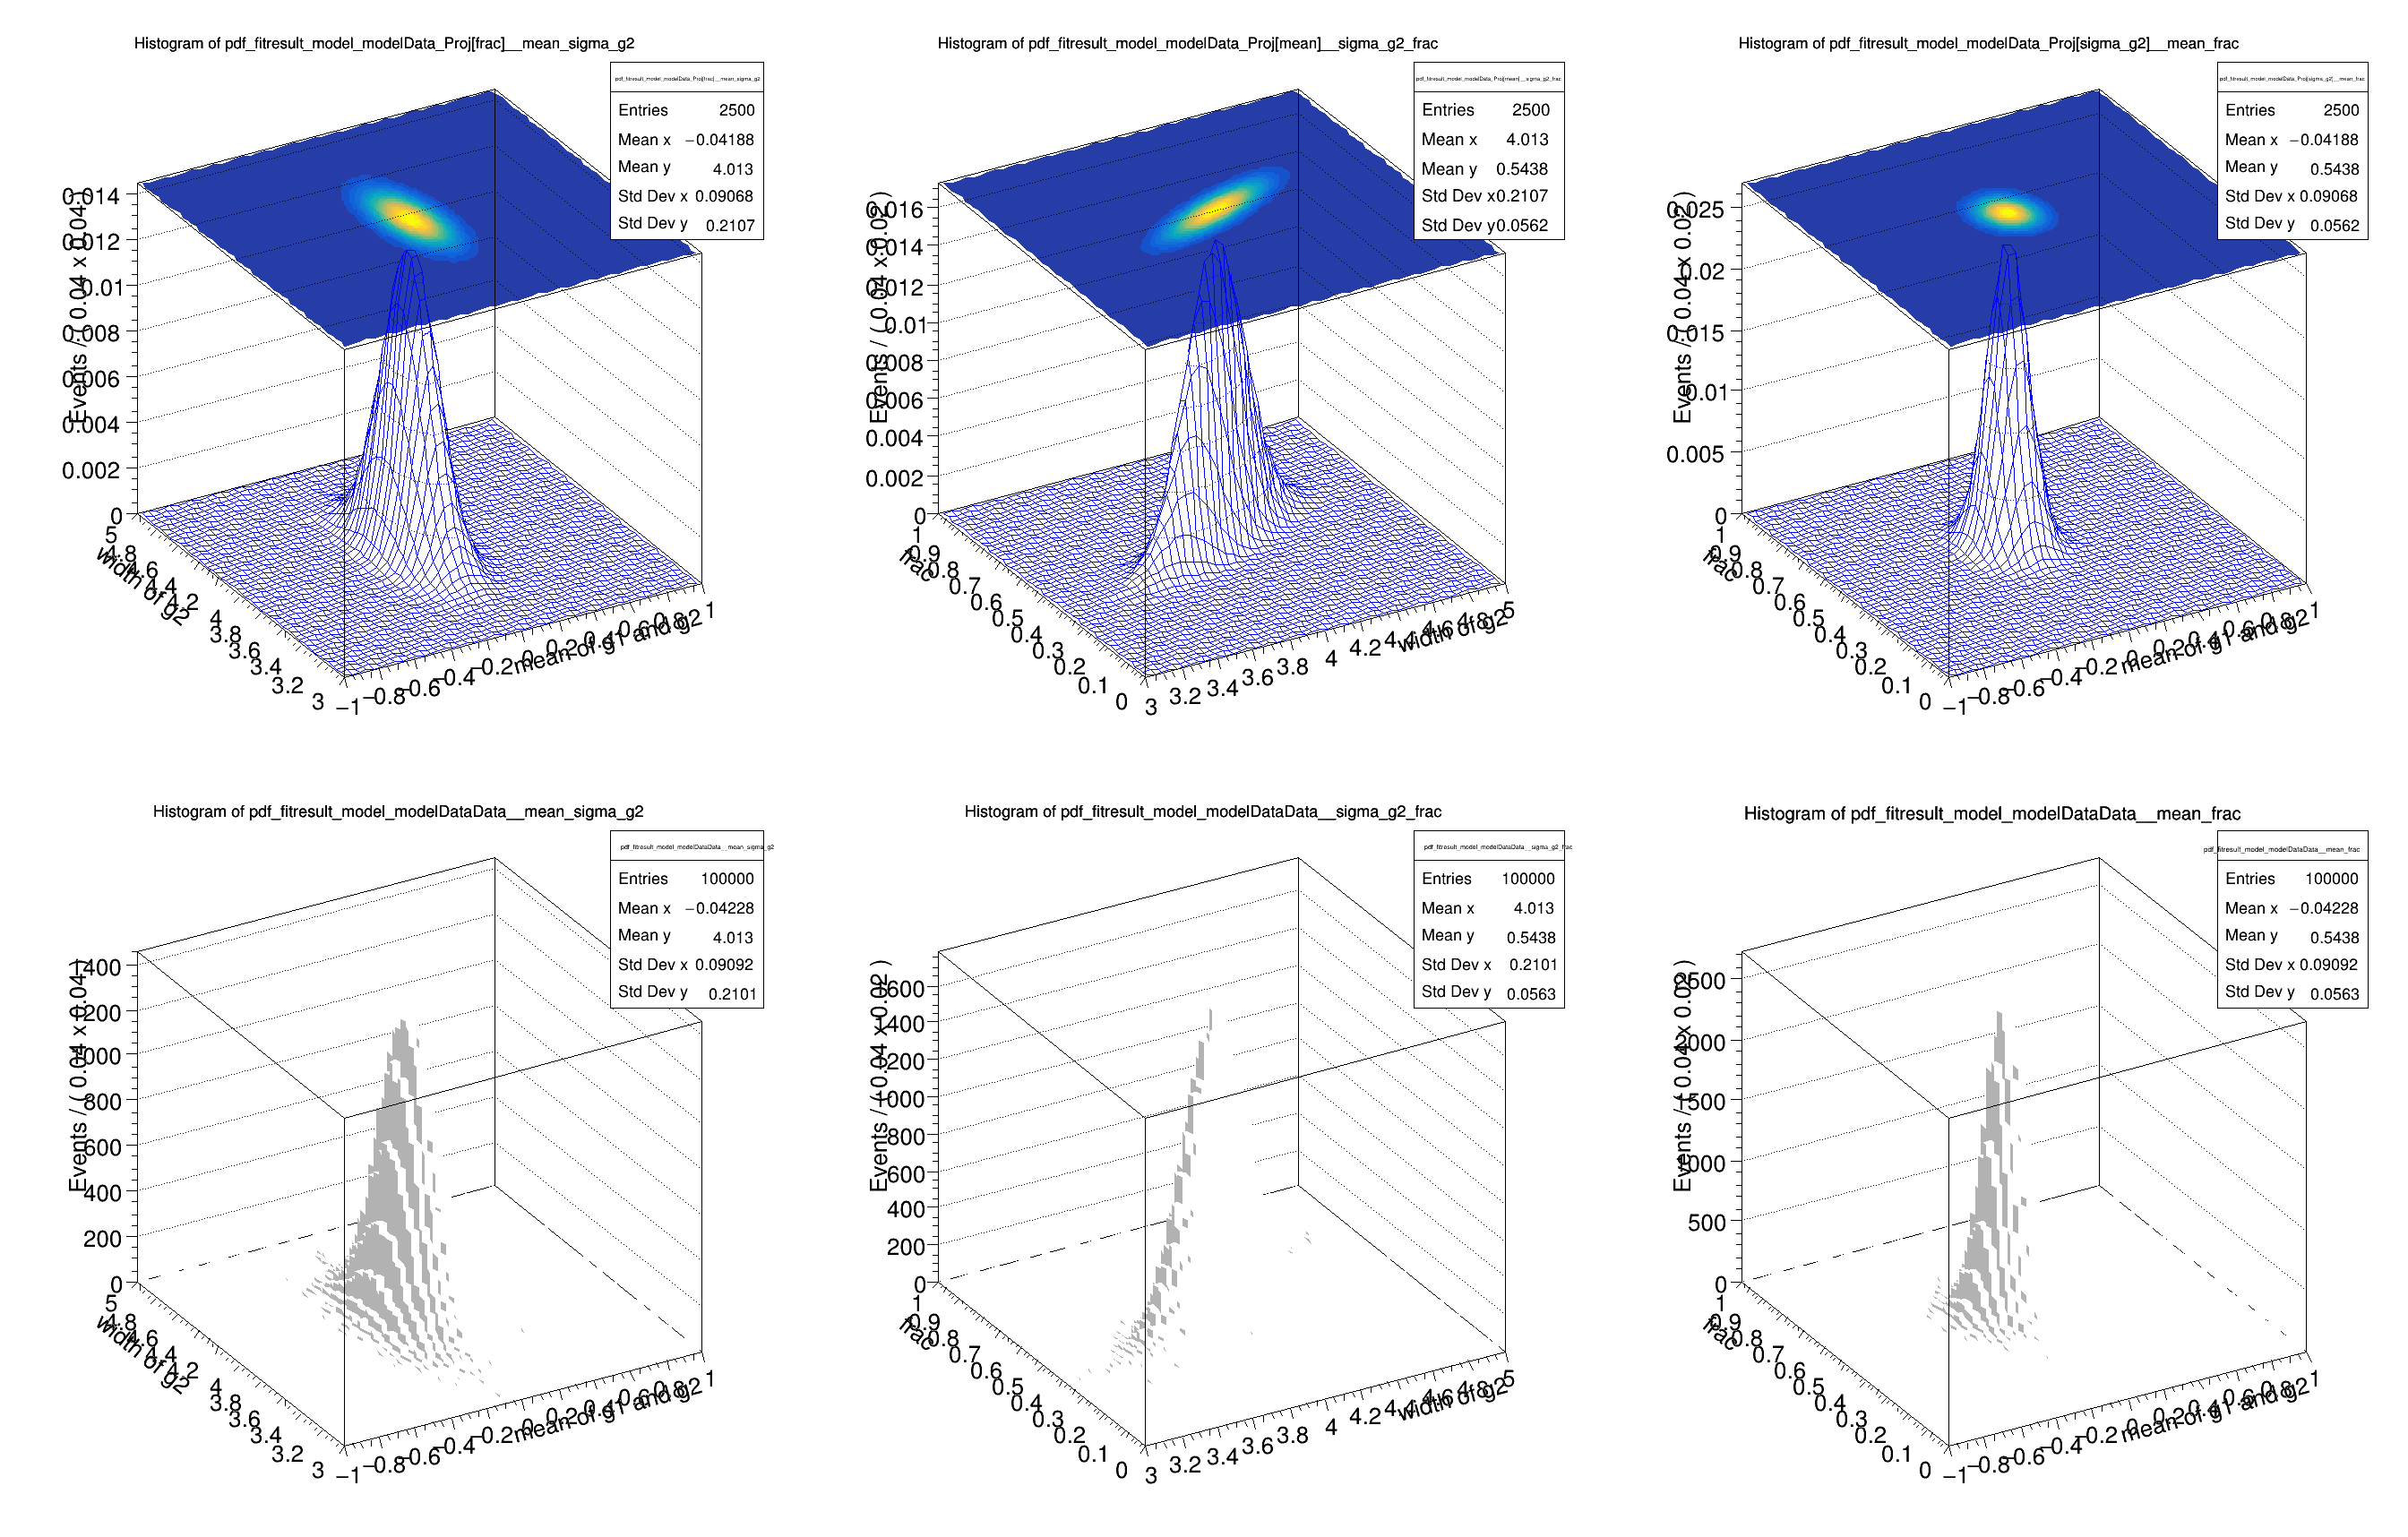
hh_mean_sigmag2->
Draw(
"surf3");
gPad->SetLeftMargin(0.15);
hh_sigmag2_frac->
Draw(
"surf3");
gPad->SetLeftMargin(0.15);
hh_mean_frac->
Draw(
"surf3");
TH1 *tmp1 =
d->createHistogram(
"mean,sigma_g2", 50, 50);
TH1 *tmp2 =
d->createHistogram(
"sigma_g2,frac", 50, 50);
TH1 *tmp3 =
d->createHistogram(
"mean,frac", 50, 50);
gPad->SetLeftMargin(0.15);
gPad->SetLeftMargin(0.15);
gPad->SetLeftMargin(0.15);
}
RooDataSet * generate(const RooArgSet &whatVars, Int_t nEvents, const RooCmdArg &arg1, const RooCmdArg &arg2=RooCmdArg::none(), const RooCmdArg &arg3=RooCmdArg::none(), const RooCmdArg &arg4=RooCmdArg::none(), const RooCmdArg &arg5=RooCmdArg::none())
See RooAbsPdf::generate(const RooArgSet&,const RooCmdArg&,const RooCmdArg&,const RooCmdArg&,...
virtual RooAbsPdf * createProjection(const RooArgSet &iset)
Return a p.d.f that represent a projection of this p.d.f integrated over given observables.
TH1 * createHistogram(const char *varNameList, Int_t xbins=0, Int_t ybins=0, Int_t zbins=0) const
Create and fill a ROOT histogram TH1, TH2 or TH3 with the values of this function for the variables w...
RooAddPdf is an efficient implementation of a sum of PDFs of the form.
RooArgList is a container object that can hold multiple RooAbsArg objects.
RooArgSet is a container object that can hold multiple RooAbsArg objects.
RooDataSet is a container class to hold unbinned data.
RooFitResult is a container class to hold the input and output of a PDF fit to a dataset.
RooRealVar represents a variable that can be changed from the outside.
virtual void SetTitleOffset(Float_t offset=1)
Set distance between the axis and the axis title.
virtual void SetFillColor(Color_t fcolor)
Set the fill area color.
virtual void SetLineColor(Color_t lcolor)
Set the line color.
TH1 is the base class of all histogram classes in ROOT.
virtual void Draw(Option_t *option="")
Draw this histogram with options.
Service class for 2-Dim histogram classes.
The 3-D histogram classes derived from the 1-D histogram classes.
The namespace RooFit contains mostly switches that change the behaviour of functions of PDFs (or othe...