
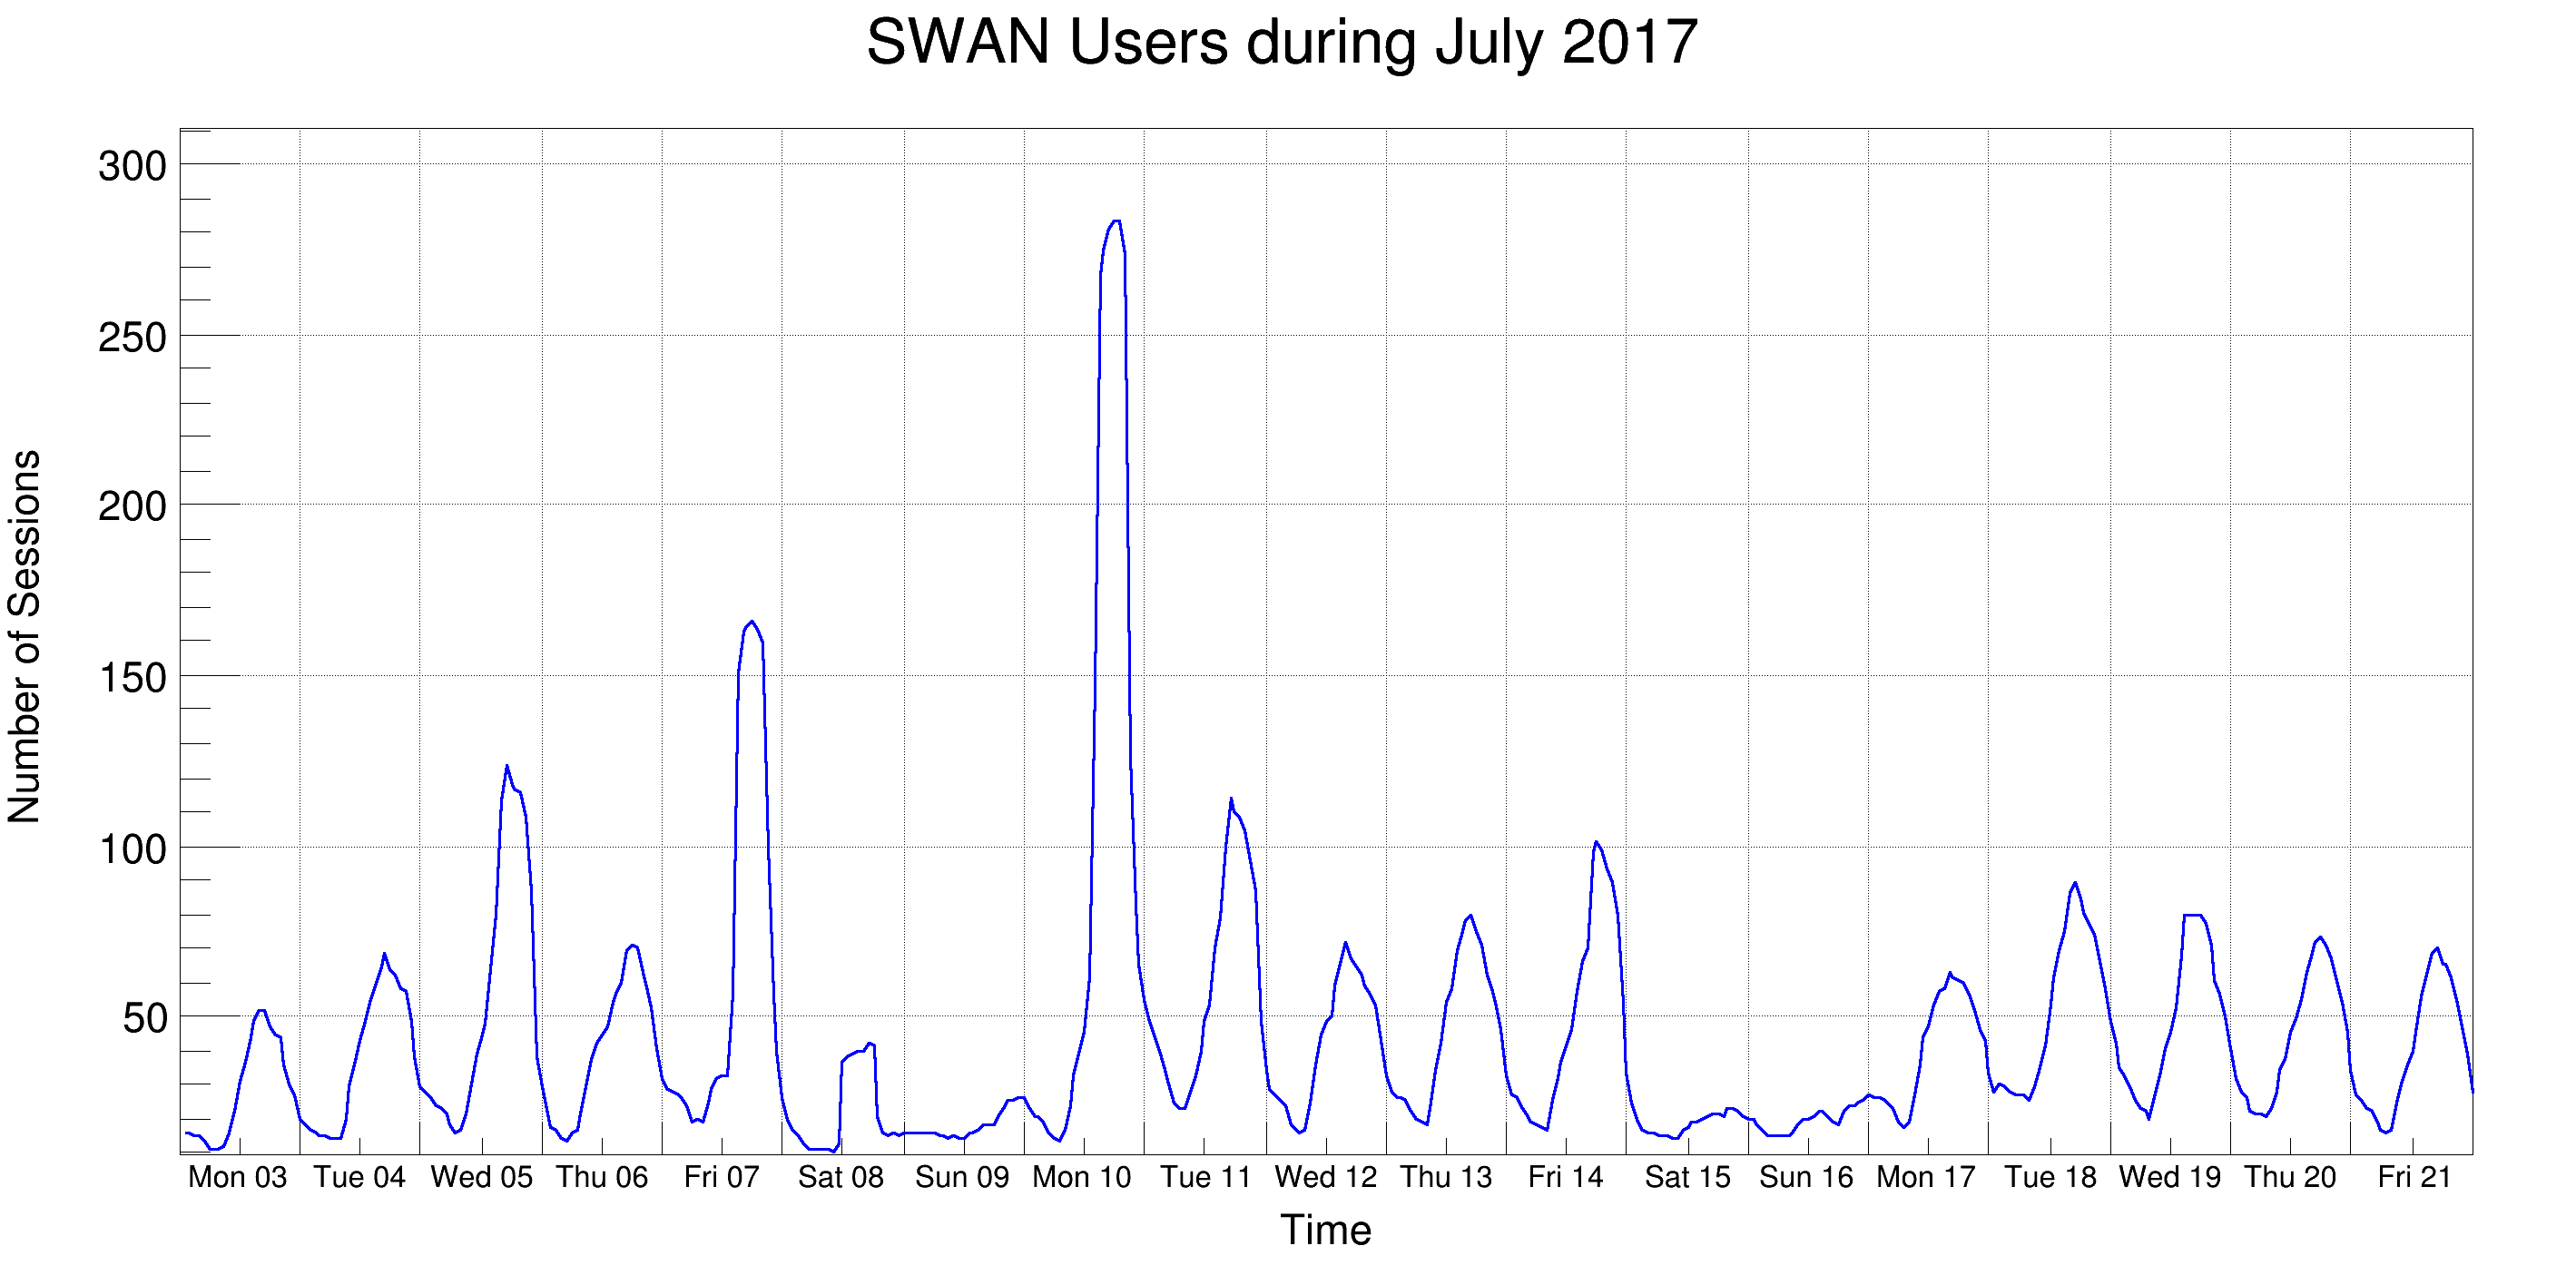
 This macro illustrates the use of the time axis on a TGraph with data read from a text file containing the SWAN usage statistics during July 2017.
{
FILE *
f = fopen(
Form(
"%sSWAN2017.dat", dir.
Data()),
"r");
g->SetTitle(
"SWAN Users during July 2017;Time;Number of Sessions");
char dt[20];
int i = 0;
while (fgets(
line, 80,
f)) {
sscanf(&
line[20],
"%f", &
v);
dt[19] = '\0';
i++;
}
auto c =
new TCanvas(
"c",
"c", 950, 500);
g->GetYaxis()->CenterTitle();
auto xaxis =
g->GetXaxis();
xaxis->SetTimeDisplay(1);
xaxis->CenterTitle();
xaxis->SetTimeFormat("%a %d");
xaxis->SetTimeOffset(0);
xaxis->SetNdivisions(-219);
xaxis->SetLimits(
TDatime(2017, 7, 3, 0, 0, 0).Convert(),
TDatime(2017, 7, 22, 0, 0, 0).Convert());
xaxis->SetLabelSize(0.025);
xaxis->CenterLabels();
}
char * Form(const char *fmt,...)
This class stores the date and time with a precision of one second in an unsigned 32 bit word (950130...
A TGraph is an object made of two arrays X and Y with npoints each.
const char * Data() const
TString & ReplaceAll(const TString &s1, const TString &s2)
TString & Append(const char *cs)
- Authors
- Danilo Piparo, Olivier Couet
Definition in file timeSeriesFromCSV.C.


