Loading [MathJax]/jax/output/HTML-CSS/config.js
Logo ROOT  
Reference Guide
 
All Classes Namespaces Files Functions Variables Typedefs Enumerations Enumerator Properties Friends Macros Modules Pages
Loading...
Searching...
No Matches
exclusiongraph2.C File Reference

Detailed Description

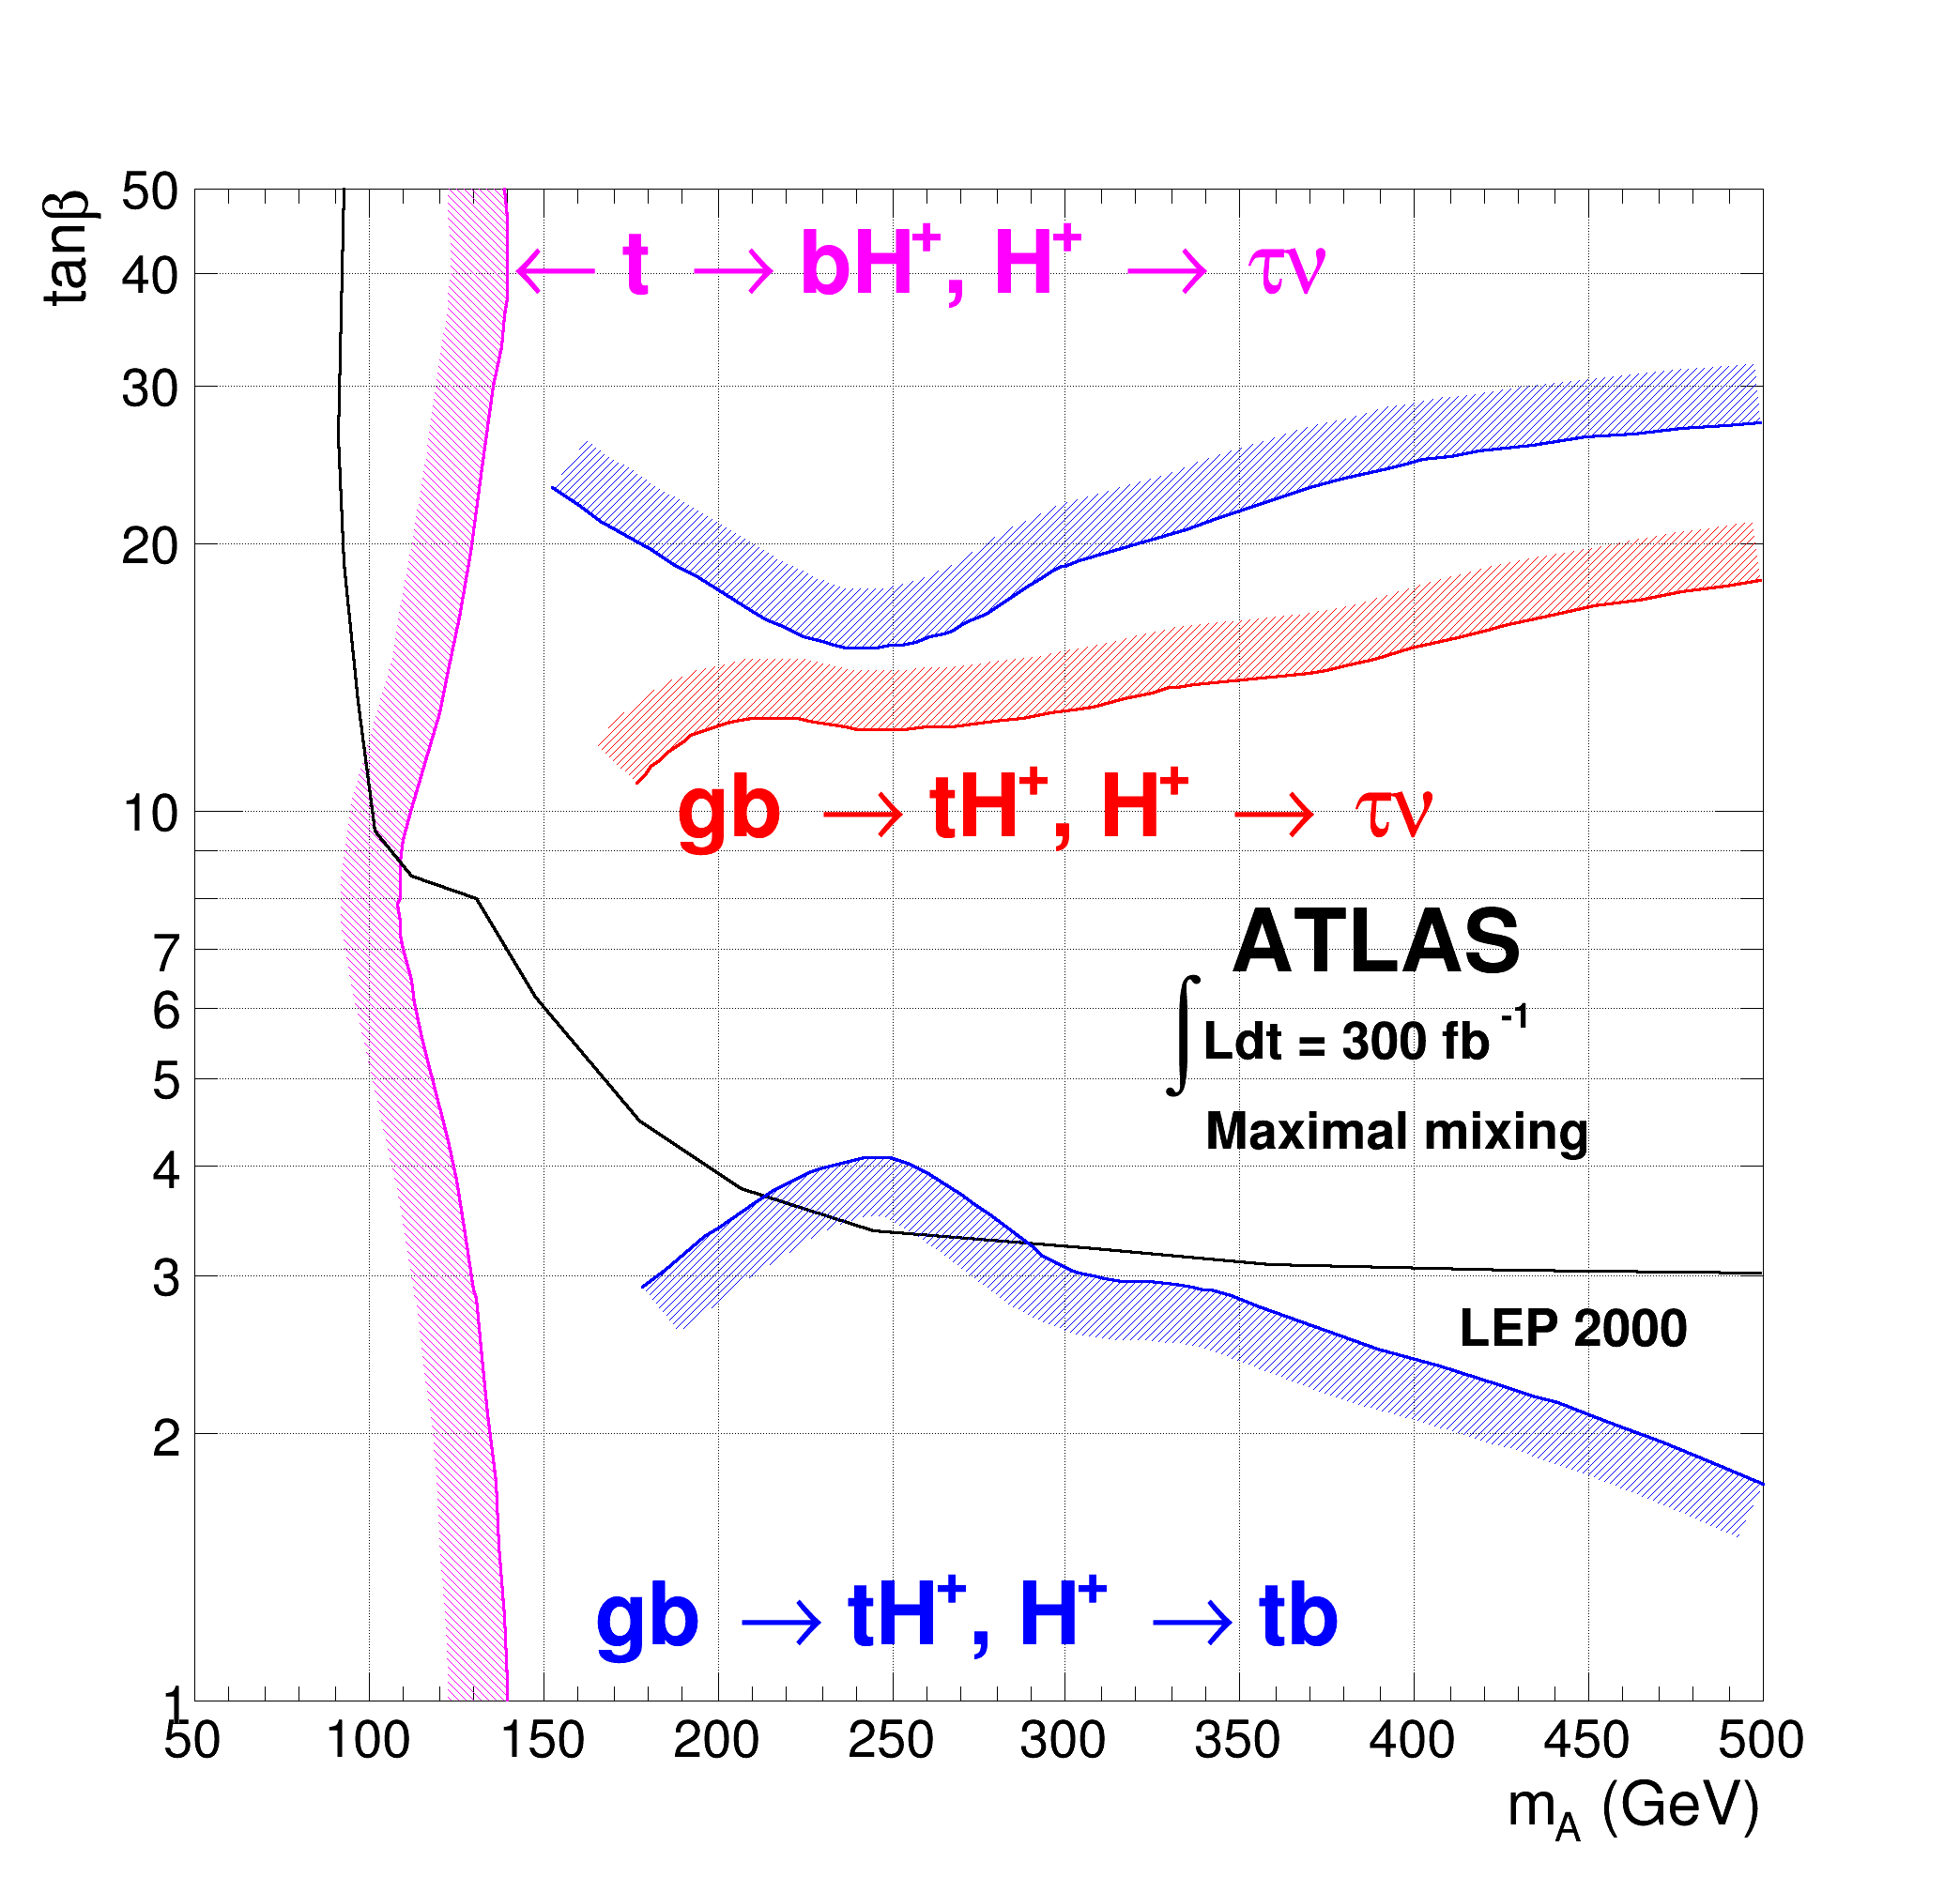
View in nbviewer Open in SWAN Draw several graphs with an exclusion zones.

void exclusiongraph2()
{
TCanvas *c = new TCanvas("c",
"Charged Higgs L300 Contour",0,0,700,700);
c->SetTickx();
c->SetTicky();
c->SetGridx();
c->SetGridy();
TH1 *frame = new TH1F("frame","",1000,50,500);
frame->SetMinimum(1);
frame->SetMaximum(50);
frame->SetDirectory(0);
frame->SetStats(0);
frame->GetXaxis()->SetTitle("m_{A} (GeV)");
frame->GetXaxis()->SetTickLength(0.02);
frame->GetXaxis()->SetLabelSize(0.03);
frame->GetYaxis()->SetTitle("tan#beta");
frame->GetYaxis()->SetLabelSize(0.03);
frame->Draw(" ");
c->SetLogy();
TGraph *gr1 = new TGraph(10);
gr1->SetFillColor(6);
gr1->SetFillStyle(3005);
gr1->SetLineColor(6);
gr1->SetLineWidth(603);
gr1->SetPoint(0,140,0.5);
gr1->SetPoint(1,130,2.9);
gr1->SetPoint(2,124.677,3.83726);
gr1->SetPoint(3,113.362,6.06903);
gr1->SetPoint(4,108.513,8.00221);
gr1->SetPoint(5,111.746,10.0272);
gr1->SetPoint(6,119.828,12.8419);
gr1->SetPoint(7,135.991,30.0872);
gr1->SetPoint(8,140,40);
gr1->SetPoint(9,135,60);
gr1->Draw("C");
TLatex *tex = new TLatex(140.841,37.9762,
"#leftarrow t #rightarrow bH^{+}, H^{+} #rightarrow #tau#nu");
tex->SetTextColor(6);
tex->Draw();
TGraph *gr2 = new TGraph(15);
gr2->SetName("Graph");
gr2->SetTitle("Graph");
gr2->SetFillColor(1);
gr2->SetFillStyle(3005);
gr2->SetLineWidth(3);
gr2->SetPoint(0,499.192,3.02622);
gr2->SetPoint(1,427.748,3.06233);
gr2->SetPoint(2,358.244,3.10722);
gr2->SetPoint(3,305.711,3.24589);
gr2->SetPoint(4,244.289,3.36617);
gr2->SetPoint(5,206.304,3.7544);
gr2->SetPoint(6,178.017,4.50347);
gr2->SetPoint(7,148.114,6.20297);
gr2->SetPoint(8,131.142,8.00221);
gr2->SetPoint(9,111.746,8.48188);
gr2->SetPoint(10,102.047,9.52921);
gr2->SetPoint(11,96.3901,13.2212);
gr2->SetPoint(12,92.3491,19.0232);
gr2->SetPoint(13,90.7328,26.3935);
gr2->SetPoint(14,93.1573,50.4385);
gr2->Draw("L");
tex = new TLatex(346.929,6.62281,"ATLAS");
tex->SetLineWidth(2);
tex->Draw();
tex = new TLatex(328.341,5.24703,"#intLdt = 300 fb^{-1}");
tex->SetTextSize(0.0297619);
tex->SetLineWidth(2);
tex->Draw();
tex = new TLatex(340.463,4.1874,"Maximal mixing");
tex->SetTextSize(0.0297619);
tex->SetLineWidth(2);
tex->Draw();
tex = new TLatex(413.2,2.51608,"LEP 2000");
tex->SetTextSize(0.0297619);
tex->SetLineWidth(2);
tex->Draw();
TGraph *gr3 = new TGraph(10);
gr3->SetName("Graph");
gr3->SetTitle("Graph");
gr3->SetFillColor(2);
gr3->SetFillStyle(3004);
gr3->SetLineColor(2);
gr3->SetLineWidth(603);
gr3->SetPoint(0,176.84,10.7499);
gr3->SetPoint(1,190.575,11.9912);
gr3->SetPoint(2,211.58,12.7108);
gr3->SetPoint(3,243.088,12.3457);
gr3->SetPoint(4,279.443,12.6185);
gr3->SetPoint(5,302.065,12.9916);
gr3->SetPoint(6,331.957,13.7713);
gr3->SetPoint(7,369.928,14.2821);
gr3->SetPoint(8,425.673,16.1651);
gr3->SetPoint(9,499.192,18.1635);
gr3->Draw("C");
tex = new TLatex(188.151,9.36035,
"gb #rightarrow tH^{+}, H^{+} #rightarrow #tau#nu");
tex->SetTextColor(2);
tex->Draw();
TGraph *gr4 = new TGraph(10);
gr4->SetName("Graph");
gr4->SetTitle("Graph");
gr4->SetFillColor(4);
gr4->SetFillStyle(3004);
gr4->SetLineColor(4);
gr4->SetLineWidth(-603);
gr4->SetPoint(0,178.456,2.91797);
gr4->SetPoint(1,200.269,3.40033);
gr4->SetPoint(2,229.354,3.96243);
gr4->SetPoint(3,249.551,4.07959);
gr4->SetPoint(4,269.749,3.71097);
gr4->SetPoint(5,298.025,3.09308);
gr4->SetPoint(6,341.652,2.89679);
gr4->SetPoint(7,378.007,2.57808);
gr4->SetPoint(8,441.023,2.16454);
gr4->SetPoint(9,499.677,1.76145);
gr4->Draw("C");
tex = new TLatex(165.,1.15498,
"gb #rightarrow tH^{+}, H^{+} #rightarrow tb");
tex->SetTextColor(4);
tex->Draw();
TGraph *gr5 = new TGraph(10);
gr5->SetName("Graph");
gr5->SetTitle("Graph");
gr5->SetFillColor(4);
gr5->SetFillStyle(3004);
gr5->SetLineColor(4);
gr5->SetLineWidth(603);
gr5->SetPoint(0,152.603,23.0996);
gr5->SetPoint(1,188.151,18.8373);
gr5->SetPoint(2,239.048,15.2499);
gr5->SetPoint(3,264.901,15.8156);
gr5->SetPoint(4,299.641,18.8373);
gr5->SetPoint(5,334.381,20.7085);
gr5->SetPoint(6,360.233,22.4362);
gr5->SetPoint(7,396.589,24.4859);
gr5->SetPoint(8,433.752,25.7669);
gr5->SetPoint(9,499.192,27.3132);
gr5->Draw("C");
}
#define c(i)
Definition RSha256.hxx:101
virtual void SetLabelSize(Float_t size=0.04)
Set size of axis labels.
Definition TAttAxis.cxx:205
virtual void SetTickLength(Float_t length=0.03)
Set tick mark length.
Definition TAttAxis.cxx:288
virtual void SetFillColor(Color_t fcolor)
Set the fill area color.
Definition TAttFill.h:37
virtual void SetFillStyle(Style_t fstyle)
Set the fill area style.
Definition TAttFill.h:39
virtual void SetLineWidth(Width_t lwidth)
Set the line width.
Definition TAttLine.h:43
virtual void SetLineColor(Color_t lcolor)
Set the line color.
Definition TAttLine.h:40
virtual void SetTextColor(Color_t tcolor=1)
Set the text color.
Definition TAttText.h:44
virtual void SetTextSize(Float_t tsize=1)
Set the text size.
Definition TAttText.h:47
void SetMoreLogLabels(Bool_t more=kTRUE)
Set the kMoreLogLabels bit flag When this option is selected more labels are drawn when in log scale ...
Definition TAxis.h:213
The Canvas class.
Definition TCanvas.h:23
A TGraph is an object made of two arrays X and Y with npoints each.
Definition TGraph.h:41
virtual void SetPoint(Int_t i, Double_t x, Double_t y)
Set x and y values for point number i.
Definition TGraph.cxx:2298
virtual void SetName(const char *name="")
Set graph name.
Definition TGraph.cxx:2337
virtual void SetTitle(const char *title="")
Change (i.e.
Definition TGraph.cxx:2353
virtual void Draw(Option_t *chopt="")
Draw this graph with its current attributes.
Definition TGraph.cxx:769
1-D histogram with a float per channel (see TH1 documentation)}
Definition TH1.h:575
TH1 is the base class of all histogram classes in ROOT.
Definition TH1.h:58
virtual void SetDirectory(TDirectory *dir)
By default, when a histogram is created, it is added to the list of histogram objects in the current ...
Definition TH1.cxx:8767
TAxis * GetXaxis()
Get the behaviour adopted by the object about the statoverflows. See EStatOverflows for more informat...
Definition TH1.h:320
virtual void SetMaximum(Double_t maximum=-1111)
Definition TH1.h:398
TAxis * GetYaxis()
Definition TH1.h:321
virtual void SetMinimum(Double_t minimum=-1111)
Definition TH1.h:399
virtual void Draw(Option_t *option="")
Draw this histogram with options.
Definition TH1.cxx:3074
virtual void SetStats(Bool_t stats=kTRUE)
Set statistics option on/off.
Definition TH1.cxx:8820
To draw Mathematical Formula.
Definition TLatex.h:18
virtual void SetTitle(const char *title="")
Set the title of the TNamed.
Definition TNamed.cxx:164
virtual void Draw(Option_t *option="")
Default Draw method for all objects.
Definition TObject.cxx:267
Author
Olivier Couet

Definition in file exclusiongraph2.C.