void graphpolar()
{
for (
Int_t ipt = 0; ipt < 1000; ipt++){
}
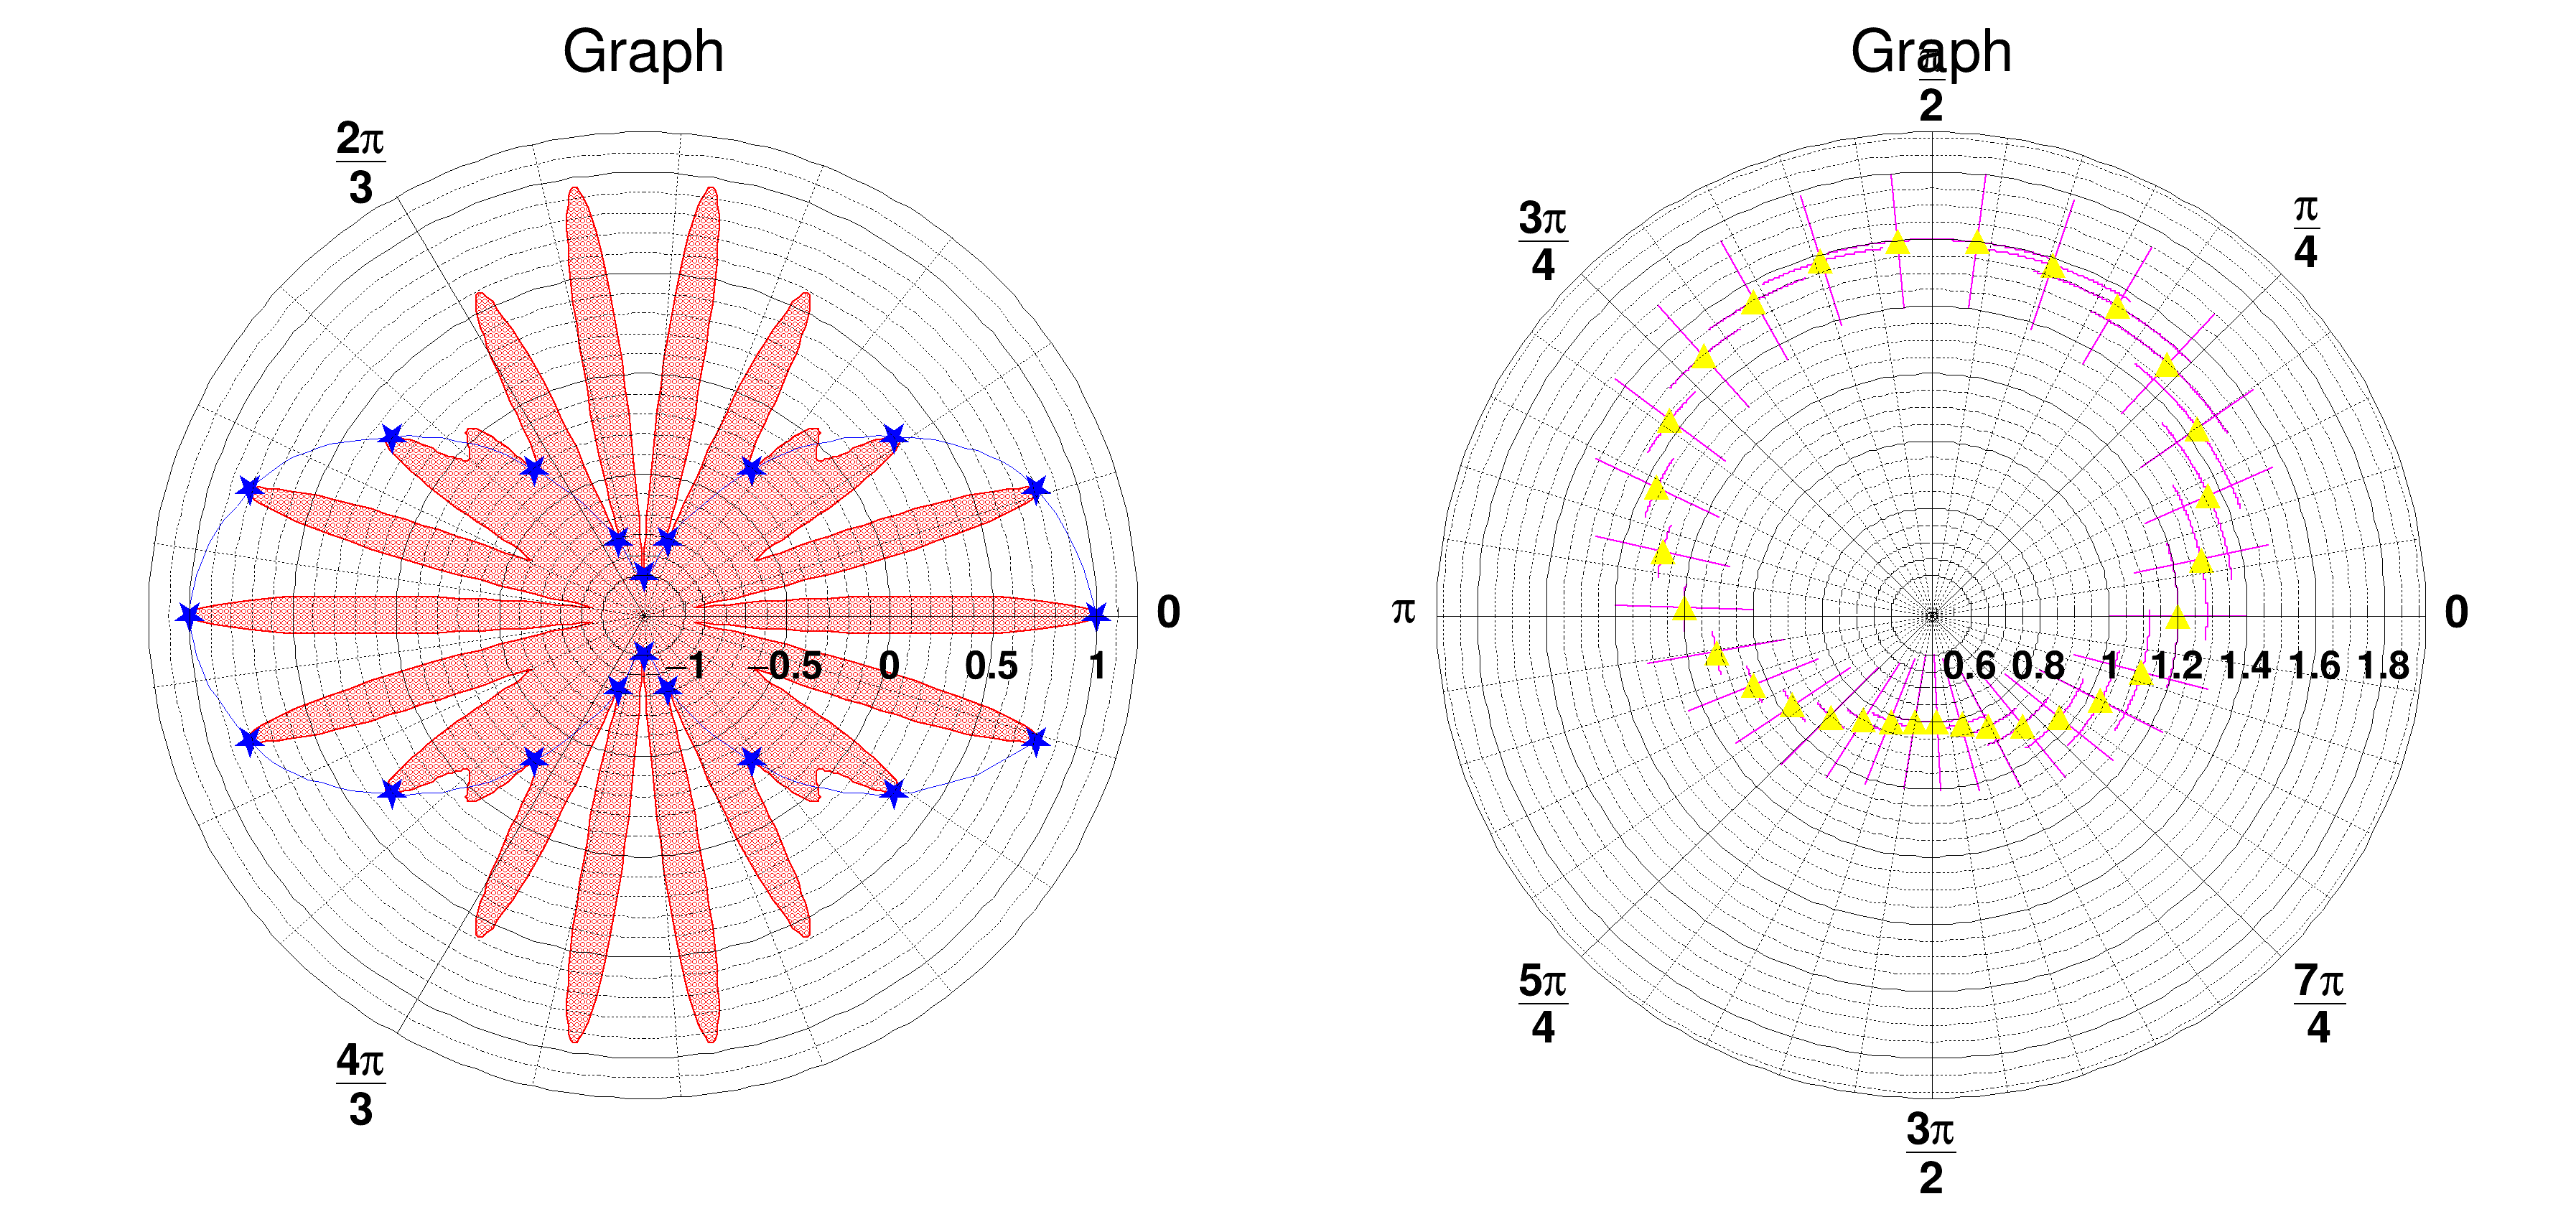
for (
Int_t ipt = 0; ipt < 20; ipt++){
xval1[ipt] =
x[1000/20*ipt];
yval1[ipt] =
y[1000/20*ipt];
}
for (
Int_t ipt = 0; ipt < 30; ipt++){
x2[ipt] =
x[1000/30*ipt];
y2[ipt] = 1.2 + 0.4*sin(
TMath::Pi()*2*ipt/30);
}
}
static const double x2[5]
virtual void SetFillColor(Color_t fcolor)
Set the fill area color.
virtual void SetFillStyle(Style_t fstyle)
Set the fill area style.
virtual void SetLineWidth(Width_t lwidth)
Set the line width.
virtual void SetLineColor(Color_t lcolor)
Set the line color.
virtual void SetMarkerColor(Color_t mcolor=1)
Set the marker color.
virtual void SetMarkerStyle(Style_t mstyle=1)
Set the marker style.
virtual void SetMarkerSize(Size_t msize=1)
Set the marker size.
virtual void SetTextColor(Color_t tcolor=1)
Set the text color.
virtual void SetTextSize(Float_t tsize=1)
Set the text size.
TVirtualPad * cd(Int_t subpadnumber=0) override
Set current canvas & pad.
void Update() override
Update canvas pad buffers.
virtual Double_t Eval(Double_t x, Double_t y=0, Double_t z=0, Double_t t=0) const
Evaluate this function.
TGraphPolargram * GetPolargram()
void Draw(Option_t *options="")
Draw TGraphPolar.
void SetRangePolar(Double_t tmin, Double_t tmax)
Allows to change range Polar.
void SetTwoPi()
Set range from 0 to 2*pi.
void SetNdivPolar(Int_t Ndiv=508)
Set the number of Polar divisions: enter a number ij with 0<i<99 and 0<j<99.
void SetToRadian()
The Polar circle is labelled using radian.
void Divide(Int_t nx=1, Int_t ny=1, Float_t xmargin=0.01, Float_t ymargin=0.01, Int_t color=0) override
Automatic pad generation by division.