import ROOT
x = ROOT.RooRealVar("x", "x", -8, 8)
mean = ROOT.RooRealVar("mean", "mean", 0, -8, 8)
sigma = ROOT.RooRealVar("sigma", "sigma", 0.3, 0.1, 10)
gx = ROOT.RooGaussian("gx", "gx", x, mean, sigma)
a0 = ROOT.RooRealVar("a0", "a0", -0.1, -1, 1)
a1 = ROOT.RooRealVar("a1", "a1", 0.004, -1, 1)
px = ROOT.RooChebychev("px", "px", x, [a0, a1])
f = ROOT.RooRealVar("f", "f", 0.2, 0.0, 1.0)
model = ROOT.RooAddPdf("model", "model", [gx, px], [f])
mean_ctl = ROOT.RooRealVar("mean_ctl", "mean_ctl", -3, -8, 8)
gx_ctl = ROOT.RooGaussian("gx_ctl", "gx_ctl", x, mean_ctl, sigma)
a0_ctl = ROOT.RooRealVar("a0_ctl", "a0_ctl", -0.1, -1, 1)
a1_ctl = ROOT.RooRealVar("a1_ctl", "a1_ctl", 0.5, -0.1, 1)
px_ctl = ROOT.RooChebychev("px_ctl", "px_ctl", x, [a0_ctl, a1_ctl])
f_ctl = ROOT.RooRealVar("f_ctl", "f_ctl", 0.5, 0.0, 1.0)
model_ctl = ROOT.RooAddPdf("model_ctl", "model_ctl", [gx_ctl, px_ctl], [f_ctl])
data = model.generate({x}, 100)
data_ctl = model_ctl.generate({x}, 2000)
sample = ROOT.RooCategory("sample", "sample")
sample.defineType("physics")
sample.defineType("control")
combData = ROOT.RooDataSet(
"combData",
"combined data",
{x},
Index=sample,
Import={"physics": data, "control": data_ctl},
)
simPdf = ROOT.RooSimultaneous("simPdf", "simultaneous pdf", {"physics": model, "control": model_ctl}, sample)
fitResult = simPdf.fitTo(combData, PrintLevel=-1, Save=True)
fitResult.Print()
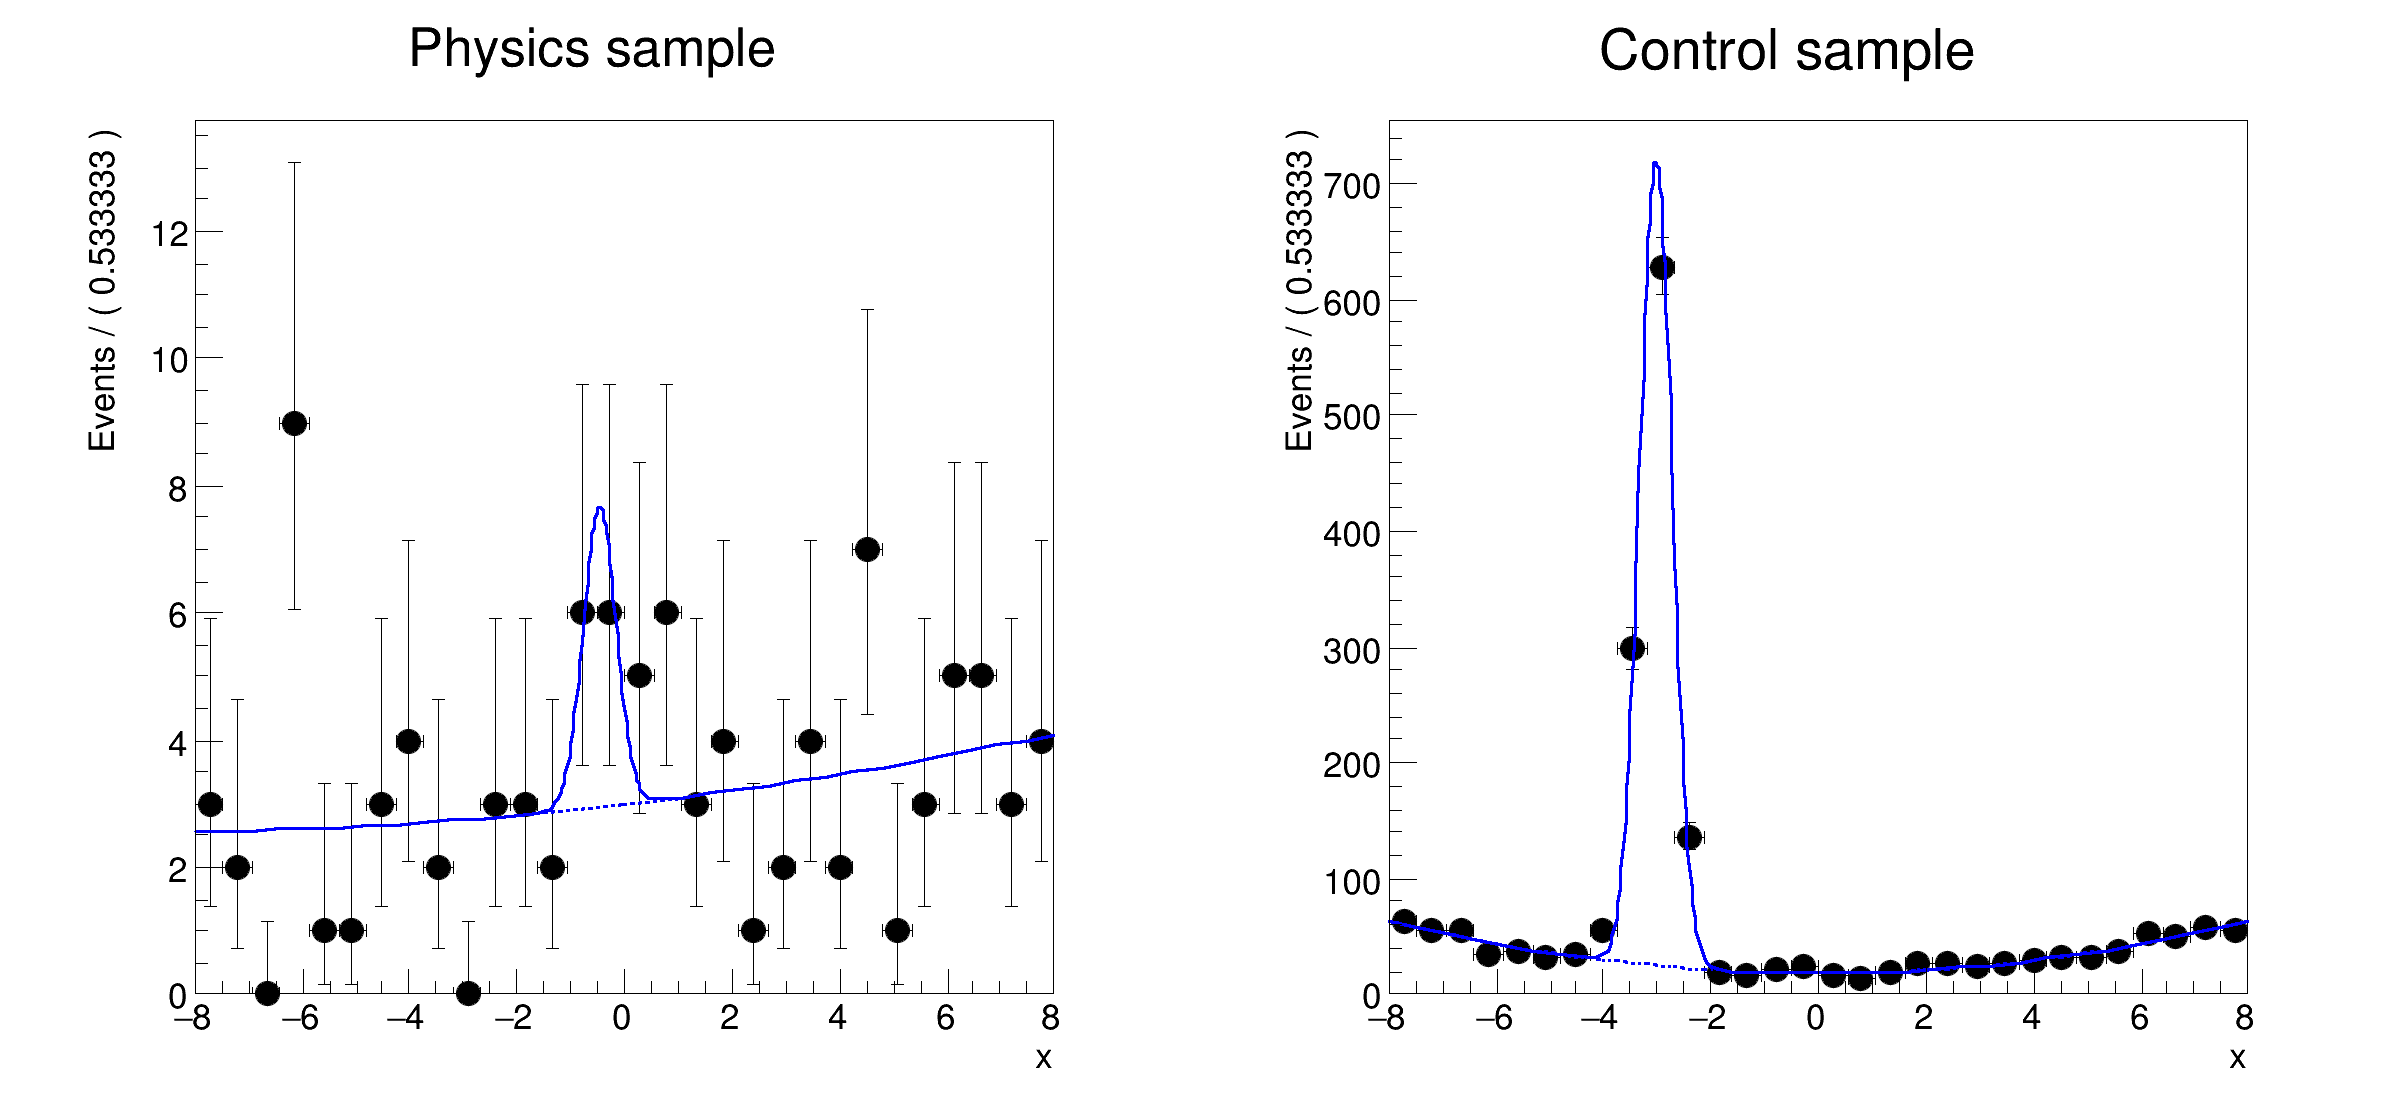
frame1 = x.frame(Bins=30, Title="Physics sample")
combData.plotOn(frame1, Cut="sample==sample::physics")
simPdf.plotOn(frame1, Slice=(sample, "physics"), ProjWData=(sample, combData))
simPdf.plotOn(frame1, Slice=(sample, "physics"), Components="px", ProjWData=(sample, combData), LineStyle="--")
frame2 = x.frame(Bins=30, Title="Control sample")
combData.plotOn(frame2, Cut="sample==sample::control")
simPdf.plotOn(frame2, Slice=(sample, "control"), ProjWData=(sample, combData))
simPdf.plotOn(frame2, Slice=(sample, "control"), Components="px_ctl", ProjWData=(sample, combData), LineStyle="--")
c = ROOT.TCanvas("rf501_simultaneouspdf", "rf501_simultaneouspdf", 800, 400)
c.Divide(2)
c.cd(1)
ROOT.gPad.SetLeftMargin(0.15)
frame1.GetYaxis().SetTitleOffset(1.4)
frame1.Draw()
c.cd(2)
ROOT.gPad.SetLeftMargin(0.15)
frame2.GetYaxis().SetTitleOffset(1.4)
frame2.Draw()
c.SaveAs("rf501_simultaneouspdf.png")
RooAbsTestStatistic::initSimMode: creating slave calculator #0 for state control (2000 dataset entries)
RooAbsTestStatistic::initSimMode: creating slave calculator #1 for state physics (100 dataset entries)
[#1] INFO:Fitting -- RooAbsTestStatistic::initSimMode: created 2 slave calculators.
[#1] INFO:Minimization -- RooAbsMinimizerFcn::setOptimizeConst: activating const optimization
[#1] INFO:Minimization -- The following expressions will be evaluated in cache-and-track mode: (gx_ctl,px_ctl)
[#1] INFO:Minimization -- The following expressions will be evaluated in cache-and-track mode: (gx,px)
[#1] INFO:Minimization -- RooAbsMinimizerFcn::setOptimizeConst: deactivating const optimization
RooFitResult: minimized FCN value: 5773.95, estimated distance to minimum: 9.09933e-05
covariance matrix quality: Full, accurate covariance matrix
Status : MINIMIZE=0 HESSE=0
Floating Parameter FinalValue +/- Error
-------------------- --------------------------
a0 2.4369e-01 +/- 1.75e-01
a0_ctl -4.3957e-03 +/- 5.29e-02
a1 5.2692e-02 +/- 1.78e-01
a1_ctl 5.4474e-01 +/- 3.70e-02
f 6.8391e-02 +/- 3.86e-02
f_ctl 5.0279e-01 +/- 1.24e-02
mean -4.6480e-01 +/- 2.34e-01
mean_ctl -3.0263e+00 +/- 1.08e-02
sigma 3.0786e-01 +/- 8.77e-03
[#1] INFO:Plotting -- RooTreeData::plotOn: plotting 100 events out of 2100 total events
[#1] INFO:Plotting -- RooSimultaneous::plotOn(simPdf) plot on x represents a slice in the index category (sample)
[#1] INFO:Plotting -- RooAbsReal::plotOn(model) slice variable sample was not projected anyway
[#1] INFO:Plotting -- RooSimultaneous::plotOn(simPdf) plot on x represents a slice in the index category (sample)
[#1] INFO:Plotting -- RooAbsPdf::plotOn(model) directly selected PDF components: (px)
[#1] INFO:Plotting -- RooAbsPdf::plotOn(model) indirectly selected PDF components: ()
[#1] INFO:Plotting -- RooAbsReal::plotOn(model) slice variable sample was not projected anyway
[#1] INFO:Plotting -- RooTreeData::plotOn: plotting 2000 events out of 2100 total events
[#1] INFO:Plotting -- RooSimultaneous::plotOn(simPdf) plot on x represents a slice in the index category (sample)
[#1] INFO:Plotting -- RooAbsReal::plotOn(model_ctl) slice variable sample was not projected anyway
[#1] INFO:Plotting -- RooSimultaneous::plotOn(simPdf) plot on x represents a slice in the index category (sample)
[#1] INFO:Plotting -- RooAbsPdf::plotOn(model_ctl) directly selected PDF components: (px_ctl)
[#1] INFO:Plotting -- RooAbsPdf::plotOn(model_ctl) indirectly selected PDF components: ()
[#1] INFO:Plotting -- RooAbsReal::plotOn(model_ctl) slice variable sample was not projected anyway