ROOT
tags/v6-34-10
Reference Guide
Loading...
Searching...
No Matches
feynman.C File Reference
Tutorials
»
Graphics tutorials
Detailed Description
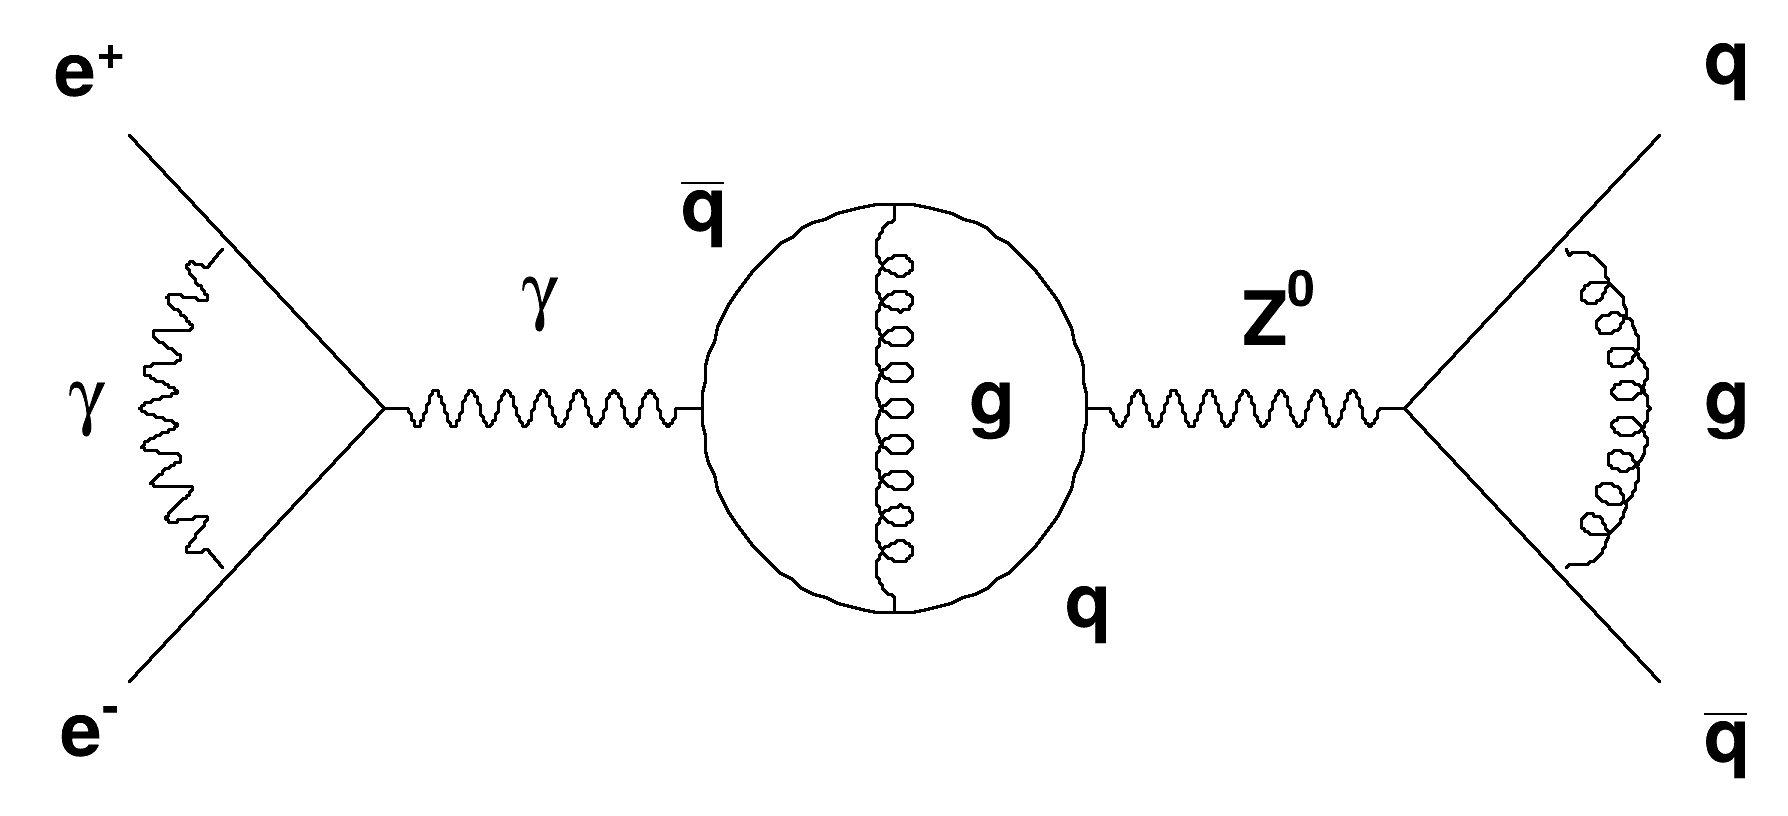
Draw Feynman diagrams.
void
feynman
()
{
TCanvas
*
c1
=
new
TCanvas
(
"c1"
,
"A canvas"
, 10,10, 600, 300);
c1
->Range(0, 0, 140, 60);
Int_t
linsav
=
gStyle
->
GetLineWidth
();
gStyle
->
SetLineWidth
(3);
TLatex
t;
t.
SetTextAlign
(22);
t.
SetTextSize
(0.1);
TLine
*
l
;
l
=
new
TLine
(10, 10, 30, 30);
l
->
Draw
();
l
=
new
TLine
(10, 50, 30, 30);
l
->
Draw
();
TCurlyArc
*
ginit
=
new
TCurlyArc
(30, 30, 12.5*sqrt(2), 135, 225);
ginit
->SetWavy();
ginit
->Draw();
t.
DrawLatex
(7,6,
"e^{-}"
);
t.
DrawLatex
(7,55,
"e^{+}"
);
t.
DrawLatex
(7,30,
"#gamma"
);
TCurlyLine
*Gamma =
new
TCurlyLine
(30, 30, 55, 30);
Gamma->SetWavy();
Gamma->Draw();
t.
DrawLatex
(42.5,37.7,
"#gamma"
);
TArc
*
a
=
new
TArc
(70, 30, 15);
a
->Draw();
t.
DrawLatex
(55, 45,
"#bar{q}"
);
t.
DrawLatex
(85, 15,
"q"
);
TCurlyLine
*
gluon
=
new
TCurlyLine
(70, 45, 70, 15);
gluon
->Draw();
t.
DrawLatex
(77.5,30,
"g"
);
TCurlyLine
*z0 =
new
TCurlyLine
(85, 30, 110, 30);
z0->
SetWavy
();
z0->
Draw
();
t.
DrawLatex
(100, 37.5,
"Z^{0}"
);
l
=
new
TLine
(110, 30, 130, 10);
l
->
Draw
();
l
=
new
TLine
(110, 30, 130, 50);
l
->
Draw
();
TCurlyArc
*
gluon1
=
new
TCurlyArc
(110, 30, 12.5*sqrt(2), 315, 45);
gluon1
->Draw();
t.
DrawLatex
(135,6,
"#bar{q}"
);
t.
DrawLatex
(135,55,
"q"
);
t.
DrawLatex
(135,30,
"g"
);
c1
->Update();
gStyle
->
SetLineWidth
(
linsav
);
}
a
#define a(i)
Definition
RSha256.hxx:99
Int_t
int Int_t
Definition
RtypesCore.h:45
TRangeDynCast
ROOT::Detail::TRangeCast< T, true > TRangeDynCast
TRangeDynCast is an adapter class that allows the typed iteration through a TCollection.
Definition
TCollection.h:358
gStyle
R__EXTERN TStyle * gStyle
Definition
TStyle.h:436
ROOT::Detail::TRangeCast
Definition
TCollection.h:311
TArc
Create an Arc.
Definition
TArc.h:26
TAttLine::GetLineWidth
virtual Width_t GetLineWidth() const
Return the line width.
Definition
TAttLine.h:35
TAttLine::SetLineWidth
virtual void SetLineWidth(Width_t lwidth)
Set the line width.
Definition
TAttLine.h:43
TAttText::SetTextAlign
virtual void SetTextAlign(Short_t align=11)
Set the text alignment.
Definition
TAttText.h:42
TAttText::SetTextSize
virtual void SetTextSize(Float_t tsize=1)
Set the text size.
Definition
TAttText.h:47
TCanvas
The Canvas class.
Definition
TCanvas.h:23
TCurlyArc
Implements curly or wavy arcs used to draw Feynman diagrams.
Definition
TCurlyArc.h:16
TCurlyLine
Implements curly or wavy polylines used to draw Feynman diagrams.
Definition
TCurlyLine.h:19
TCurlyLine::SetWavy
virtual void SetWavy()
Set wavy.
Definition
TCurlyLine.cxx:369
TLatex
To draw Mathematical Formula.
Definition
TLatex.h:18
TLatex::DrawLatex
TLatex * DrawLatex(Double_t x, Double_t y, const char *text)
Make a copy of this object with the new parameters And copy object attributes.
Definition
TLatex.cxx:1943
TLine
Use the TLine constructor to create a simple line.
Definition
TLine.h:22
TObject::Draw
virtual void Draw(Option_t *option="")
Default Draw method for all objects.
Definition
TObject.cxx:280
TPolyLine::Draw
void Draw(Option_t *option="") override
Draw this polyline with its current attributes.
Definition
TPolyLine.cxx:215
c1
return c1
Definition
legend1.C:41
ginit
static int ginit
Definition
rsalib.cxx:256
l
TLine l
Definition
textangle.C:4
Author
Otto Schaile
Definition in file
feynman.C
.
tutorials
graphics
feynman.C
ROOT tags/v6-34-10 - Reference Guide Generated on Mon Jun 30 2025 10:56:44 (GVA Time) using Doxygen 1.10.0