Logo ROOT  
Reference Guide
 
All Classes Namespaces Files Functions Variables Typedefs Enumerations Enumerator Properties Friends Macros Modules Pages
Loading...
Searching...
No Matches
gerrors2.C File Reference

Detailed Description

View in nbviewer Open in SWAN
Draw two graphs with error bars

void gerrors2() {
TCanvas *c1 = new TCanvas("c1","gerrors2",200,10,700,500);
c1->SetGrid();
// draw a frame to define the range
TH1F *hr = c1->DrawFrame(-0.4,0,1.2,12);
hr->SetXTitle("X title");
hr->SetYTitle("Y title");
c1->GetFrame()->SetBorderSize(12);
// create first graph
const Int_t n1 = 10;
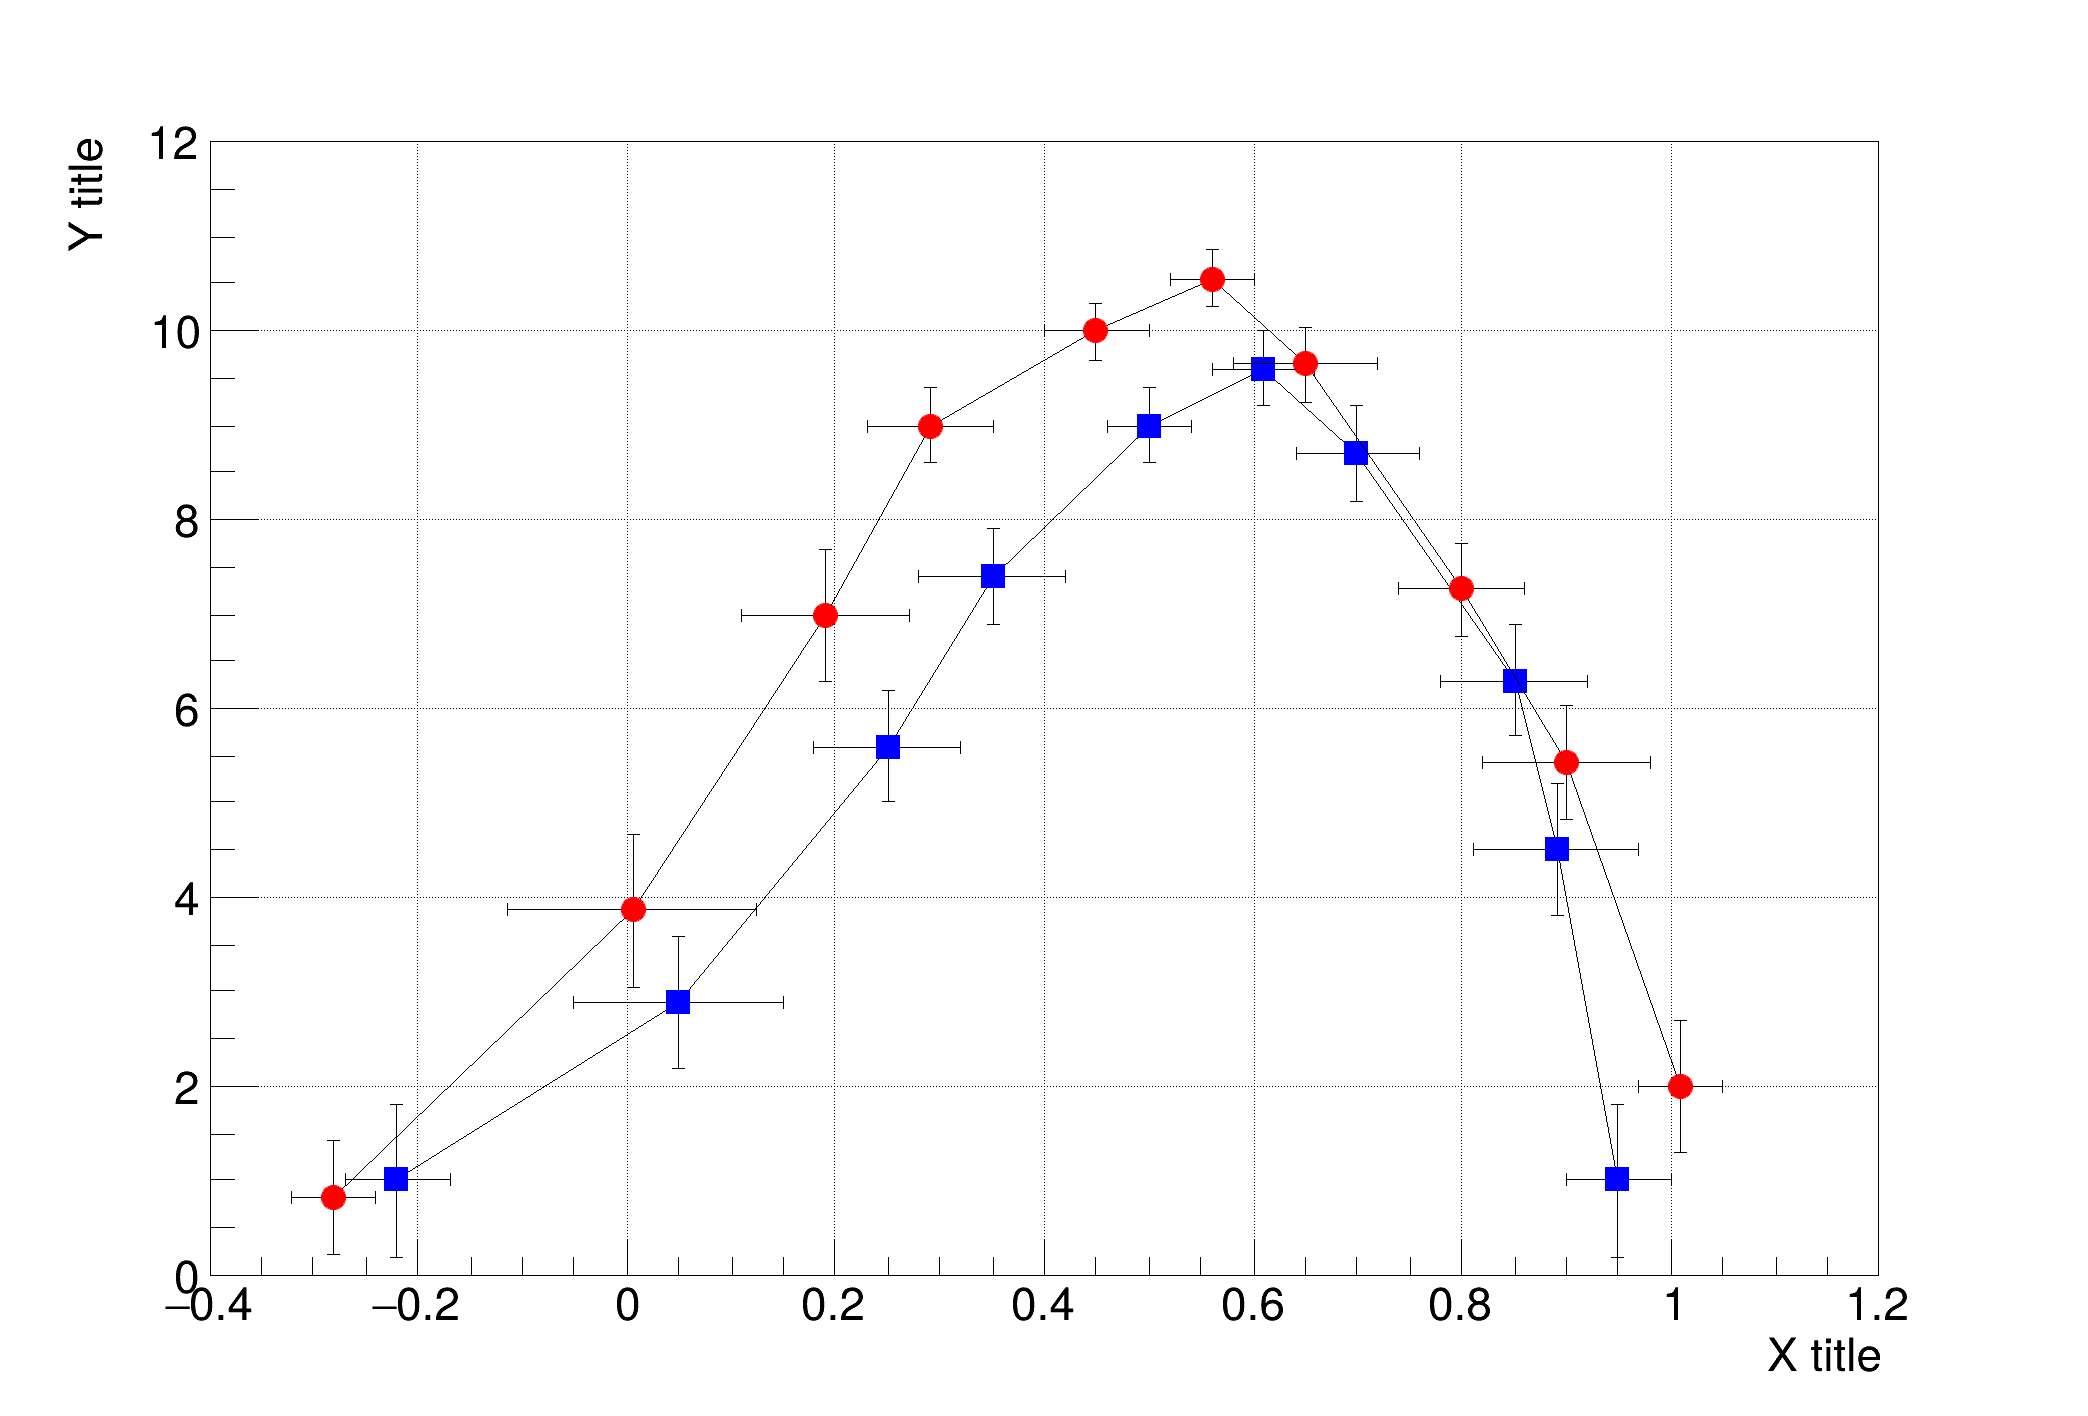
Double_t xval1[] = {-0.22, 0.05, 0.25, 0.35, 0.5, 0.61,0.7,0.85,0.89,0.95};
Double_t yval1[] = {1,2.9,5.6,7.4,9,9.6,8.7,6.3,4.5,1};
Double_t ex1[] = {.05,.1,.07,.07,.04,.05,.06,.07,.08,.05};
Double_t ey1[] = {.8,.7,.6,.5,.4,.4,.5,.6,.7,.8};
gr1->SetMarkerColor(kBlue);
gr1->SetMarkerStyle(21);
gr1->Draw("LP");
// create second graph
const Int_t n2 = 10;
Float_t xval2[] = {-0.28, 0.005, 0.19, 0.29, 0.45, 0.56,0.65,0.80,0.90,1.01};
Float_t yval2[] = {0.82,3.86,7,9,10,10.55,9.64,7.26,5.42,2};
Float_t ex2[] = {.04,.12,.08,.06,.05,.04,.07,.06,.08,.04};
Float_t ey2[] = {.6,.8,.7,.4,.3,.3,.4,.5,.6,.7};
gr2->SetMarkerColor(kRed);
gr2->SetMarkerStyle(20);
gr2->Draw("LP");
}
int Int_t
Definition RtypesCore.h:45
float Float_t
Definition RtypesCore.h:57
double Double_t
Definition RtypesCore.h:59
@ kRed
Definition Rtypes.h:66
@ kBlue
Definition Rtypes.h:66
ROOT::Detail::TRangeCast< T, true > TRangeDynCast
TRangeDynCast is an adapter class that allows the typed iteration through a TCollection.
The Canvas class.
Definition TCanvas.h:23
A TGraphErrors is a TGraph with error bars.
1-D histogram with a float per channel (see TH1 documentation)
Definition TH1.h:622
return c1
Definition legend1.C:41
Author
Rene Brun

Definition in file gerrors2.C.