Logo ROOT  
Reference Guide
 
All Classes Namespaces Files Functions Variables Typedefs Enumerations Enumerator Properties Friends Macros Modules Pages
Loading...
Searching...
No Matches
timeSeriesFromCSV.py File Reference

Detailed Description

View in nbviewer Open in SWAN
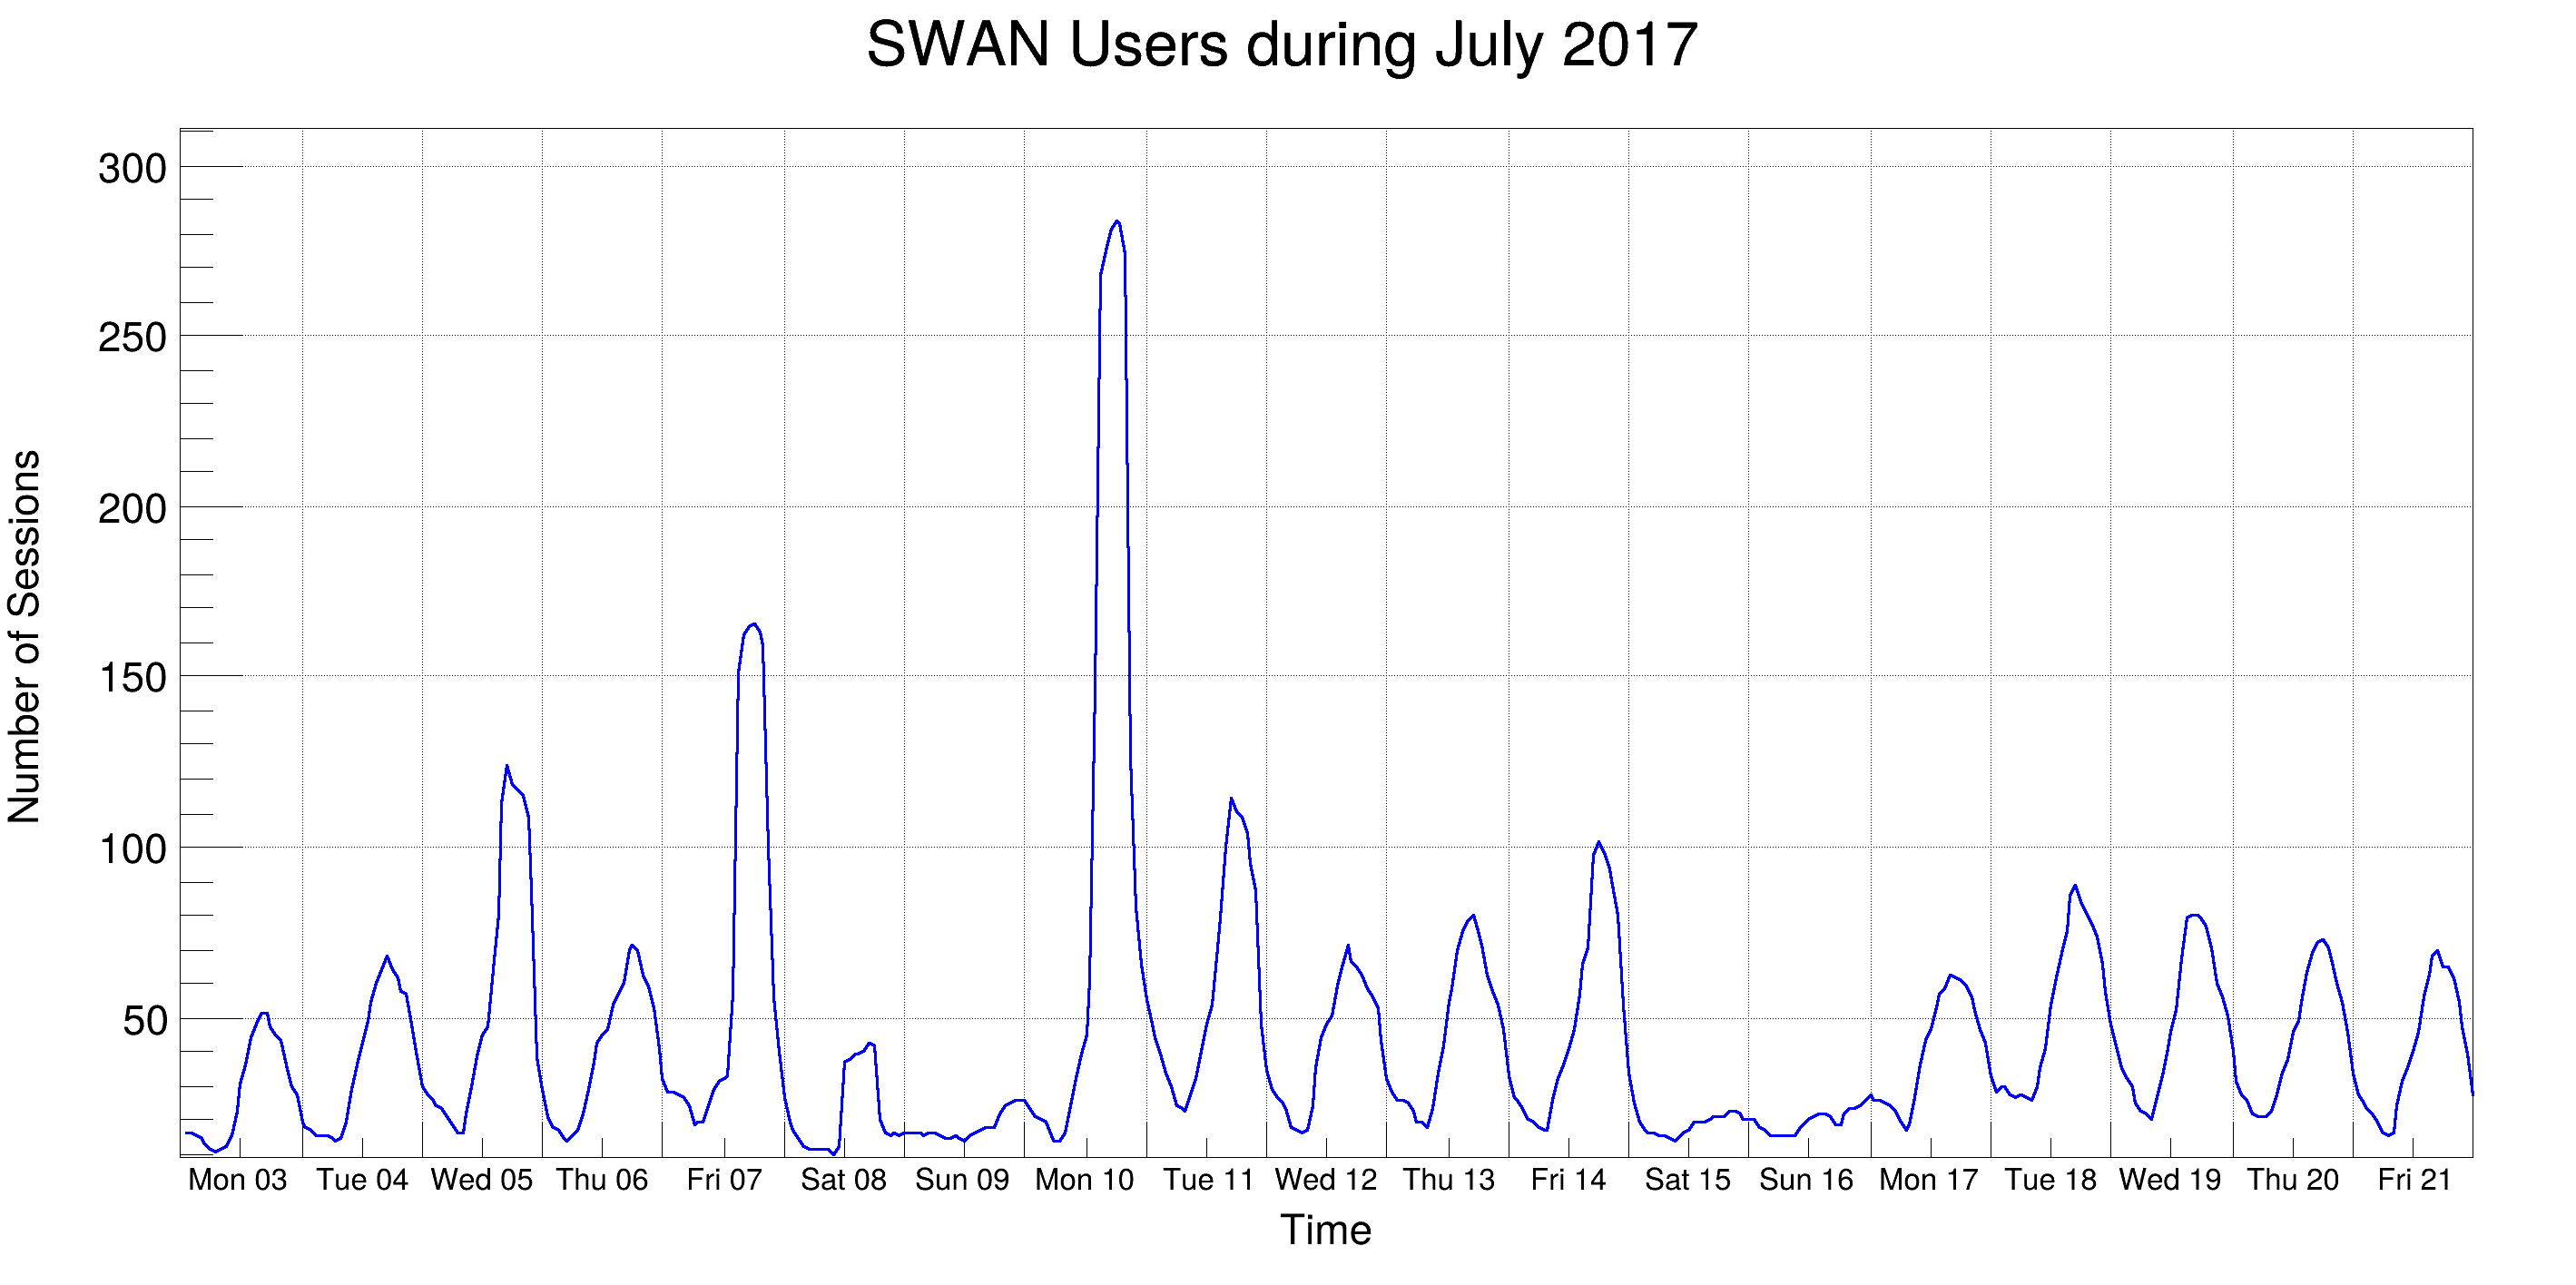
This macro illustrates the use of the time axis on a TGraph with data read from a text file containing the SWAN usage statistics during July 2017.

import ROOT
# Open the data file. This csv contains the usage statistics of a CERN IT
# service, SWAN, during two weeks. We would like to plot this data with
# ROOT to draw some conclusions from it.
dirName = str(ROOT.gROOT.GetTutorialDir())
dirName += "/graphs/"
dirName= dirName.replace("/./", "/")
inputFileName = "%s/SWAN2017.dat" %dirName
# Create the time graph
g.SetTitle("SWAN Users during July 2017;Time;Number of Sessions")
# Read the data and fill the graph with time along the X axis and number
# of users along the Y axis
lines = open(inputFileName, "r").readlines()
for i, line in enumerate(lines):
d, h, value = line.split()
g.SetPoint(i, ROOT.TDatime("%s %s" %(d,h)).Convert(), float(value))
# Draw the graph
c = ROOT.TCanvas("c", "c", 950, 500)
g.Draw("al")
g.GetYaxis().CenterTitle()
# Make the X axis labelled with time
xaxis = g.GetXaxis()
xaxis.SetLimits(ROOT.TDatime(2017, 7, 3, 0, 0, 0).Convert(), ROOT.TDatime(2017, 7, 22, 0, 0, 0).Convert())
ROOT::Detail::TRangeCast< T, true > TRangeDynCast
TRangeDynCast is an adapter class that allows the typed iteration through a TCollection.
Authors
Danilo Piparo, Olivier Couet

Definition in file timeSeriesFromCSV.py.