 |
ROOT
Reference Guide |

|
| |
ROOT
Reference Guide |
|
Files | |
| accessiblecolorschemes.C | |
 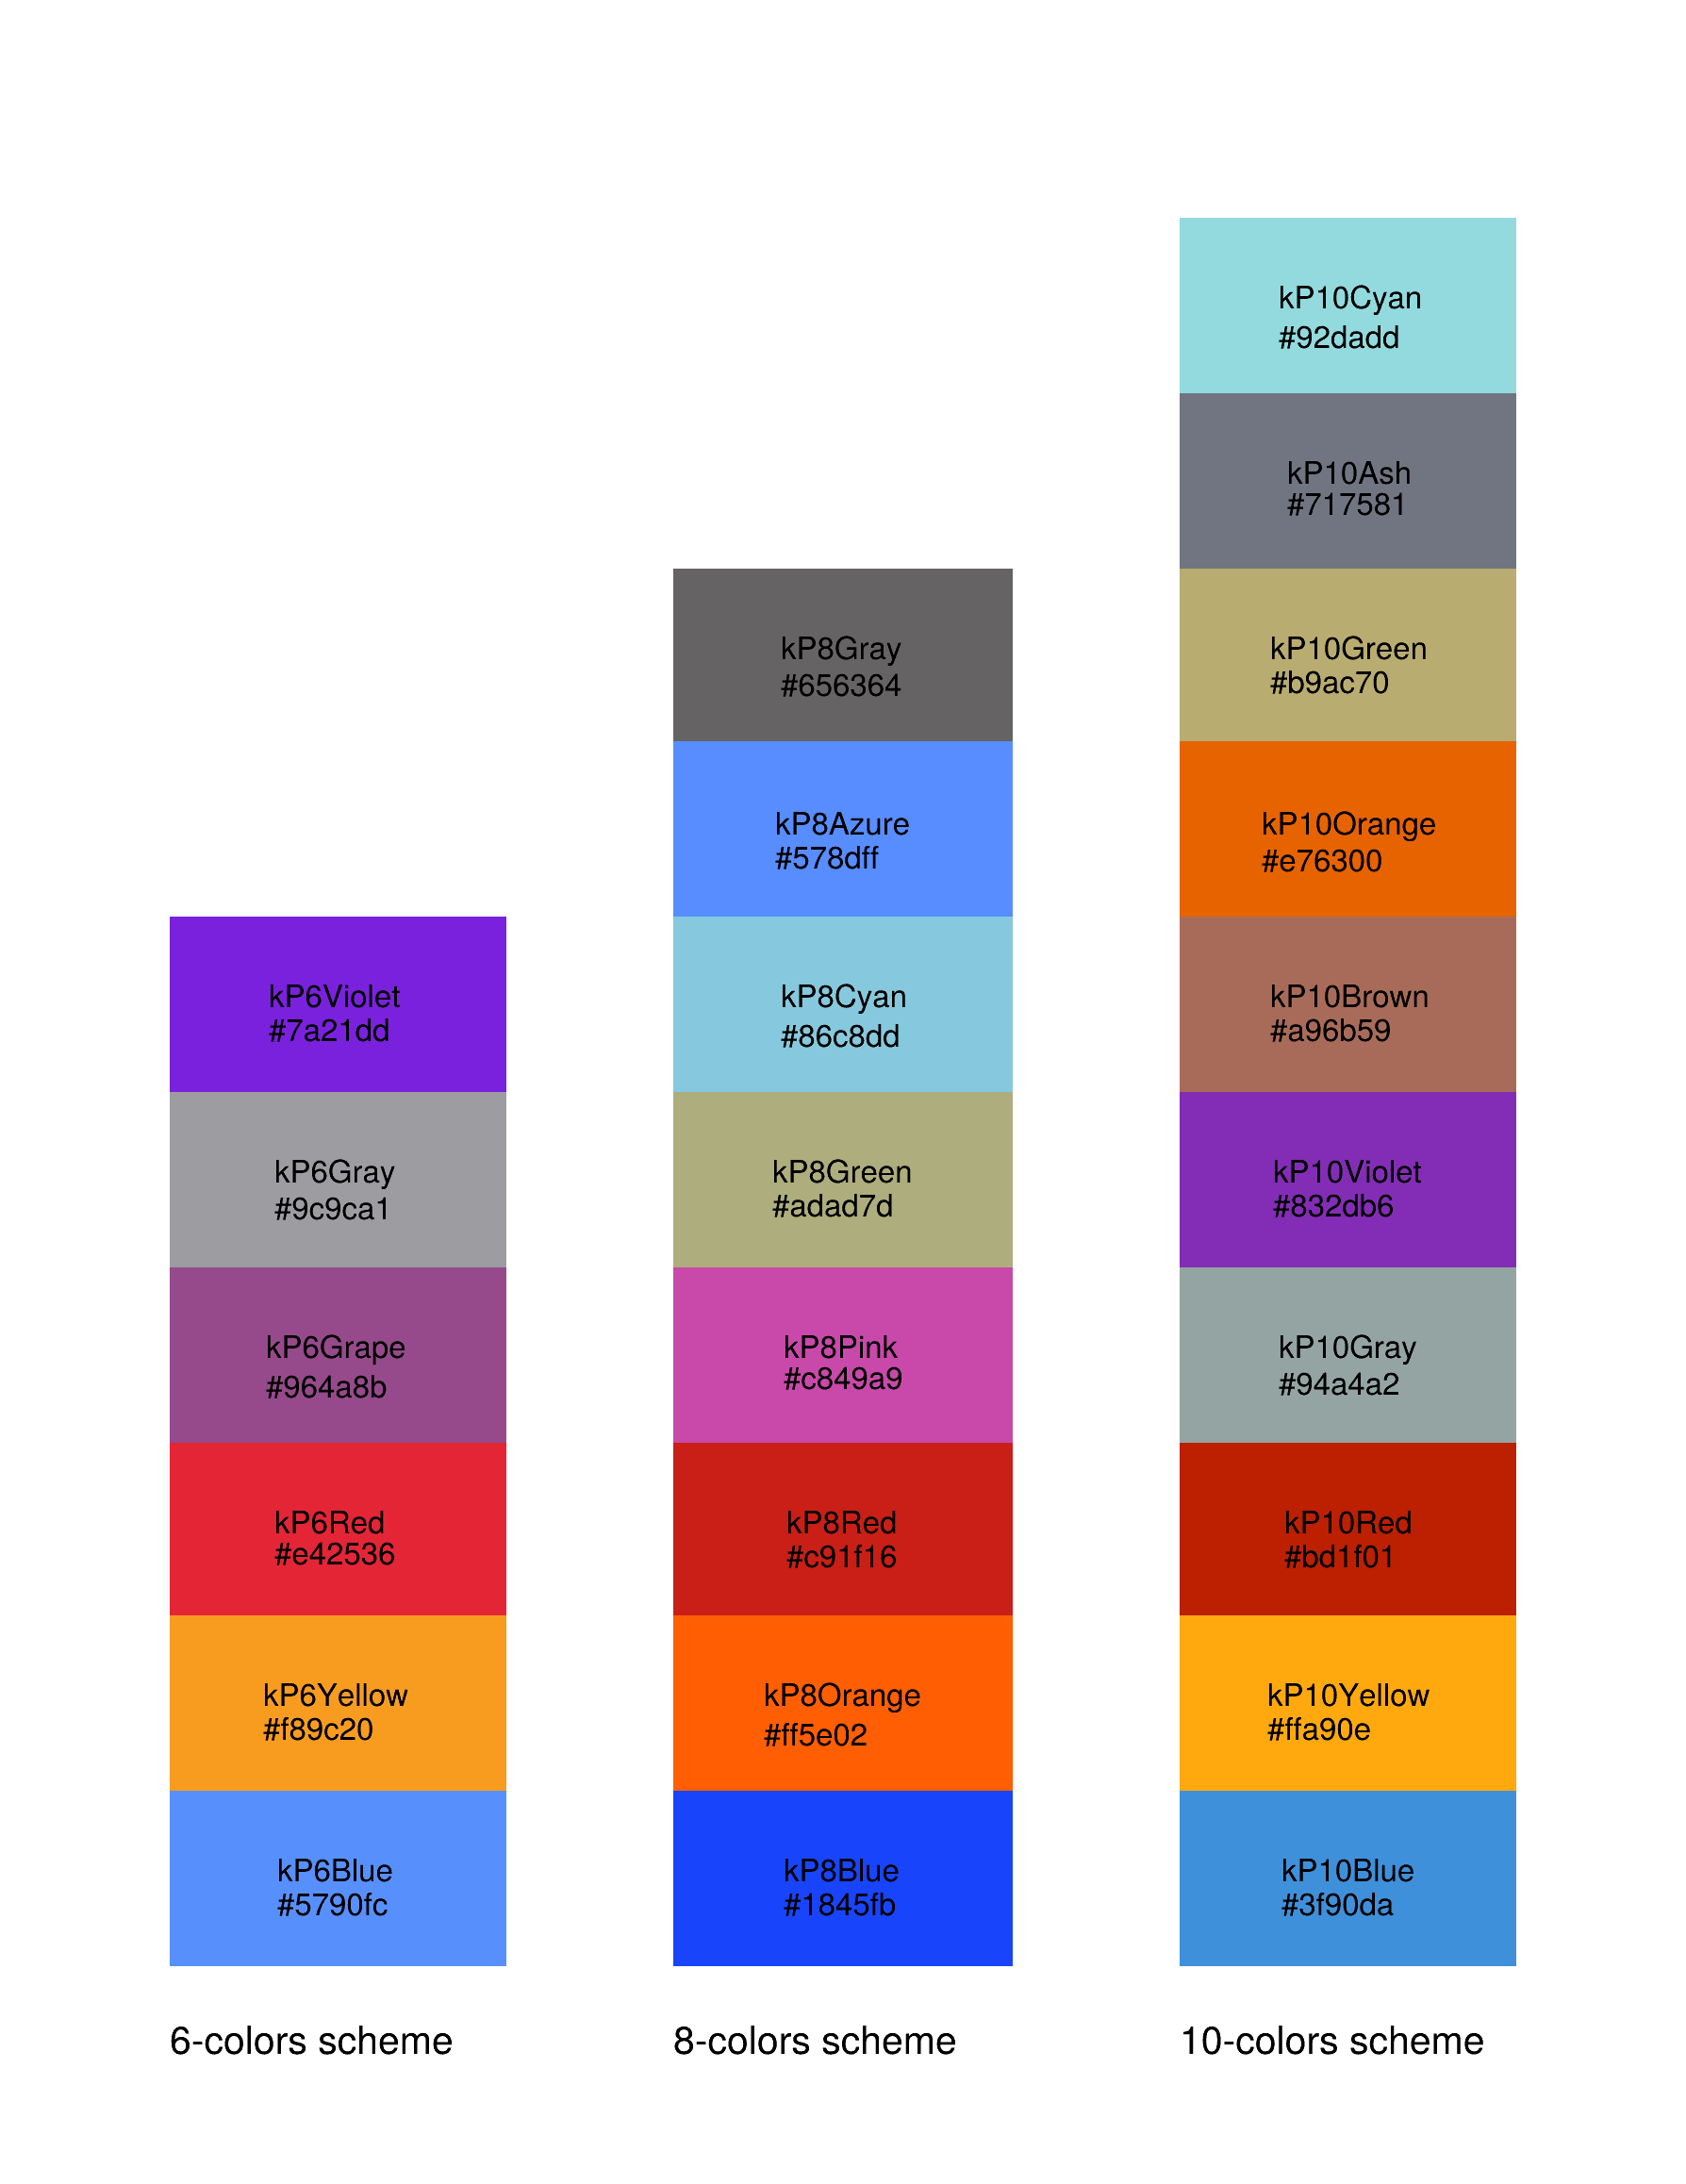 Choosing an appropriate color scheme is essential for making results easy to understand and interpret. Choosing an appropriate color scheme is essential for making results easy to understand and interpret. | |
| analyze.C | |
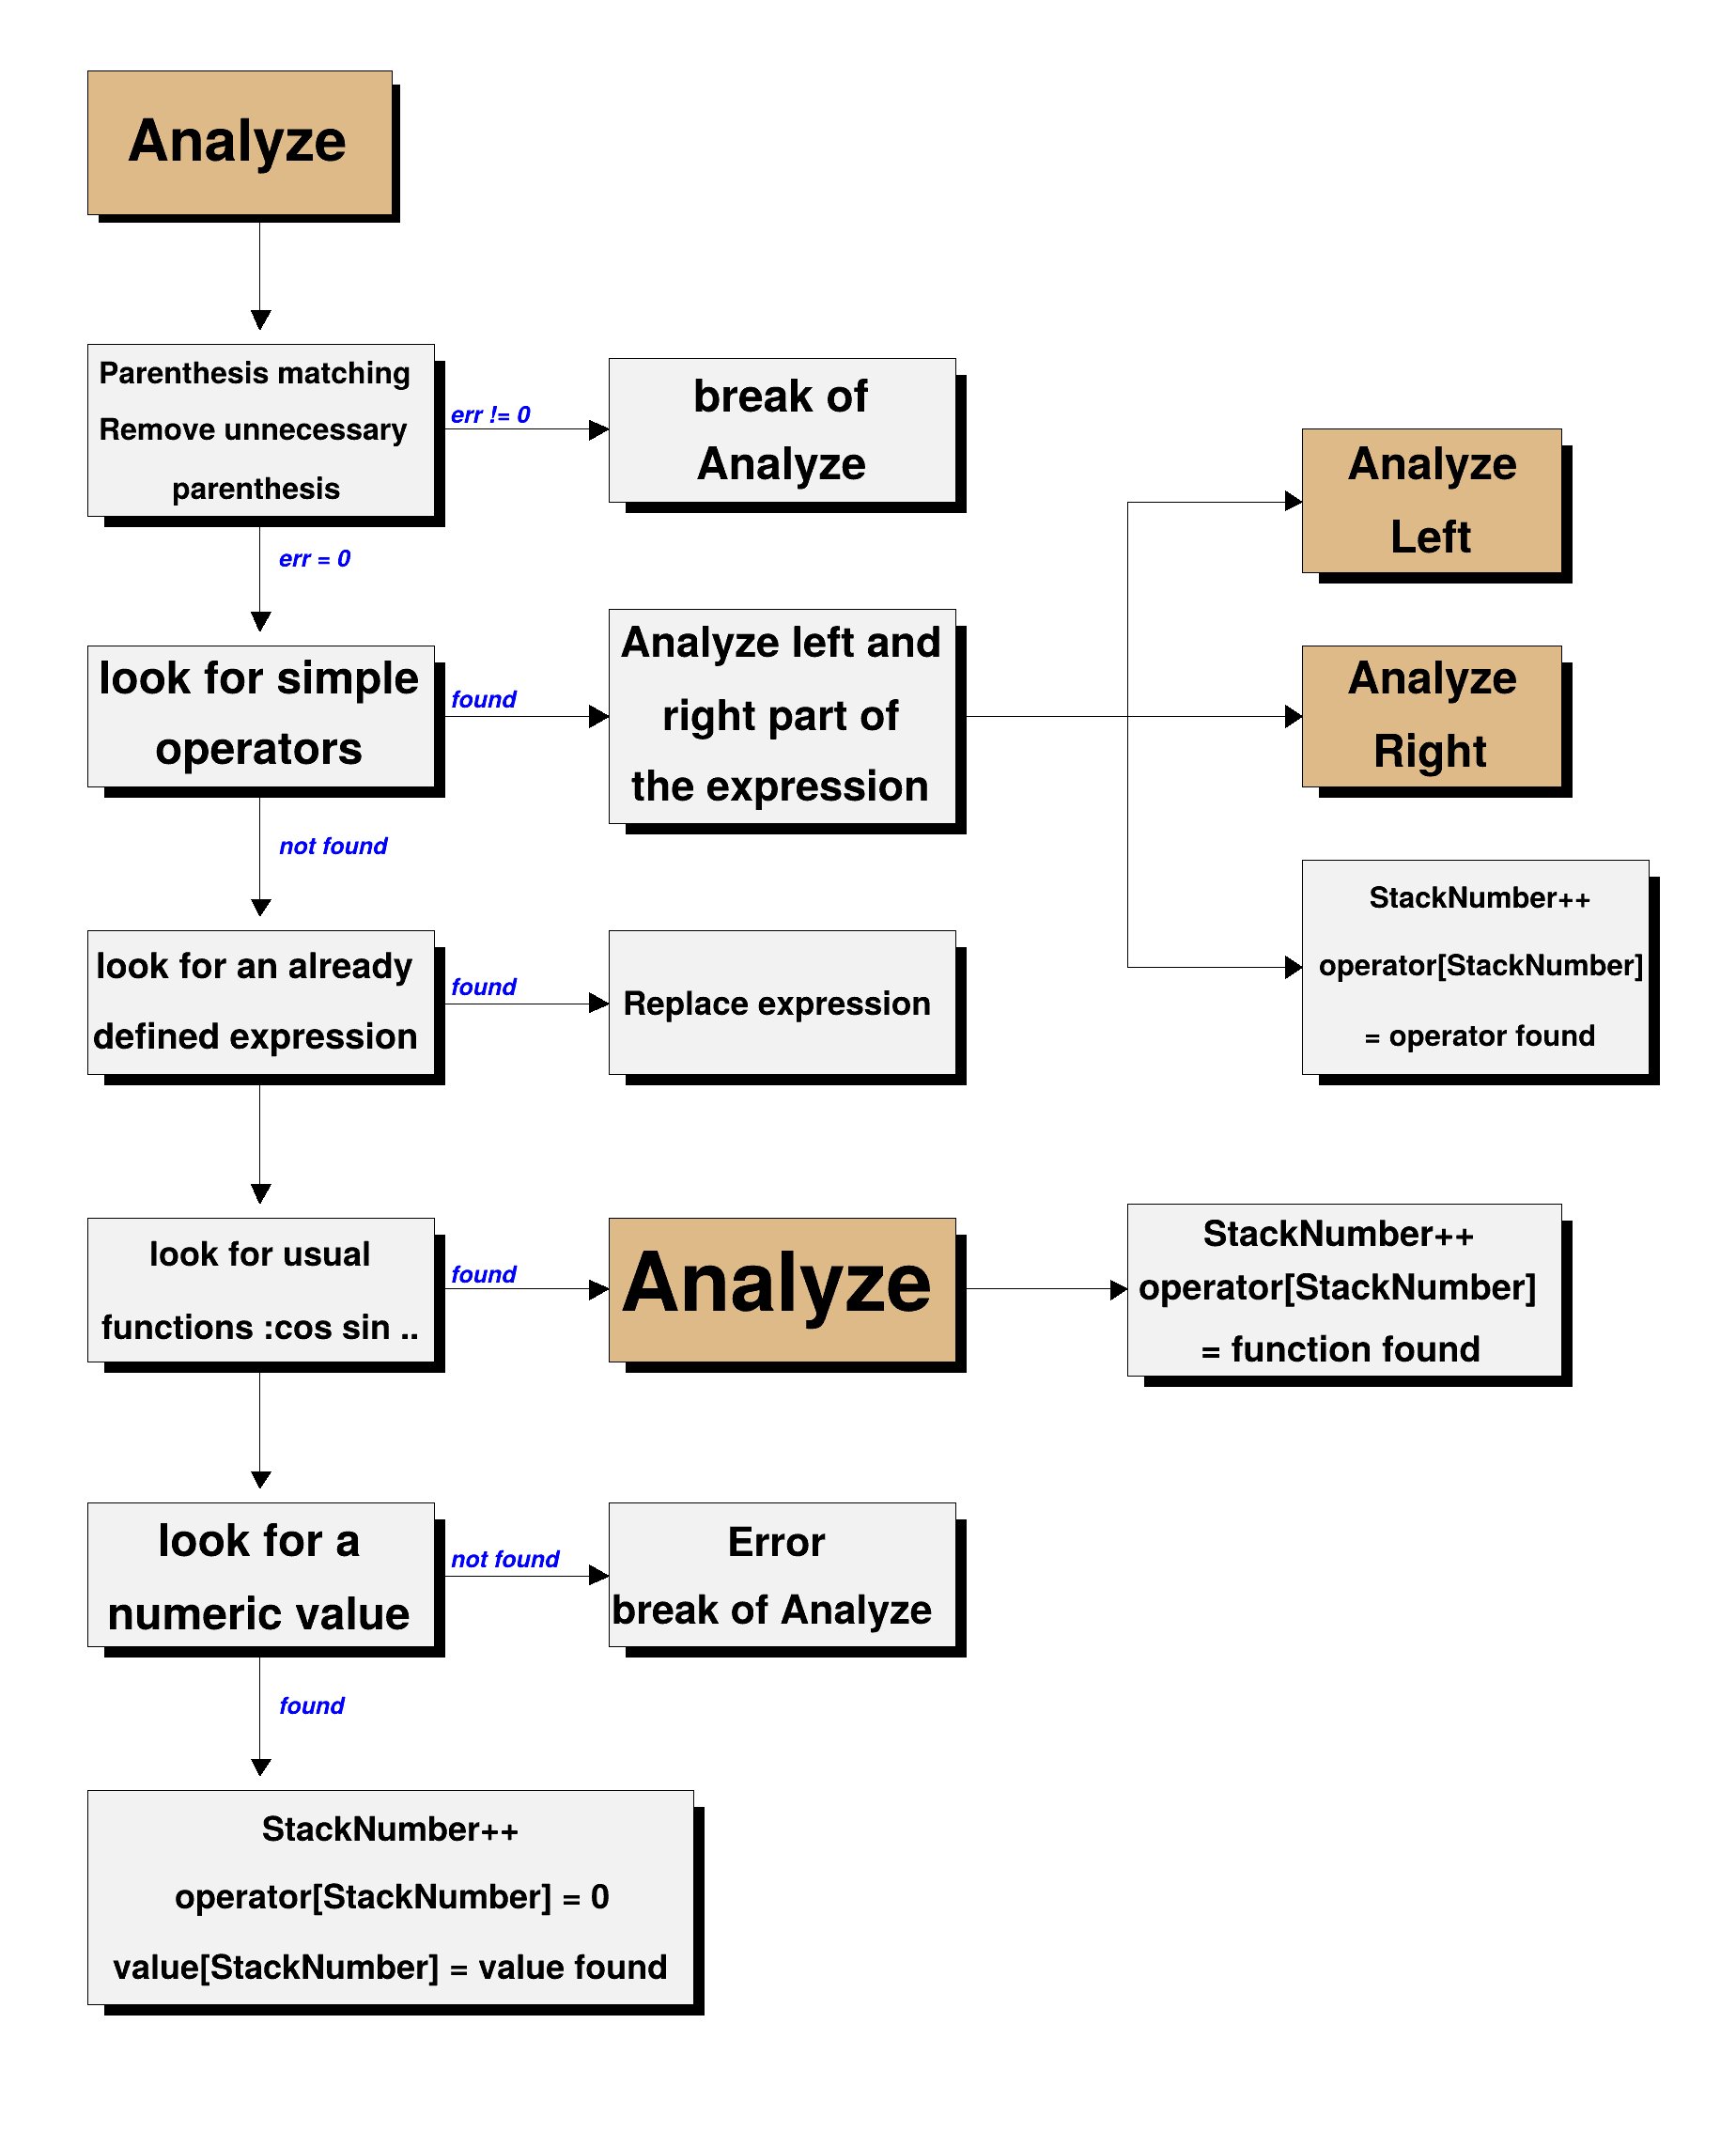 This macro produces the flowchart of TFormula::Analyze. This macro produces the flowchart of TFormula::Analyze. | |
| anim.C | |
| Macro illustrating how to animate a picture using a Timer. | |
| annotation3d.C | |
 This example show how to put some annotation on a 3D plot using 3D polylines. This example show how to put some annotation on a 3D plot using 3D polylines. | |
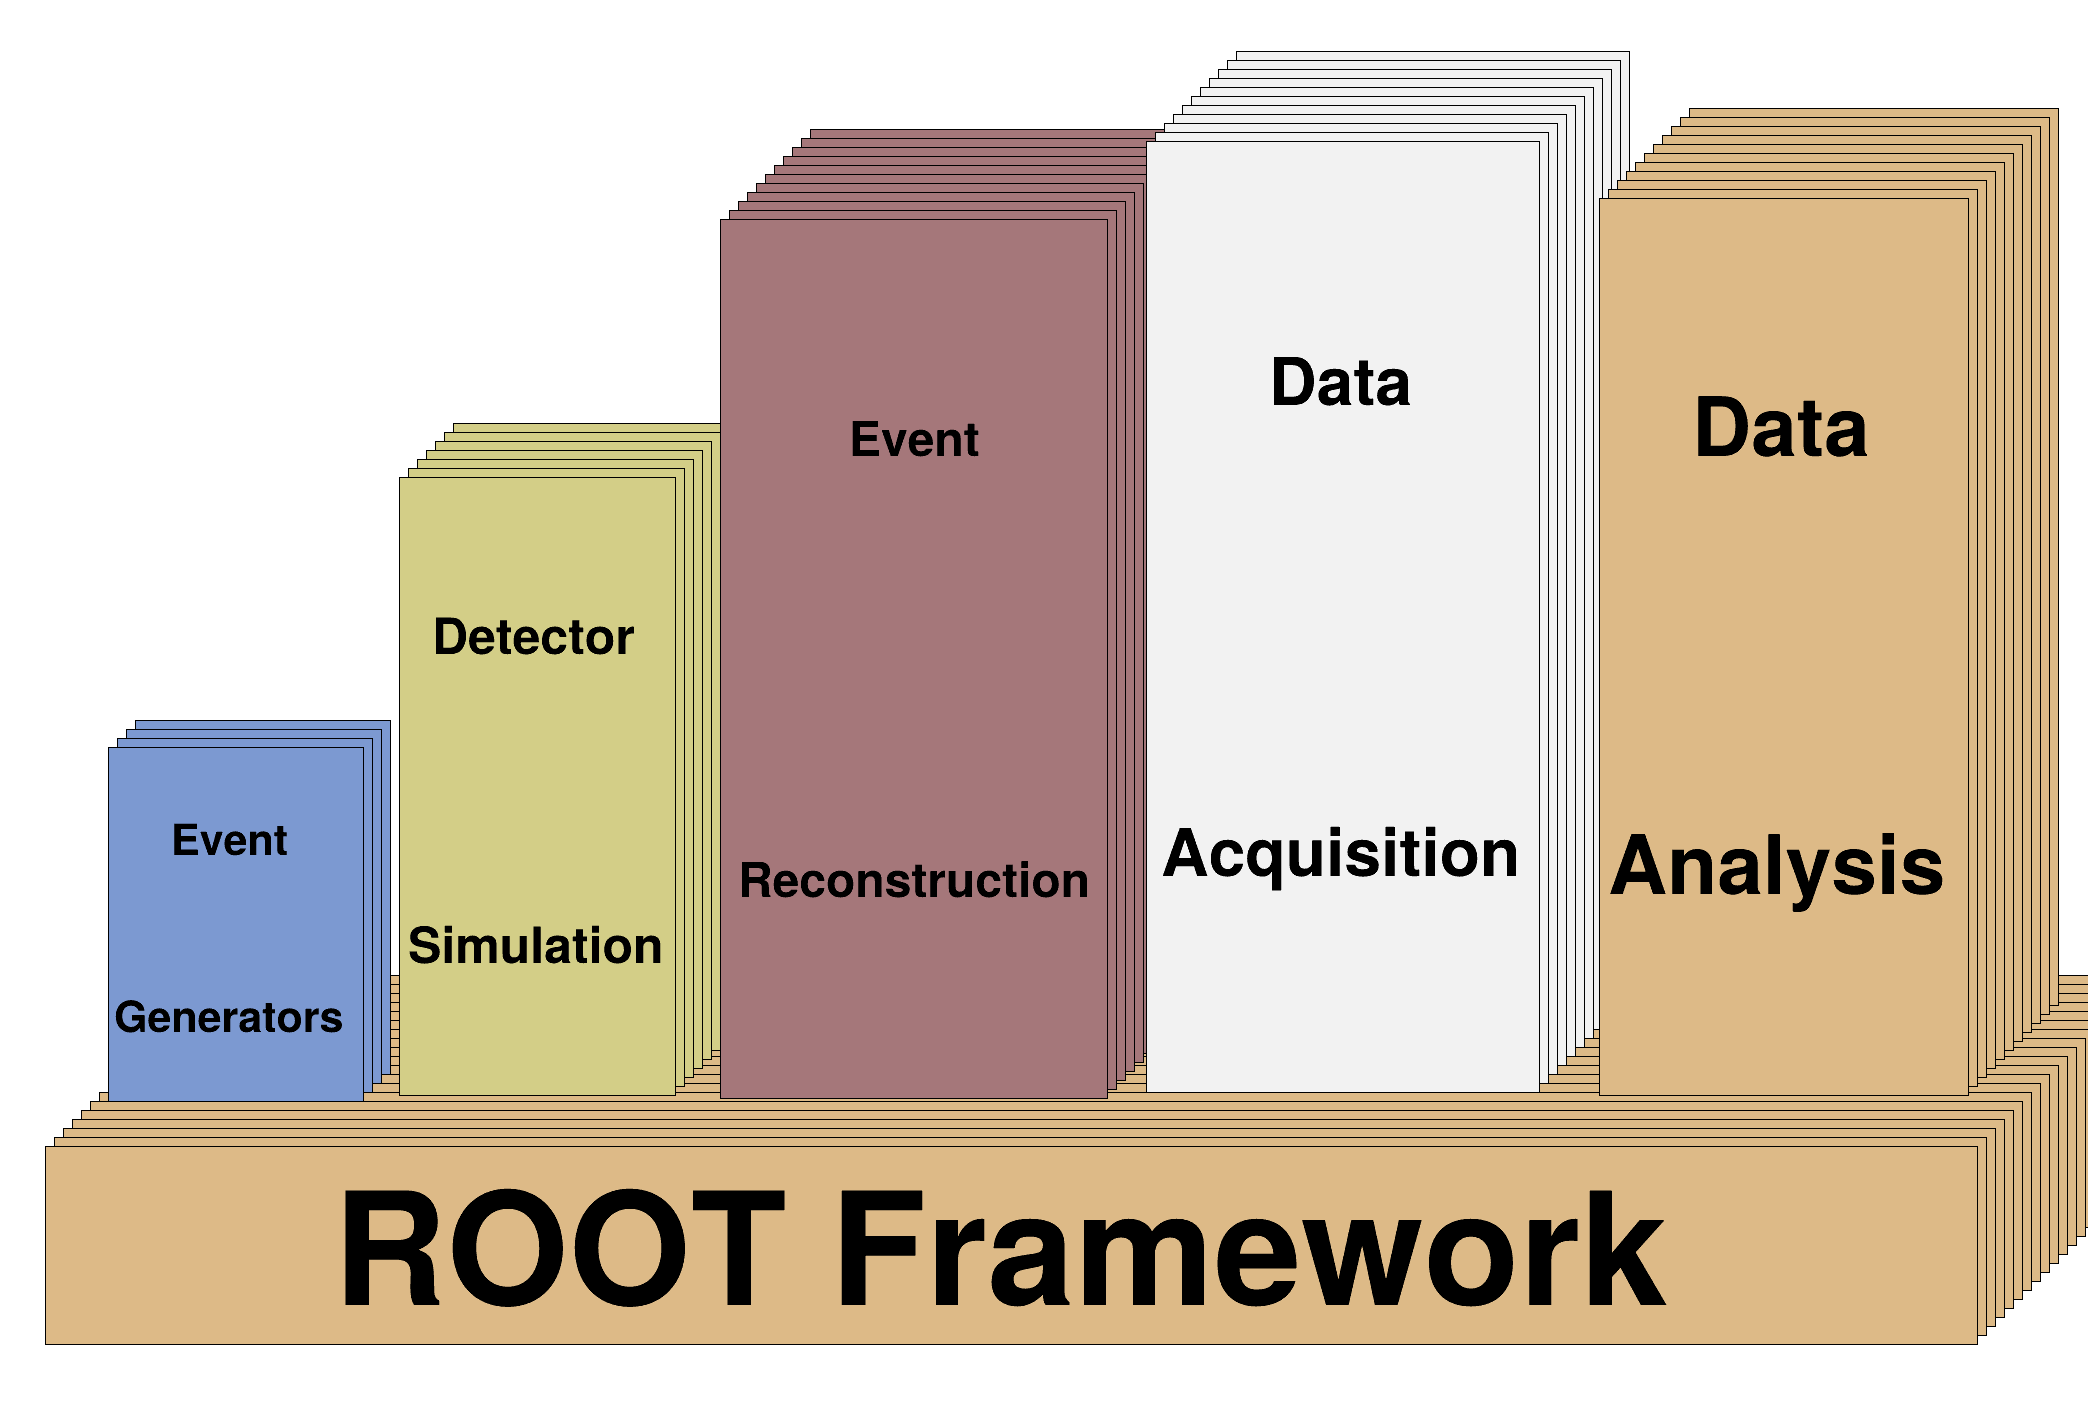
| archi.C | |
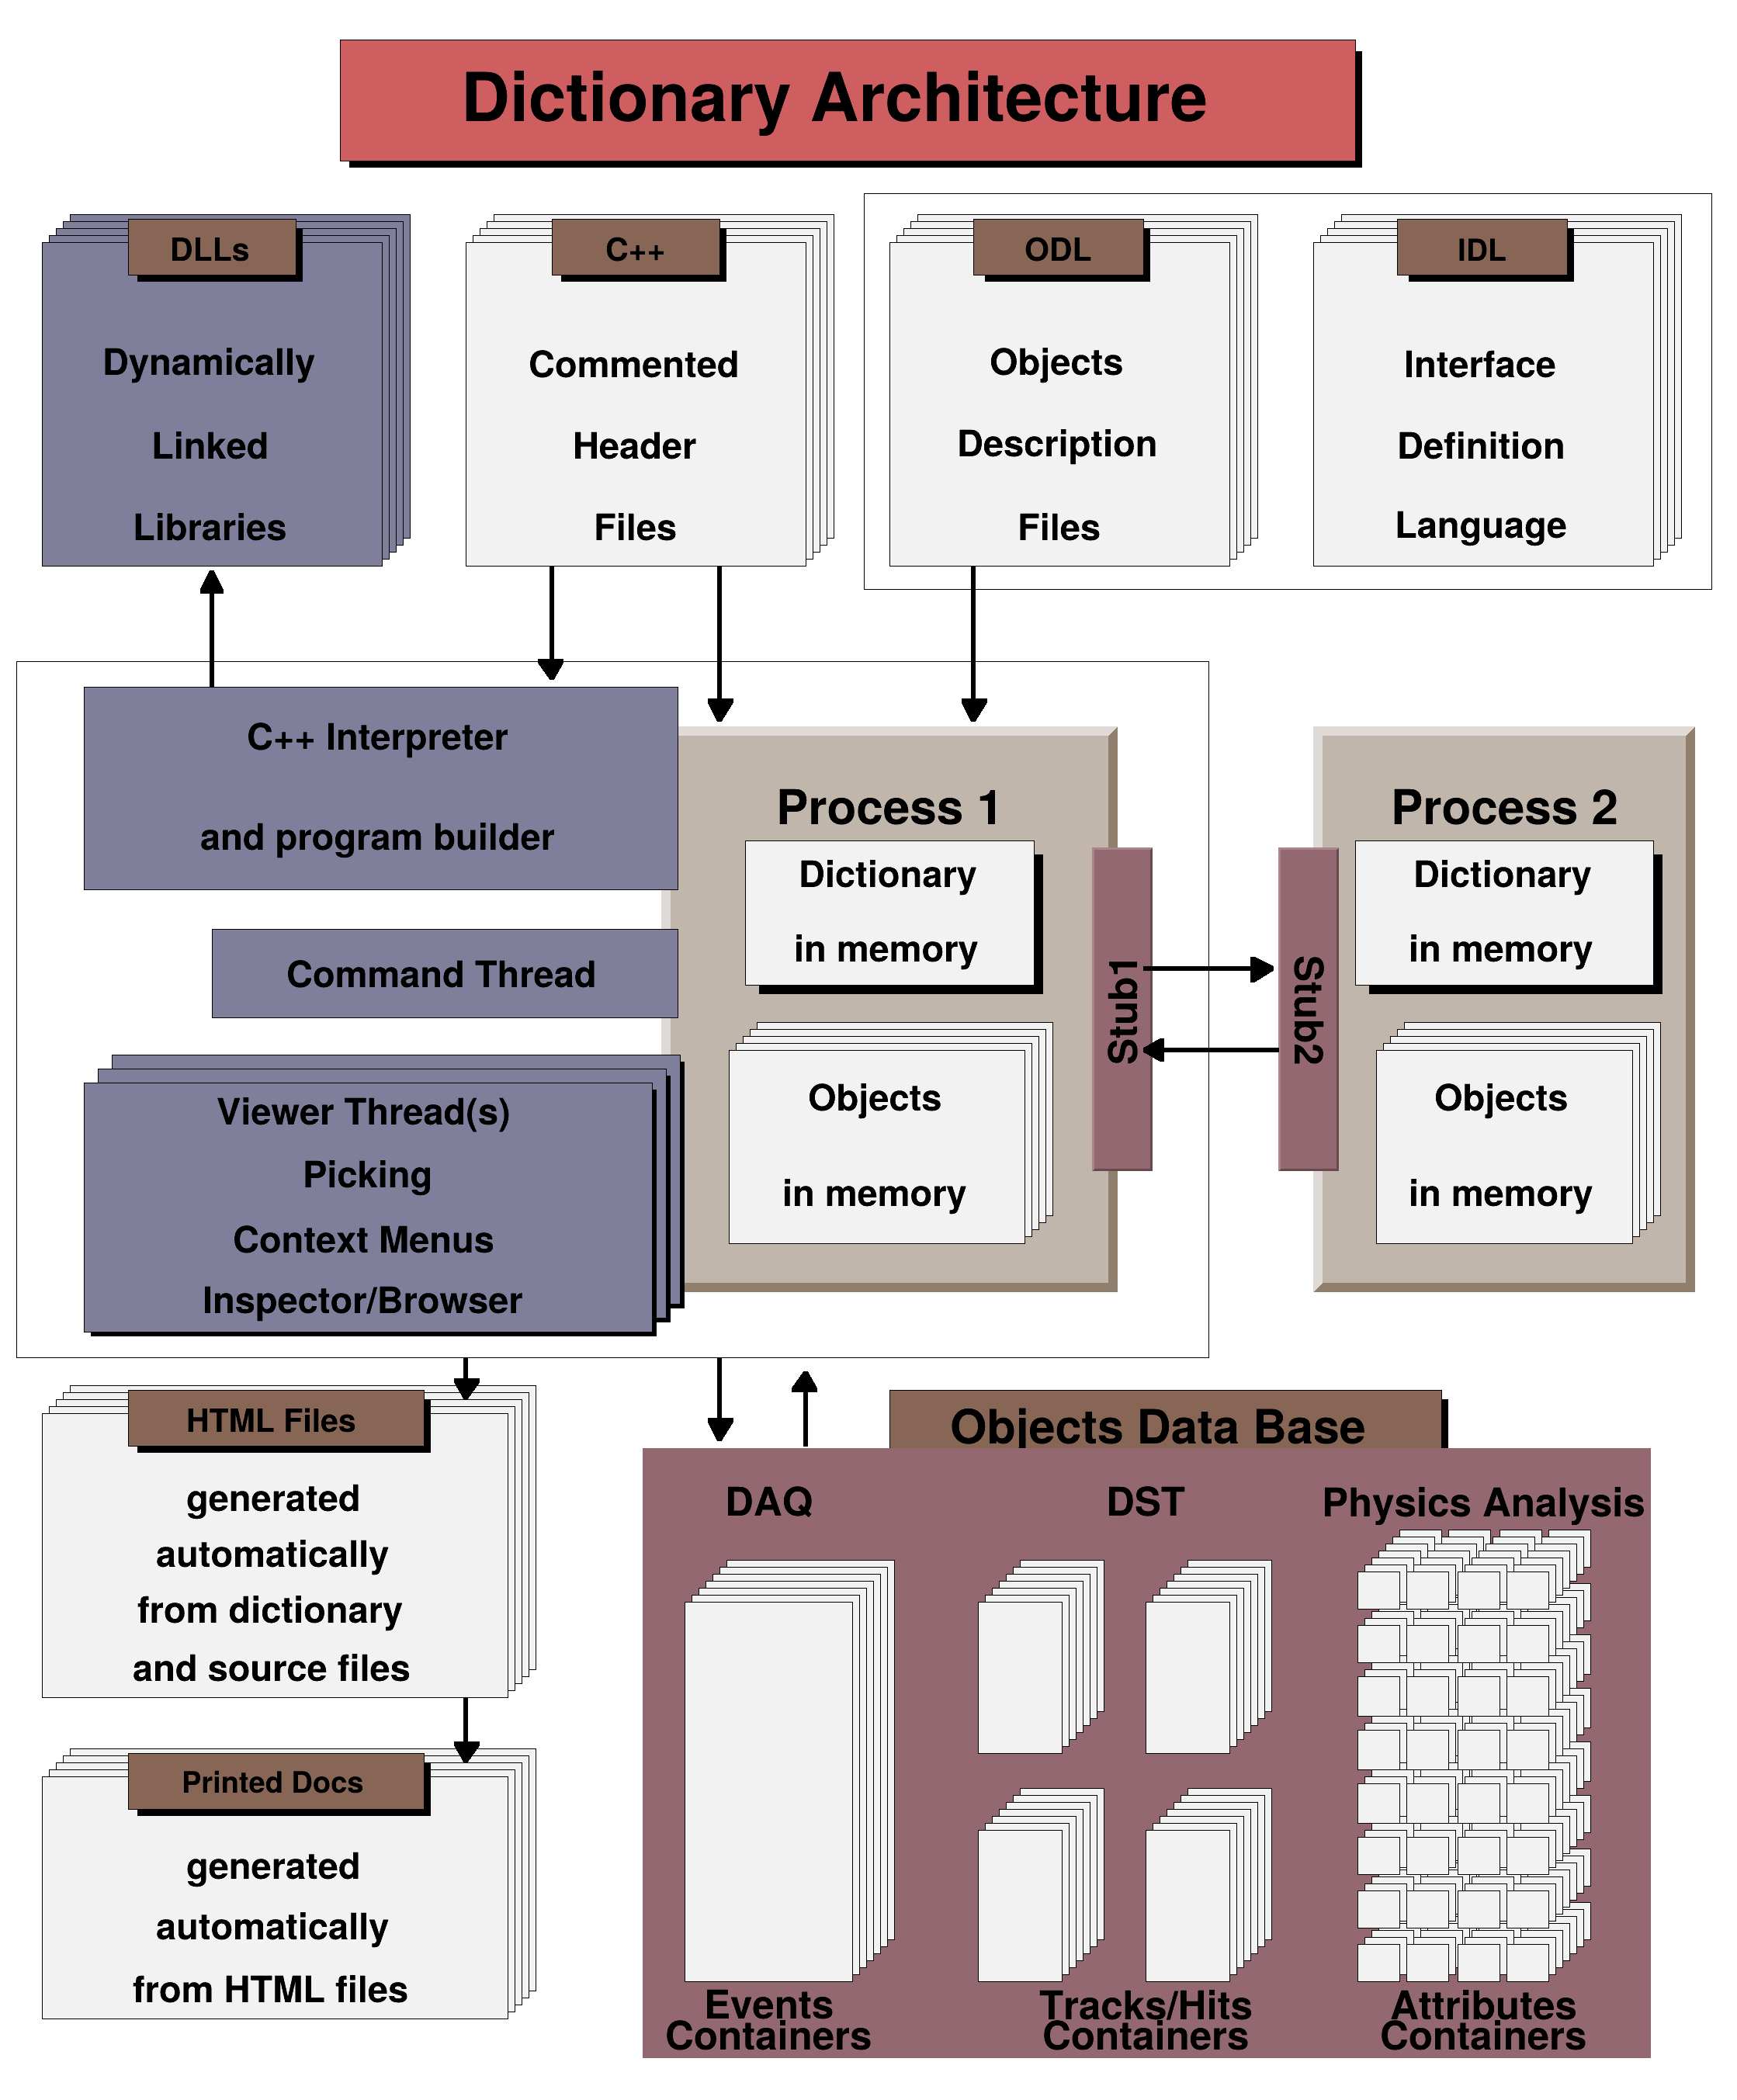 This macro displays the ROOT architecture. This macro displays the ROOT architecture. | |
| arrows.C | |
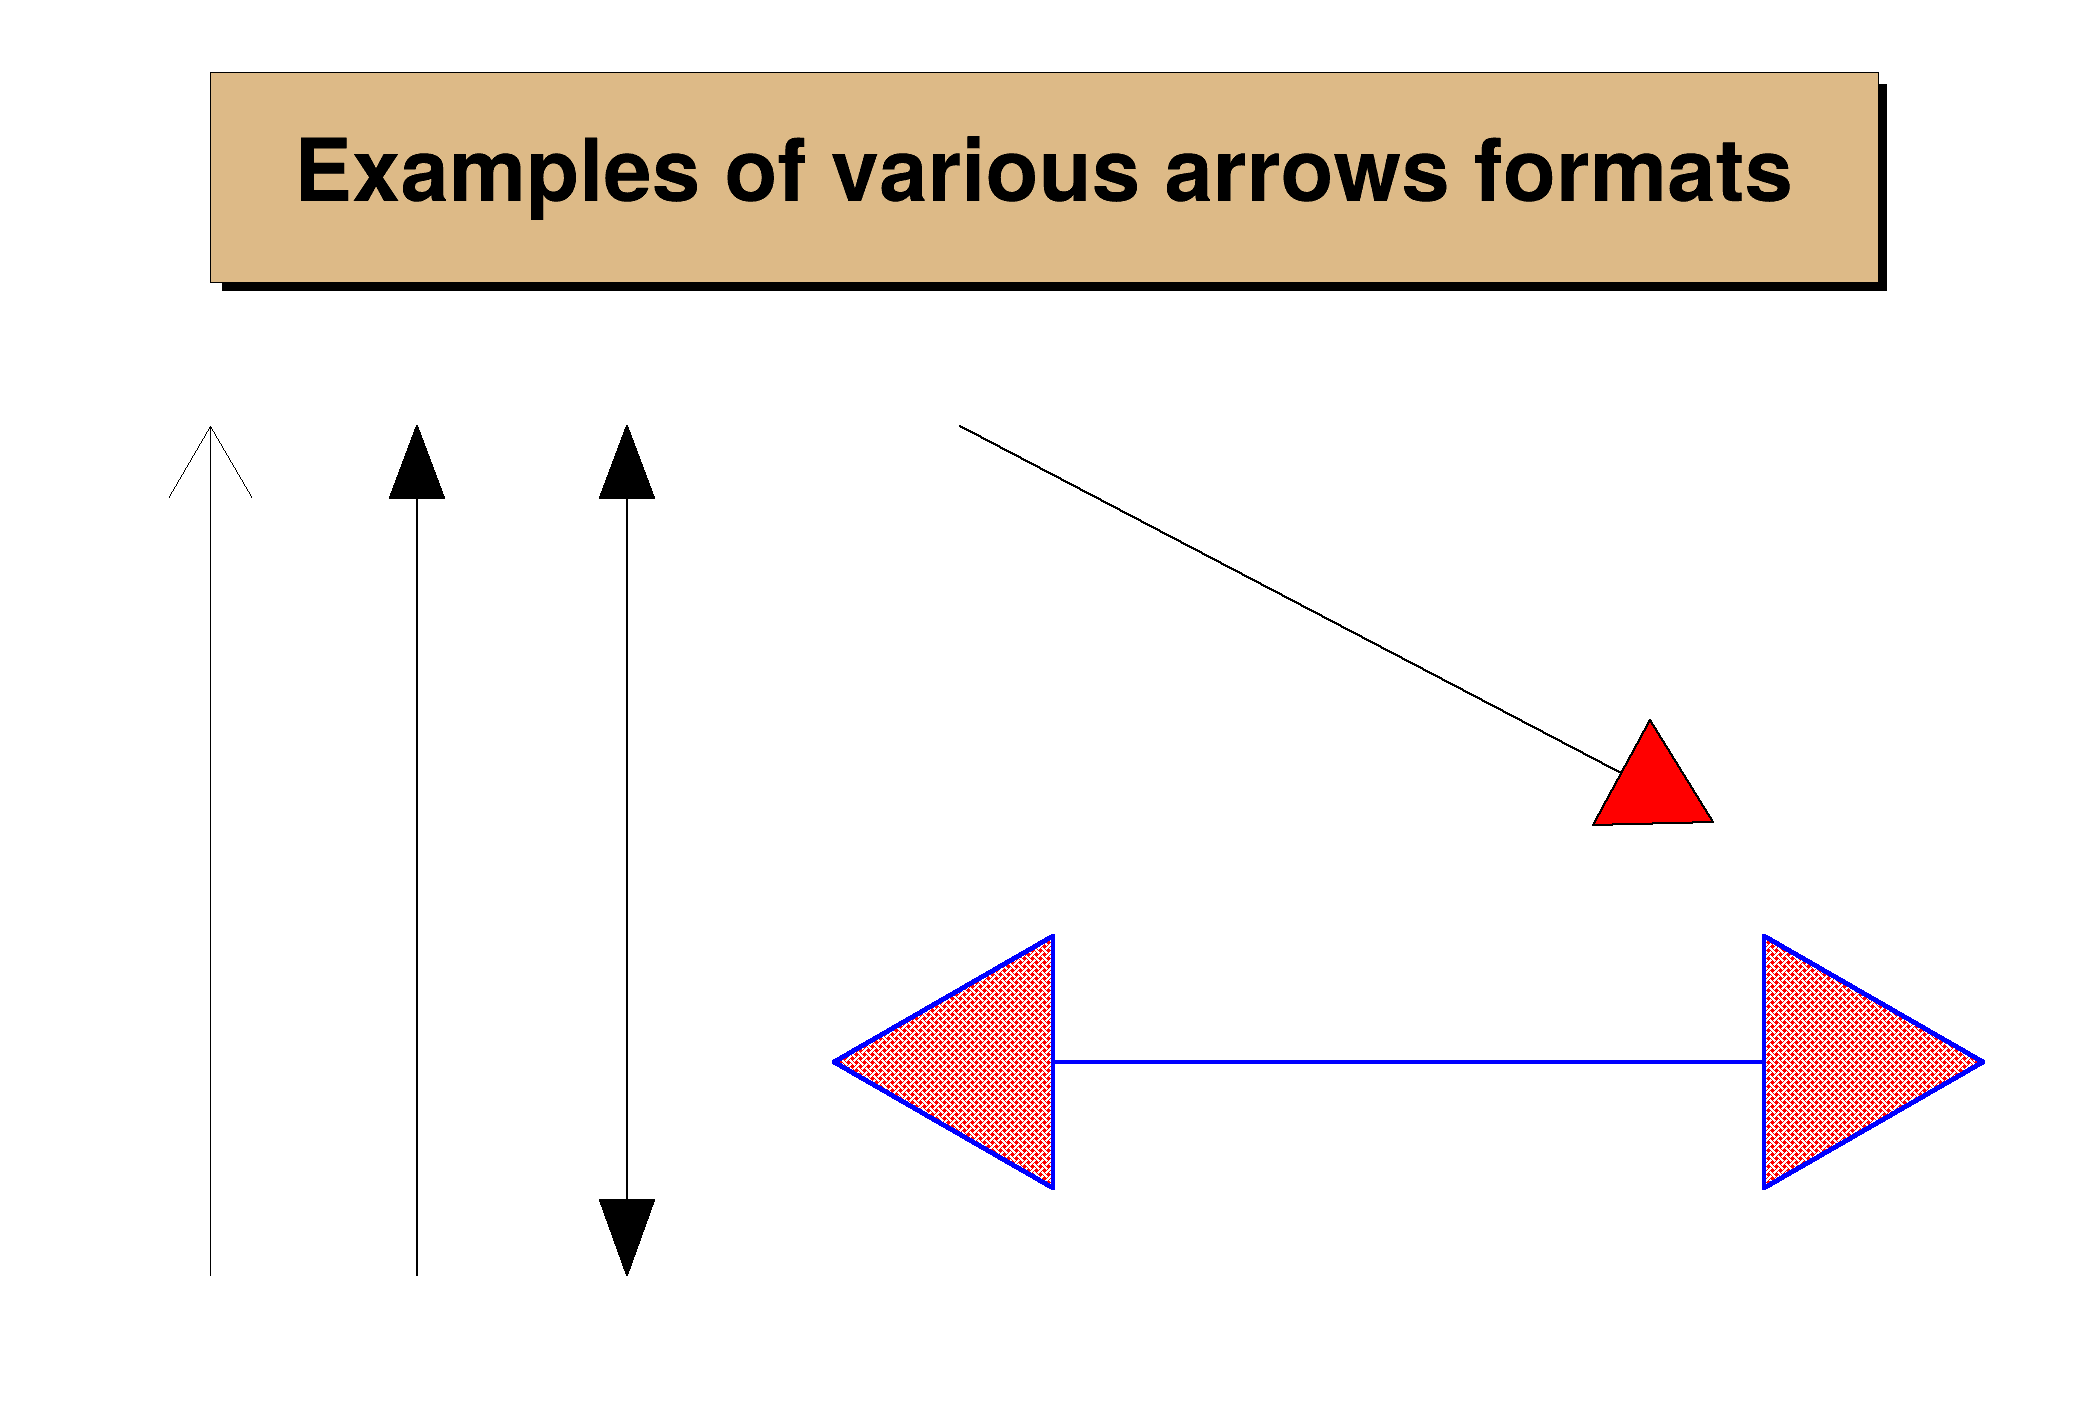 Draw arrows. Draw arrows. | |
| basic3d.C | |
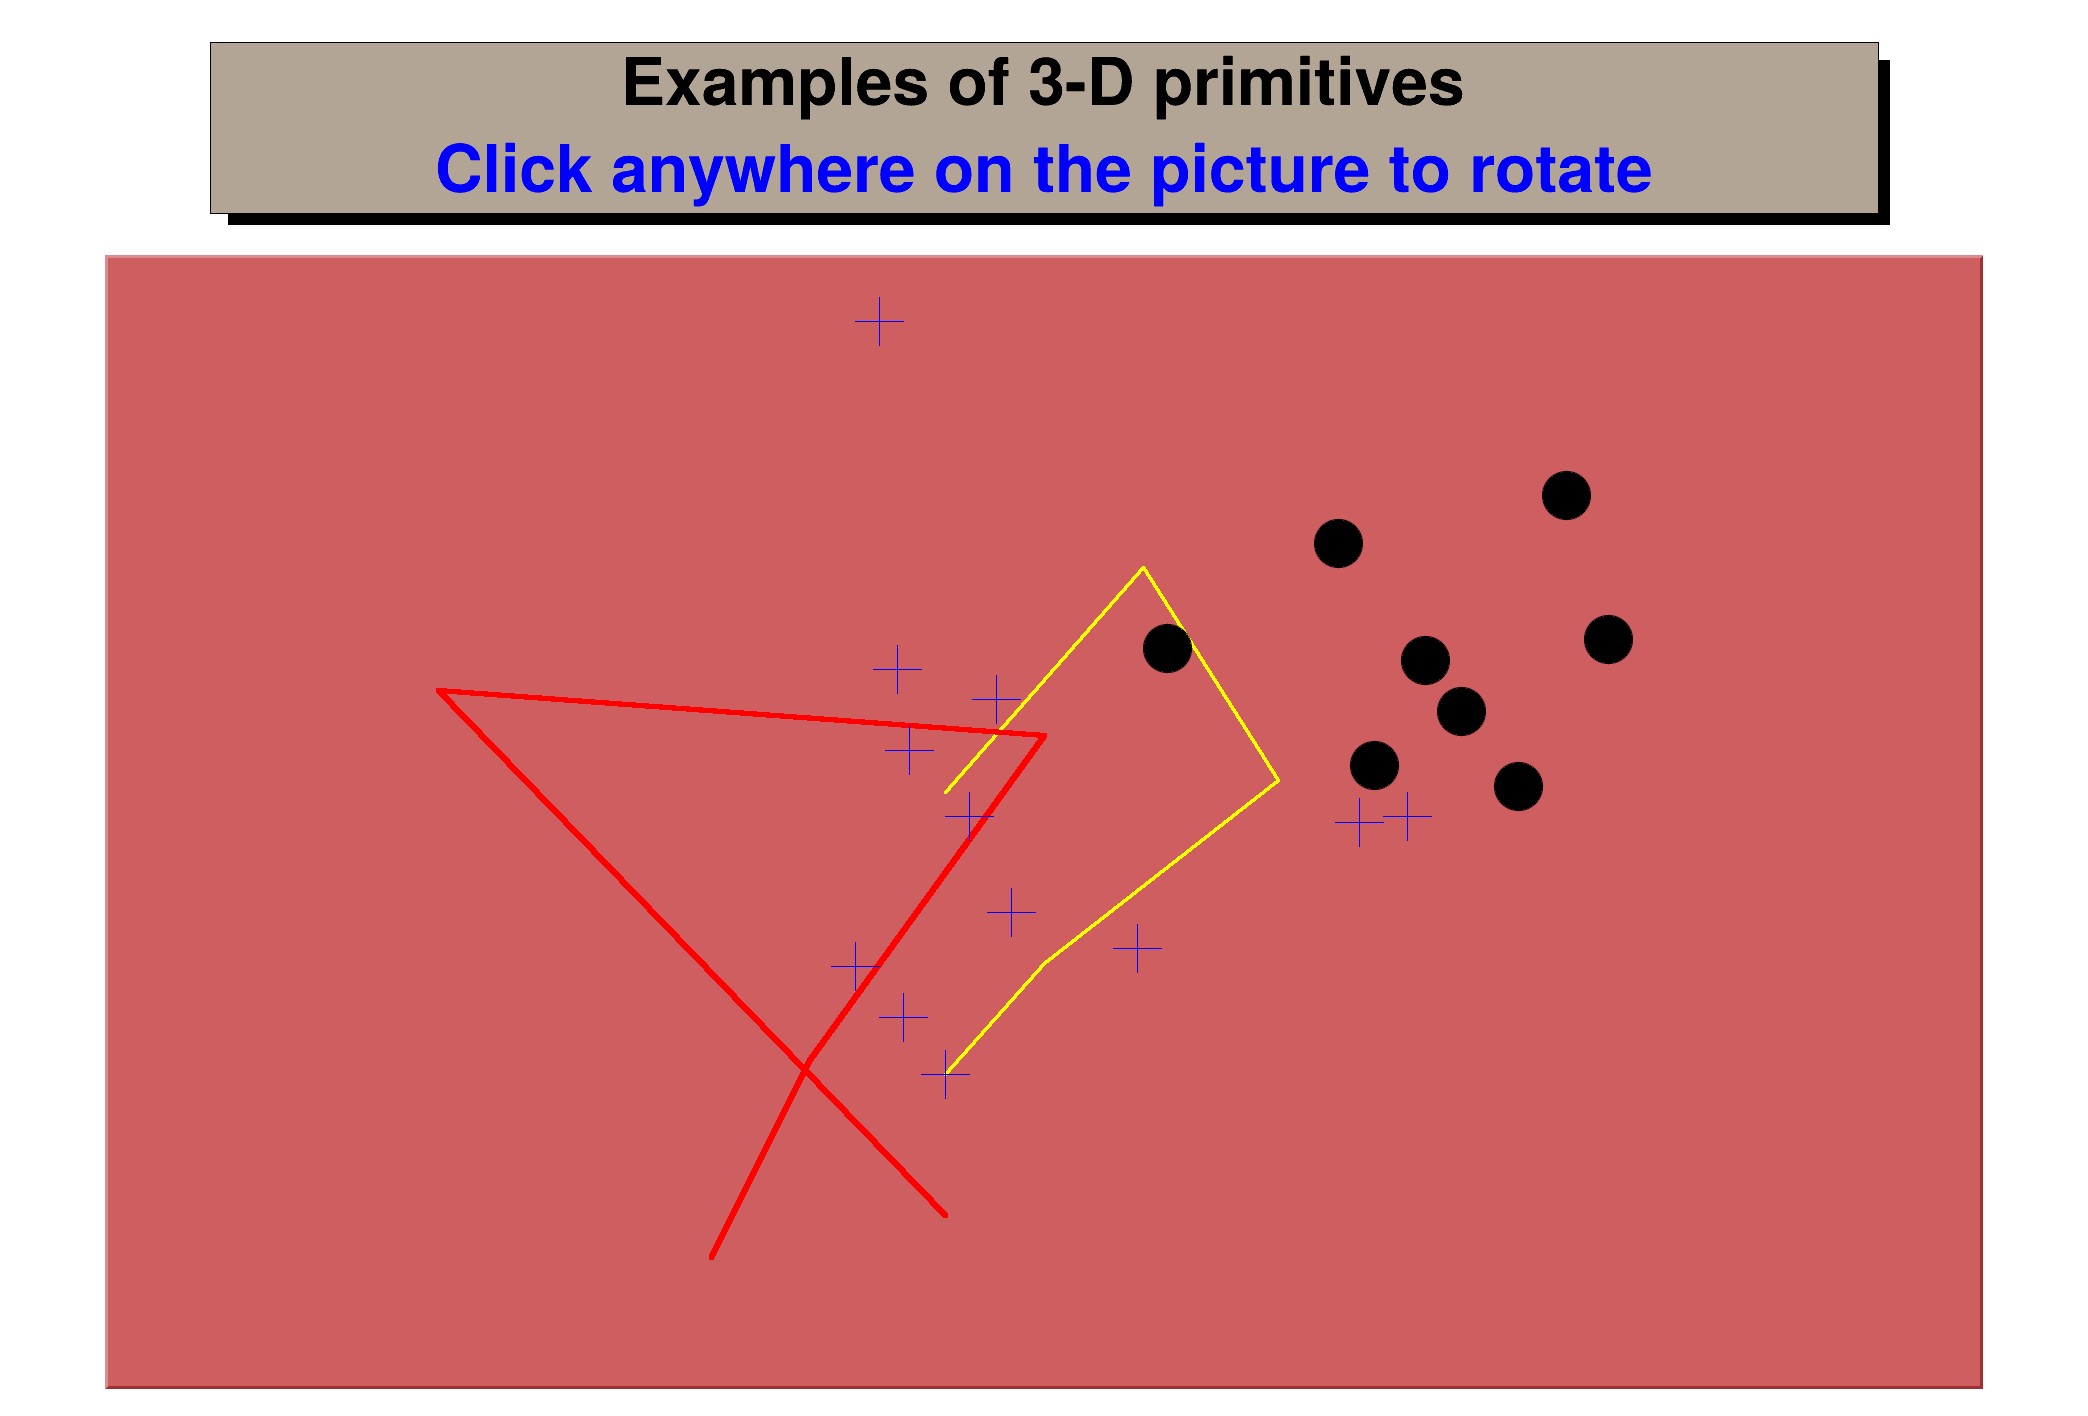 Show 3-D polylines and markers. Show 3-D polylines and markers. | |
| canvas.C | |
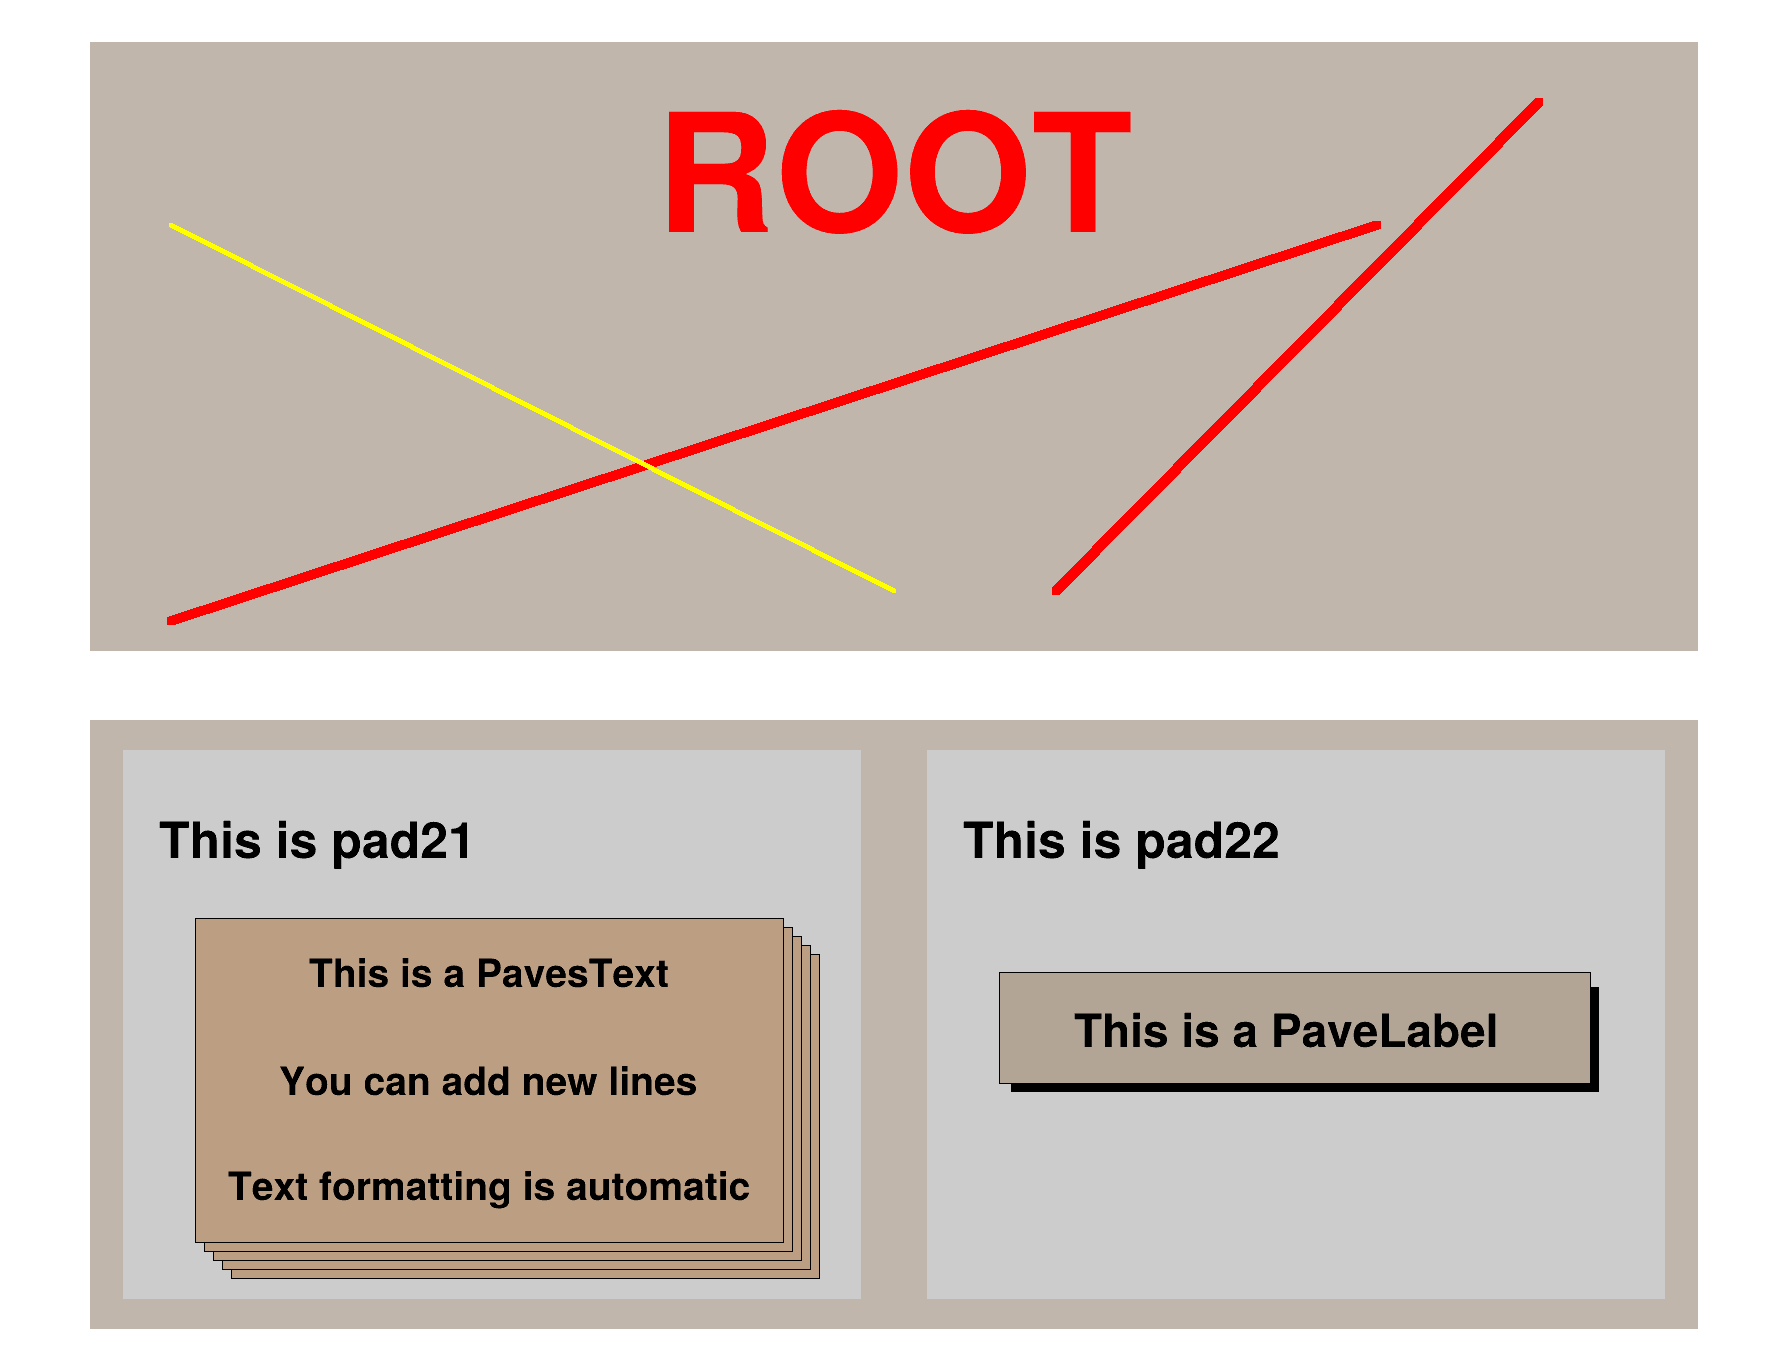 Example of primitives in a canvas. Example of primitives in a canvas. | |
| canvas2.C | |
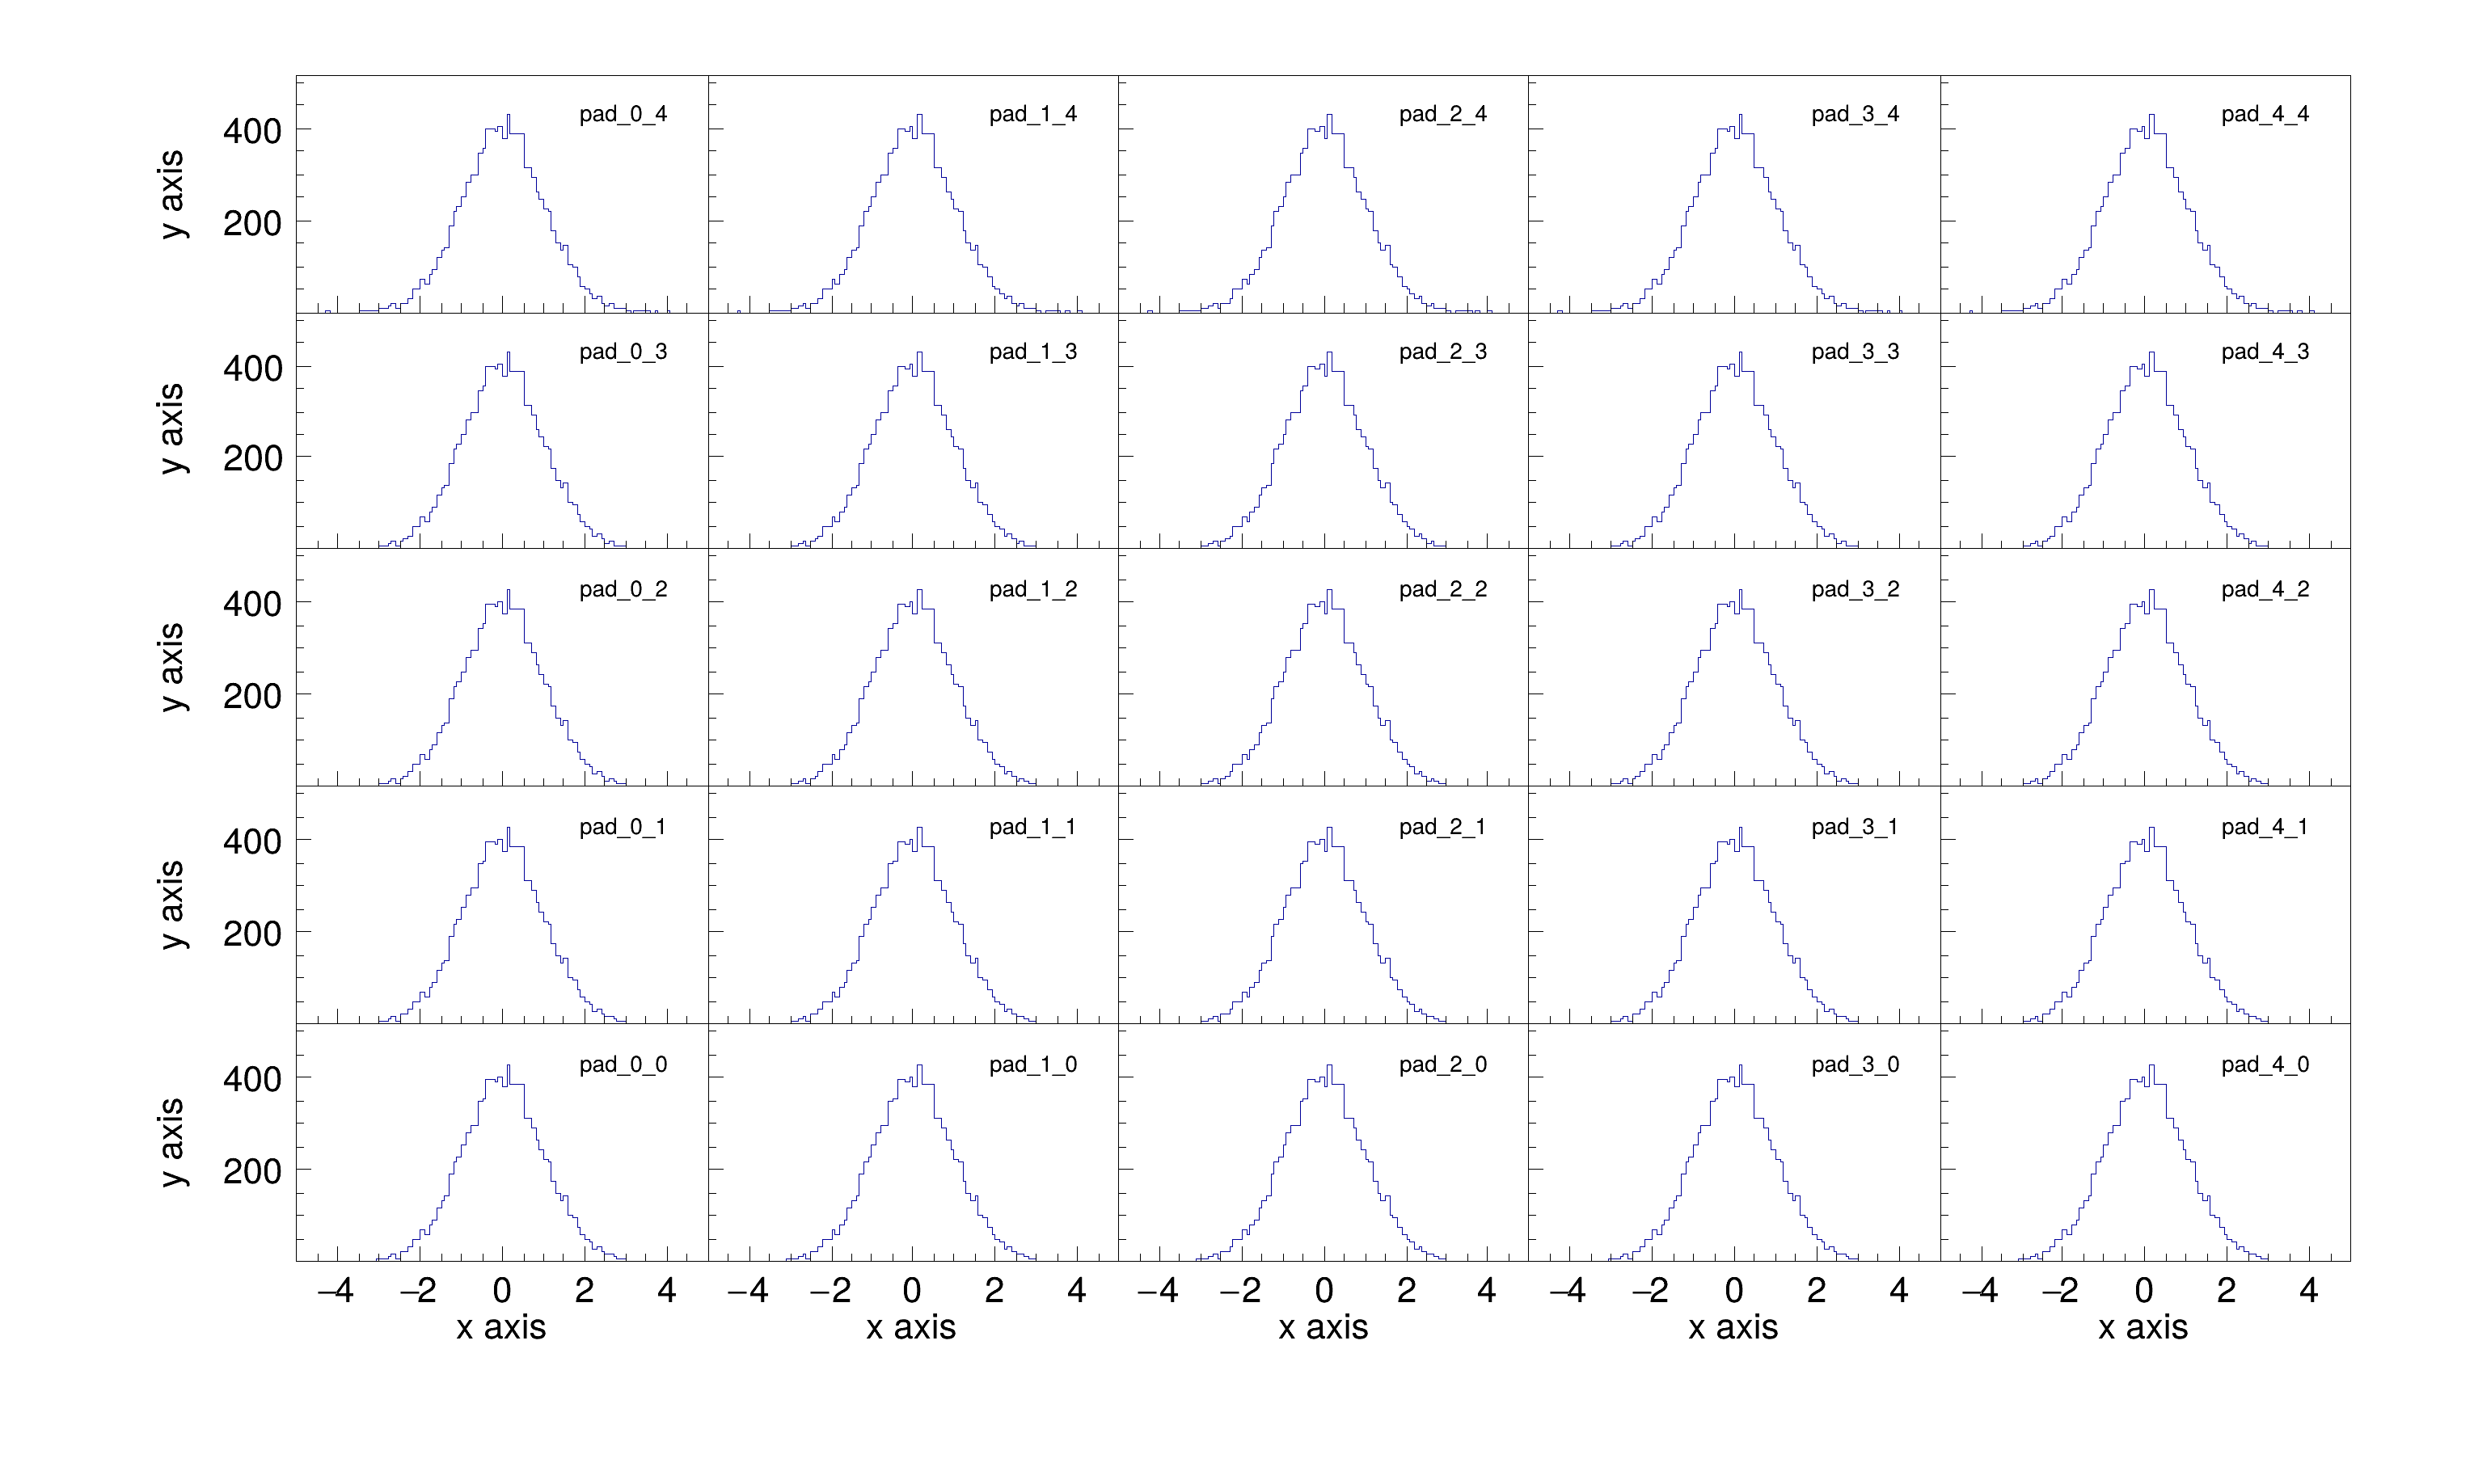 Example of canvas partitioning. Example of canvas partitioning. | |
| compile.C | |
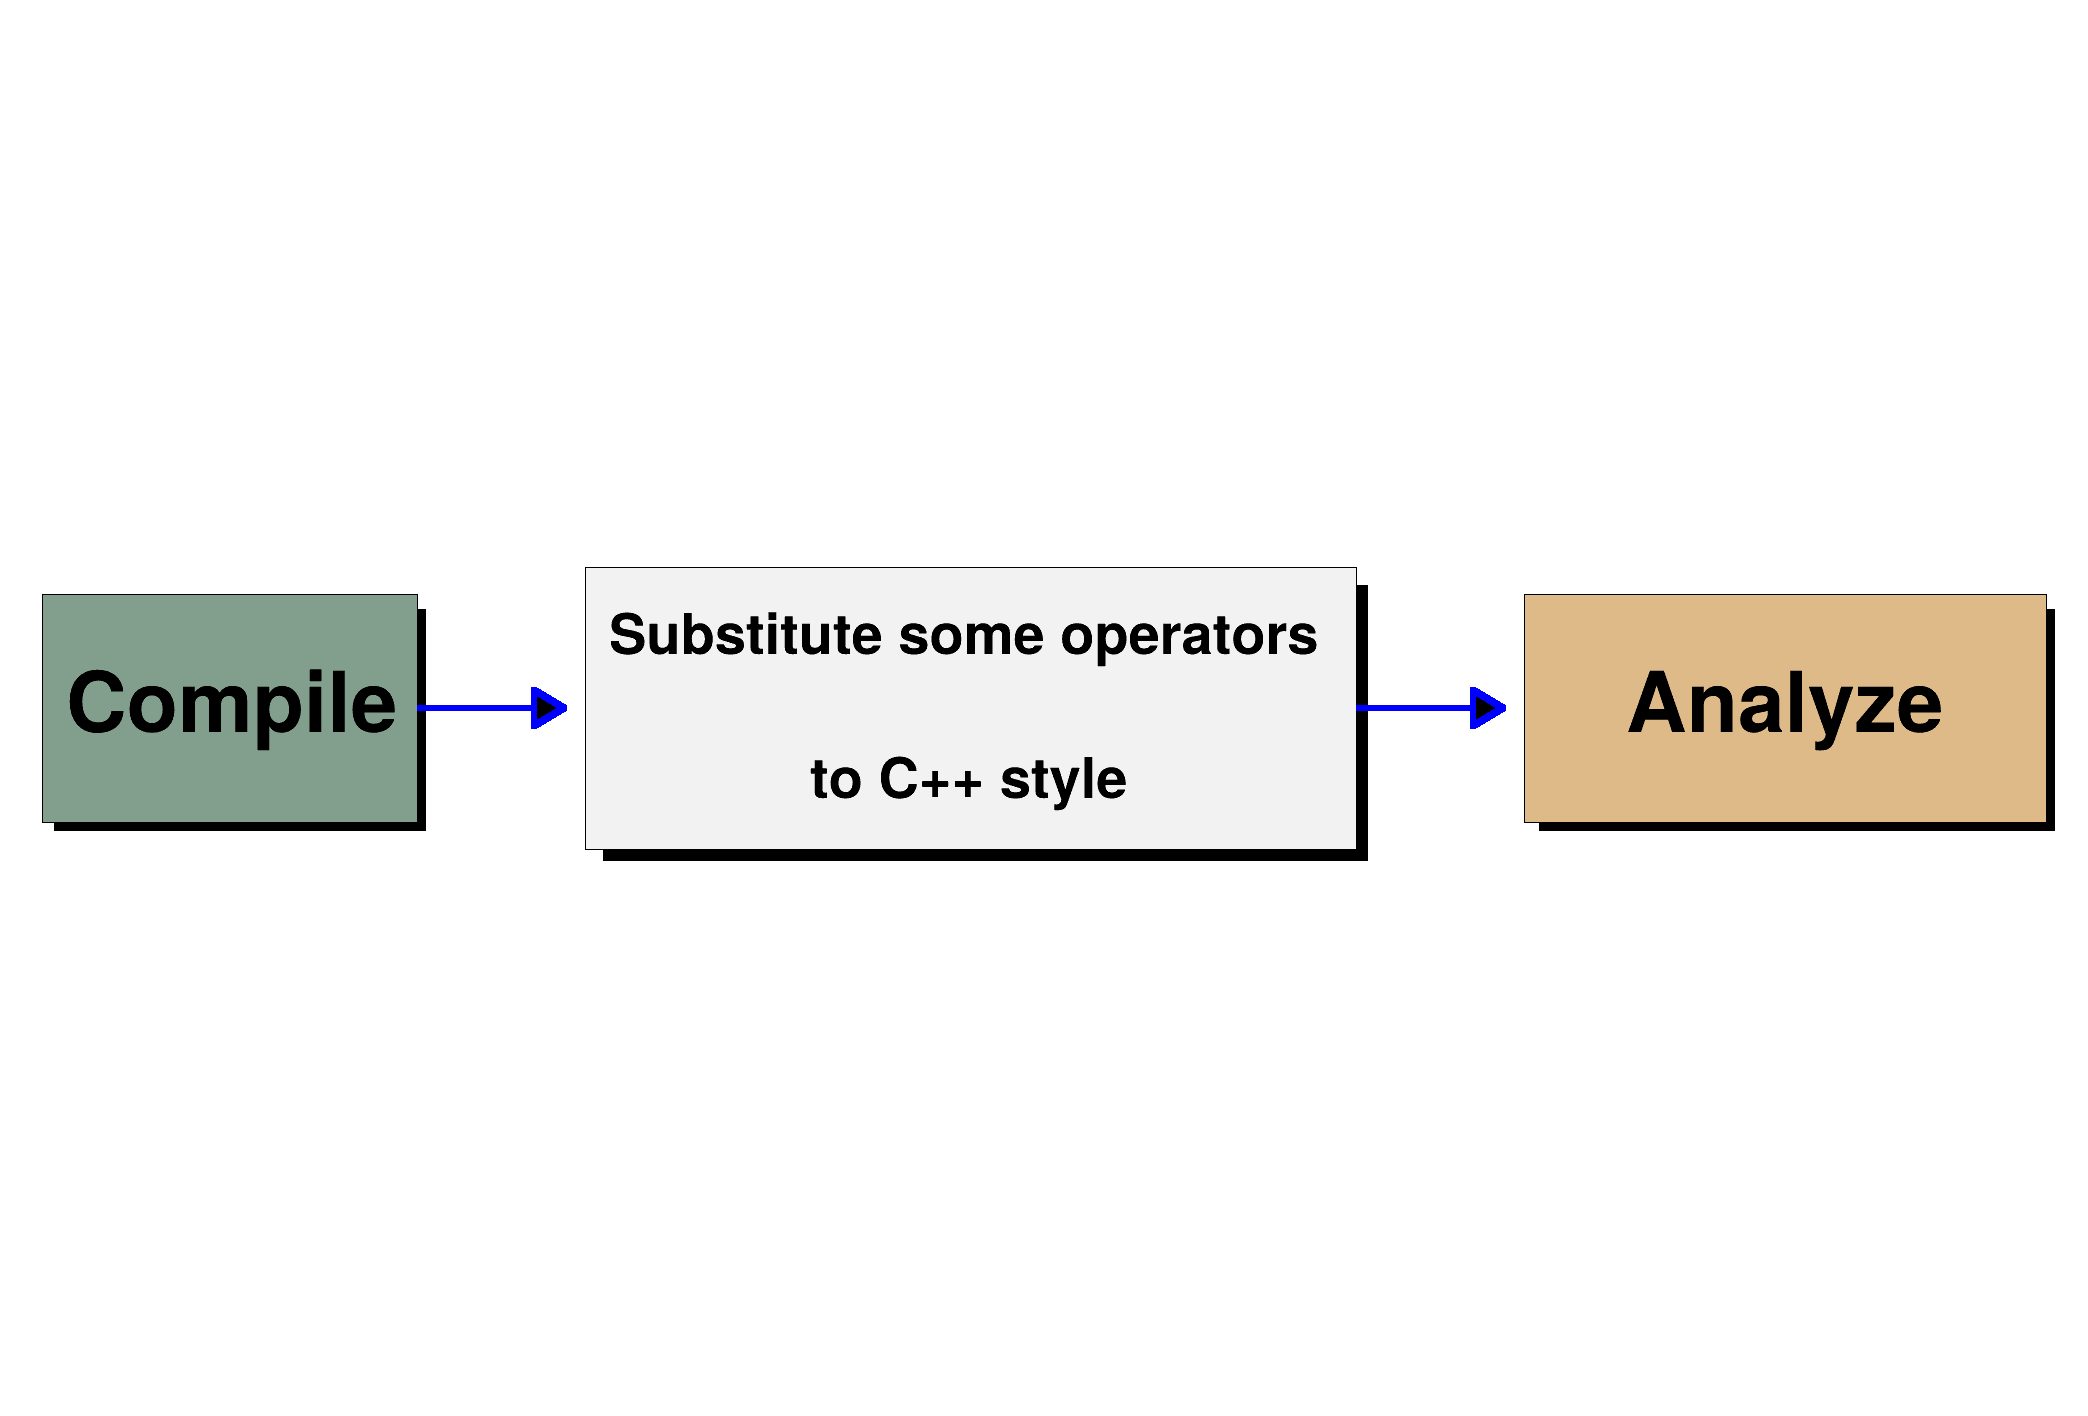 This macro produces the flowchart of TFormula::Compile. This macro produces the flowchart of TFormula::Compile. | |
| crown.C | |
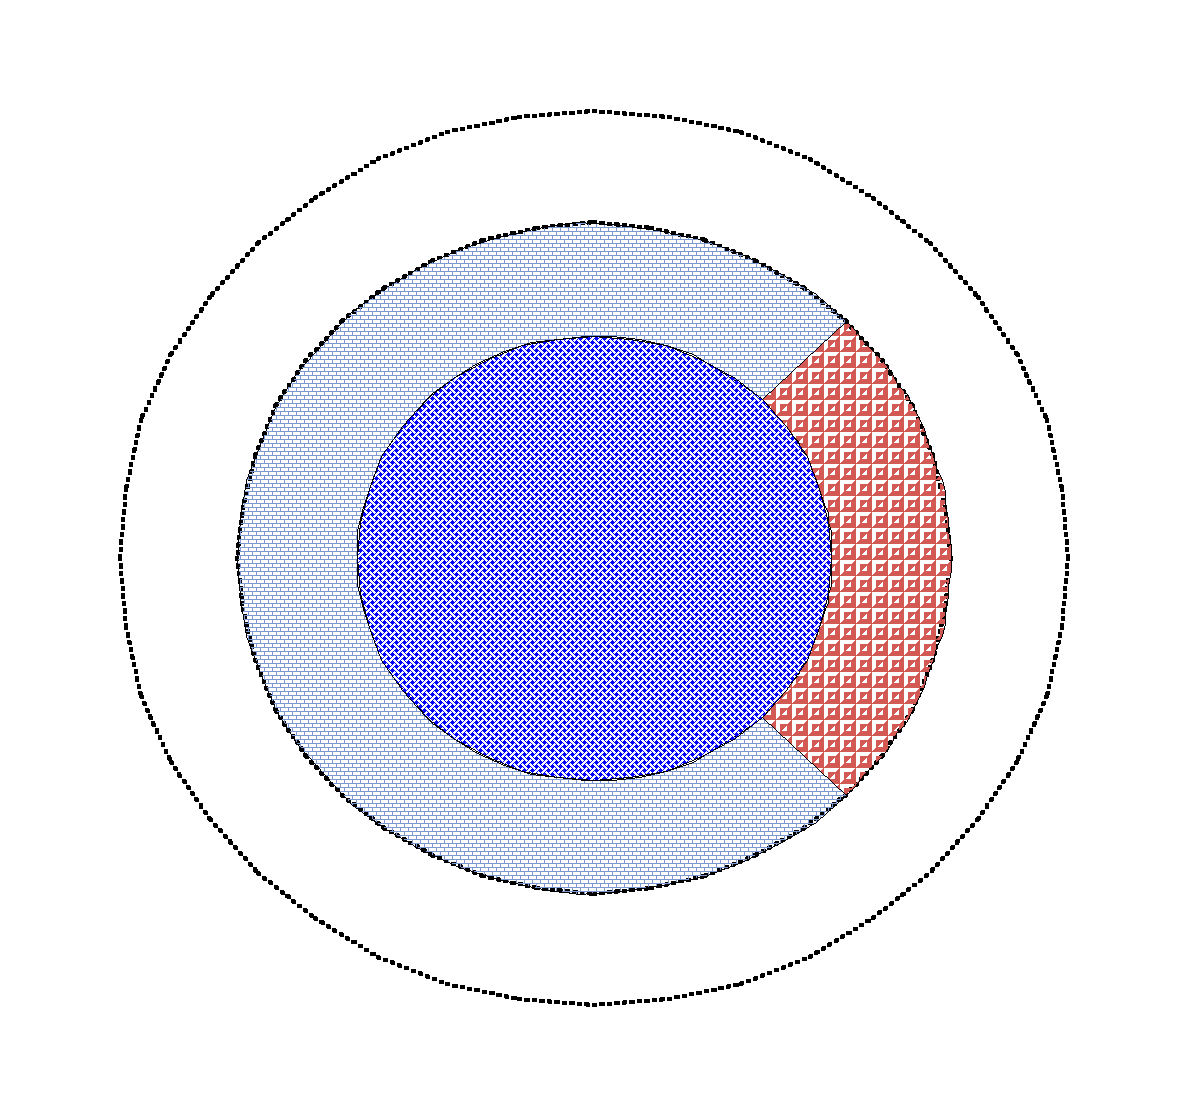 Draw crowns. Draw crowns. | |
| diamond.C | |
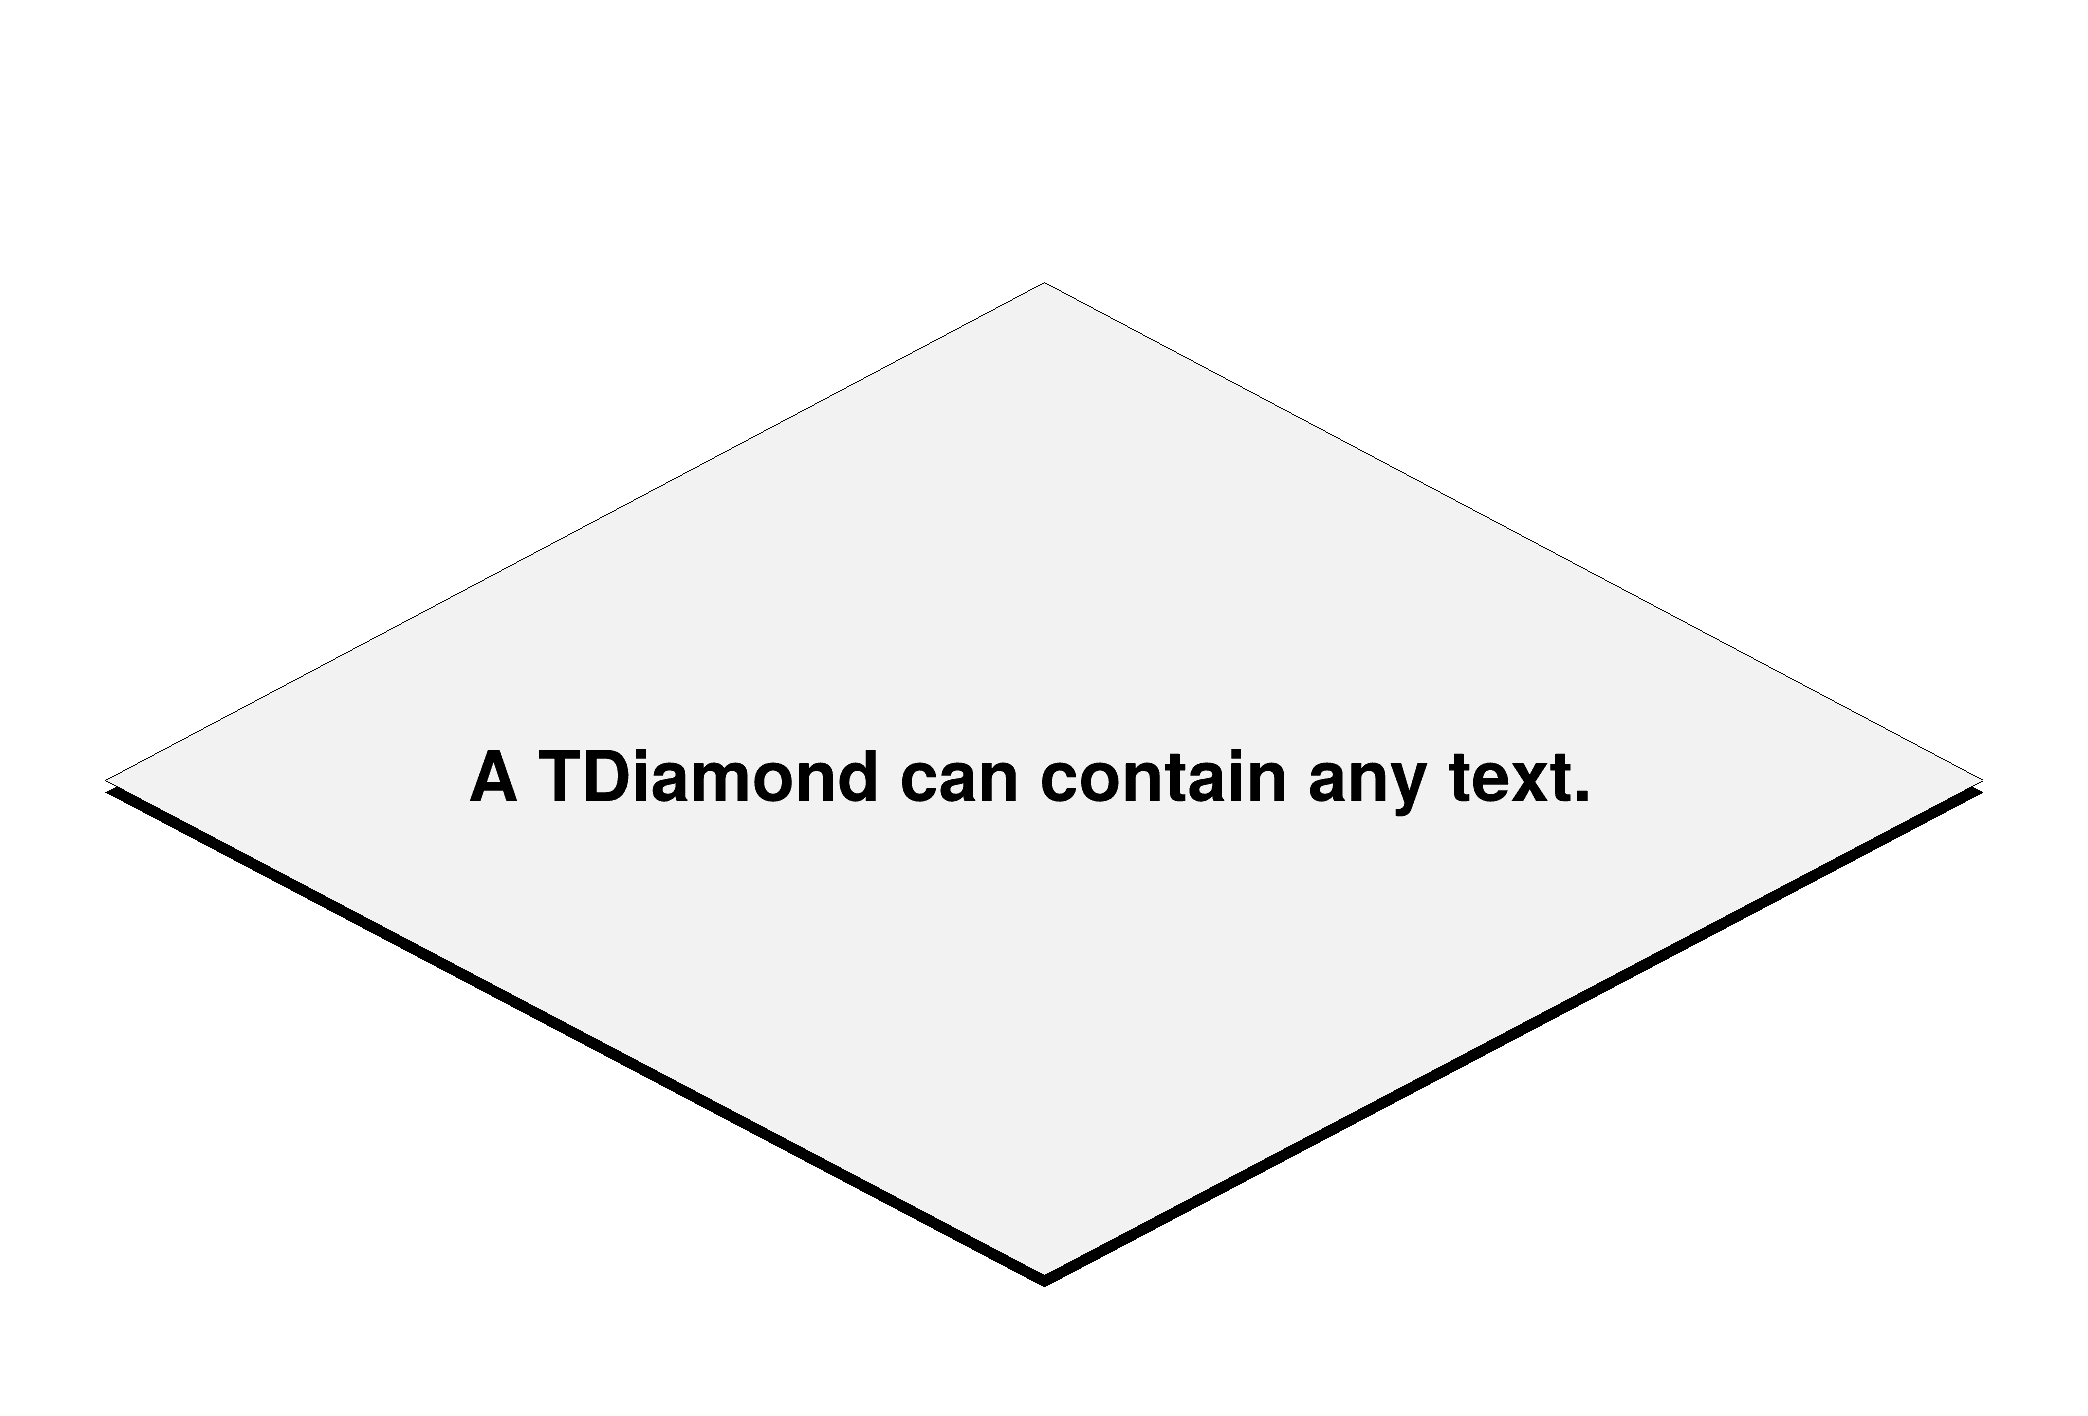 Draw a diamond. Draw a diamond. | |
| earth.C | |
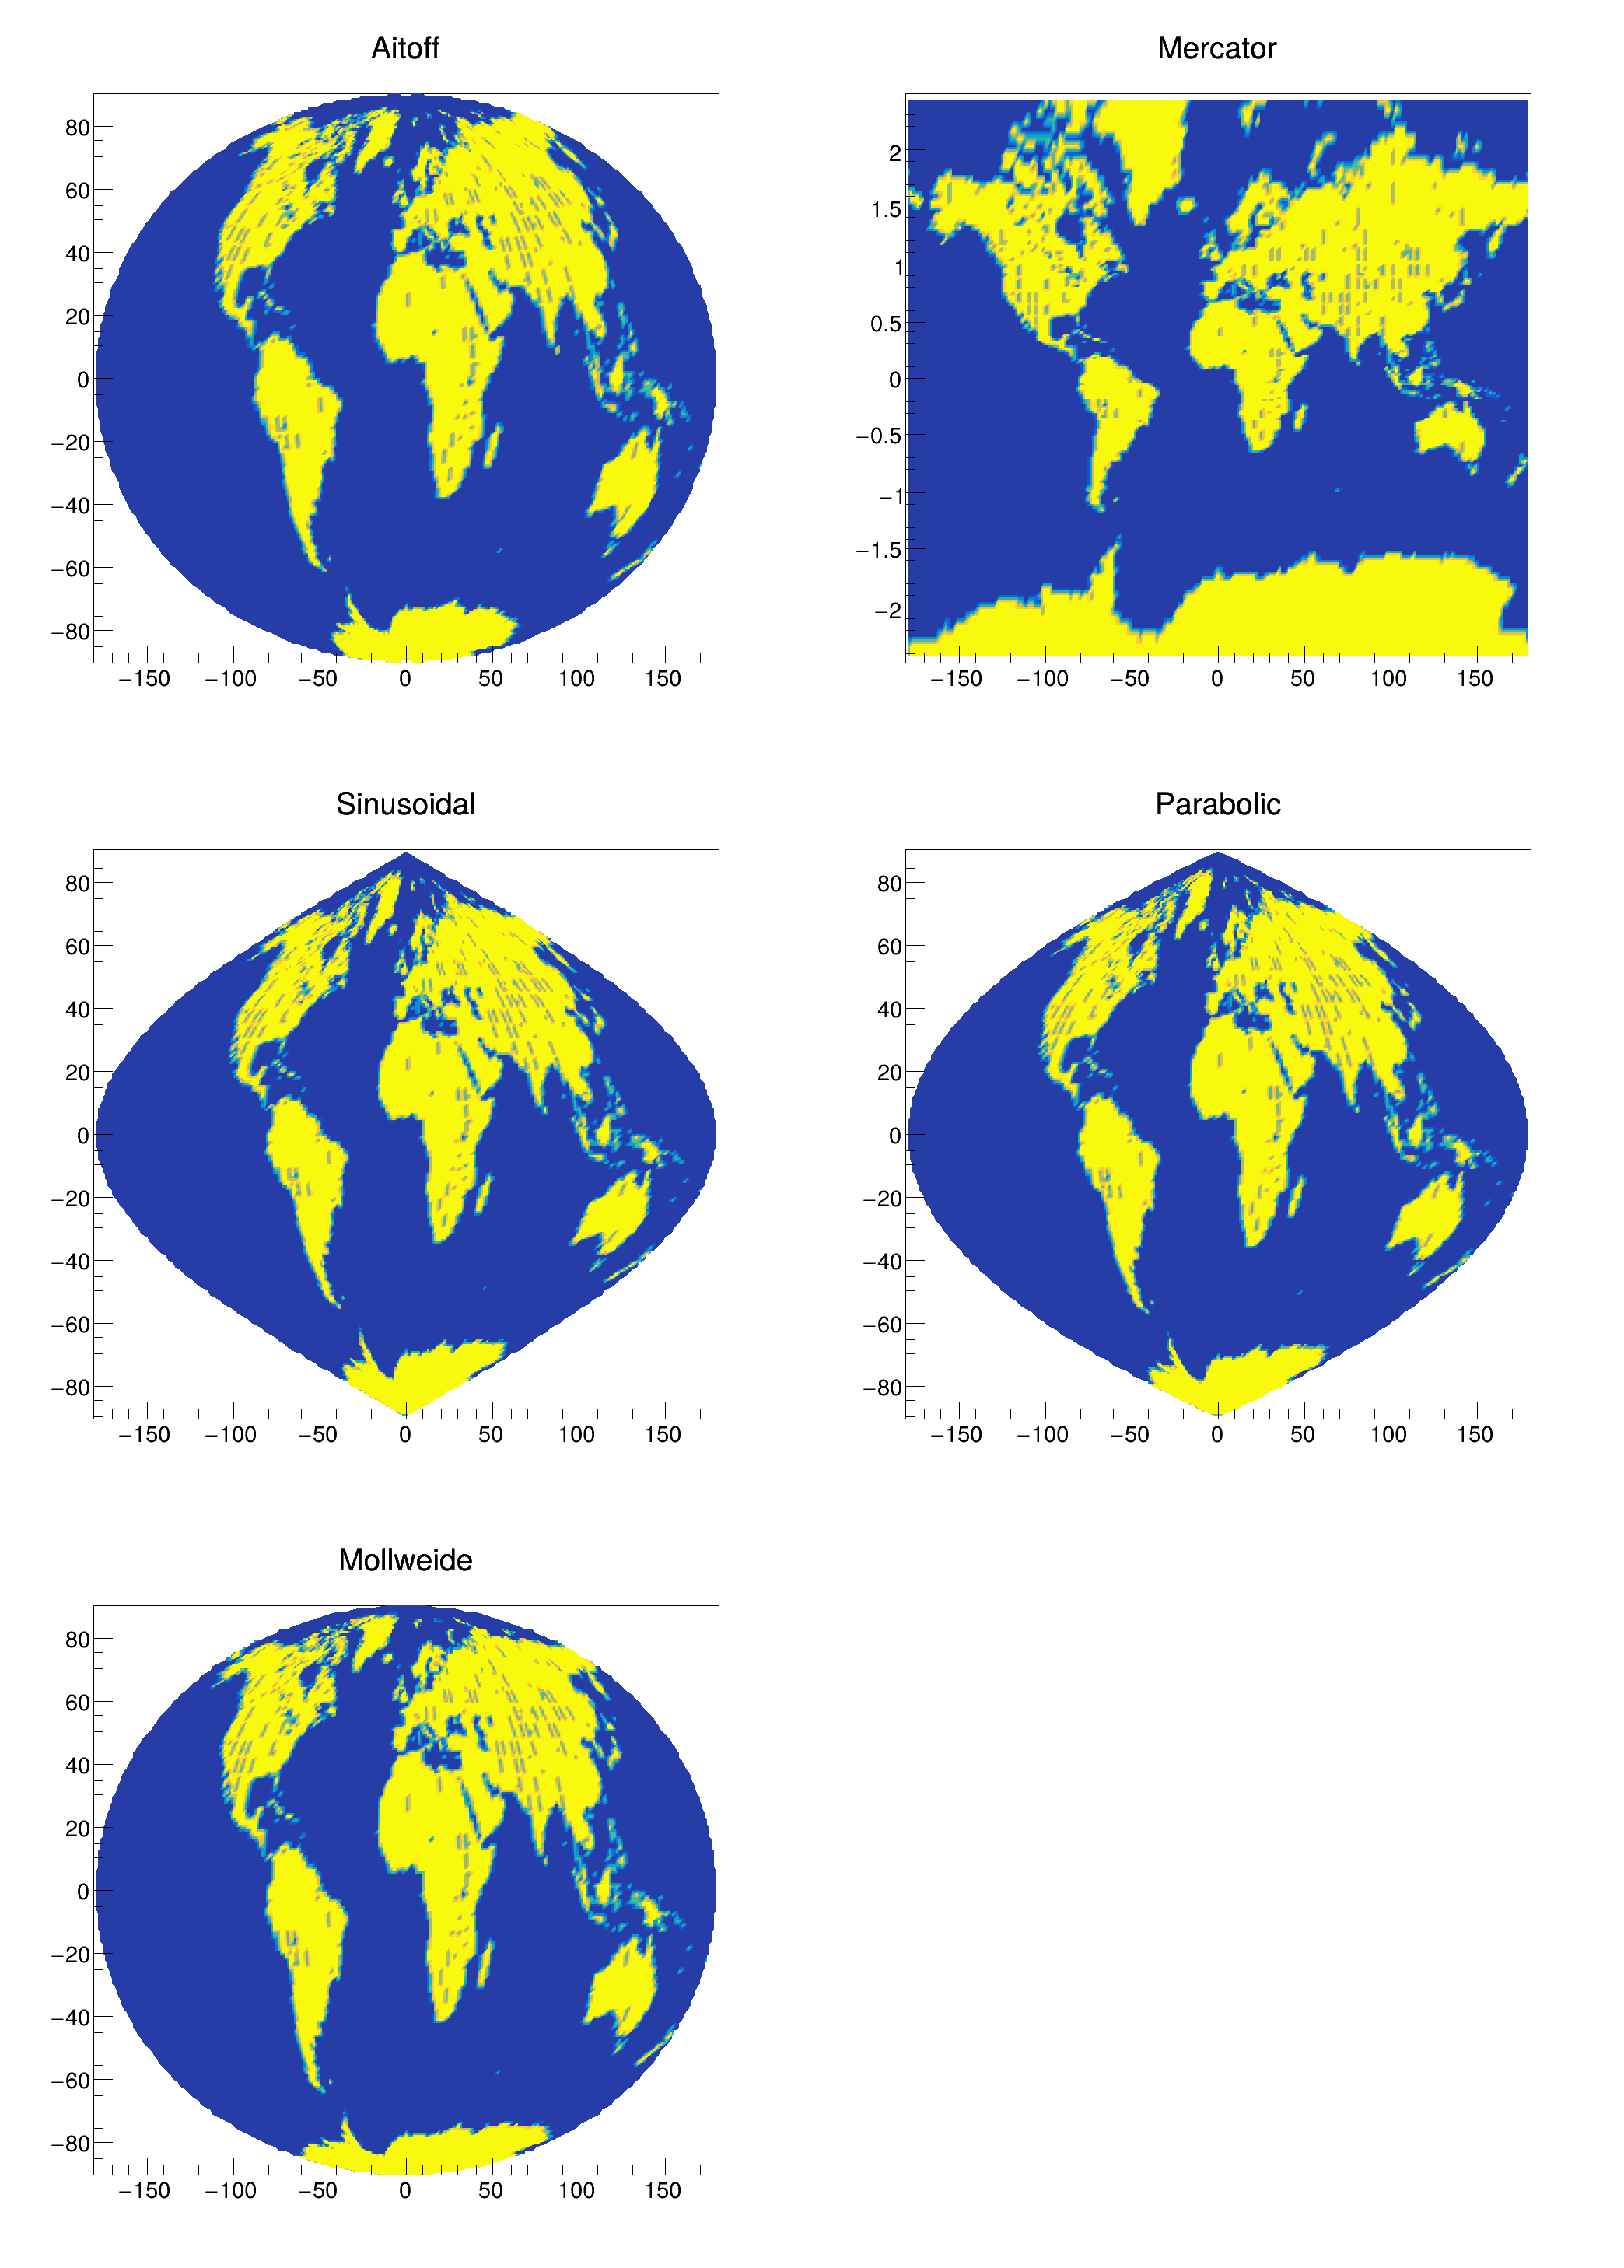 This tutorial illustrates the special contour options. This tutorial illustrates the special contour options. | |
| ellipse.C | |
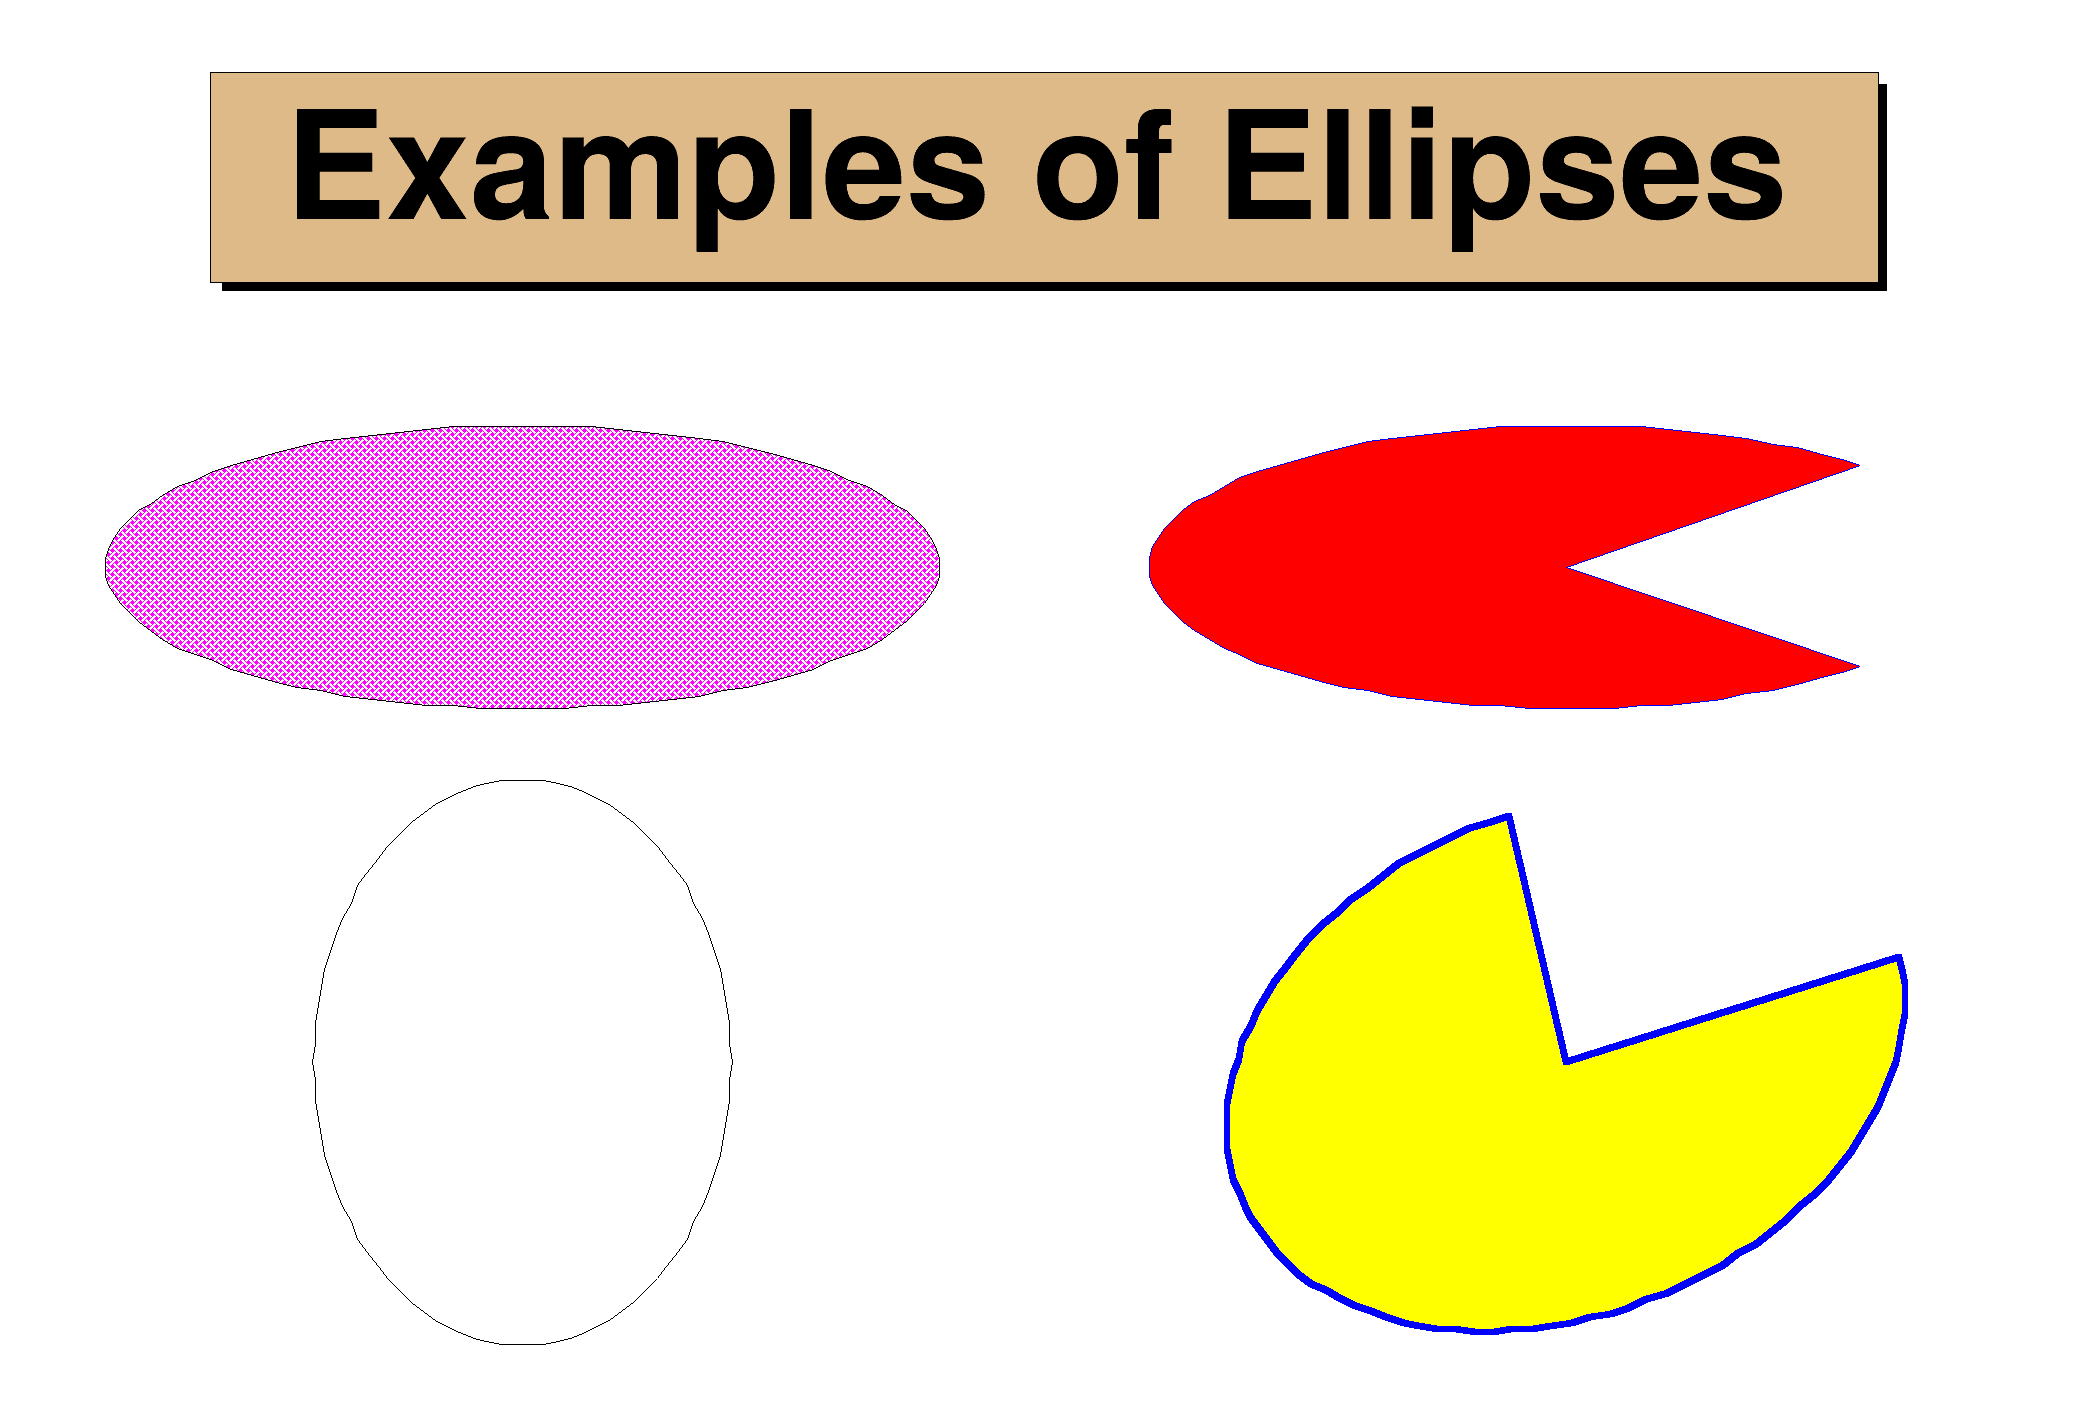 Draw ellipses. Draw ellipses. | |
| eval.C | |
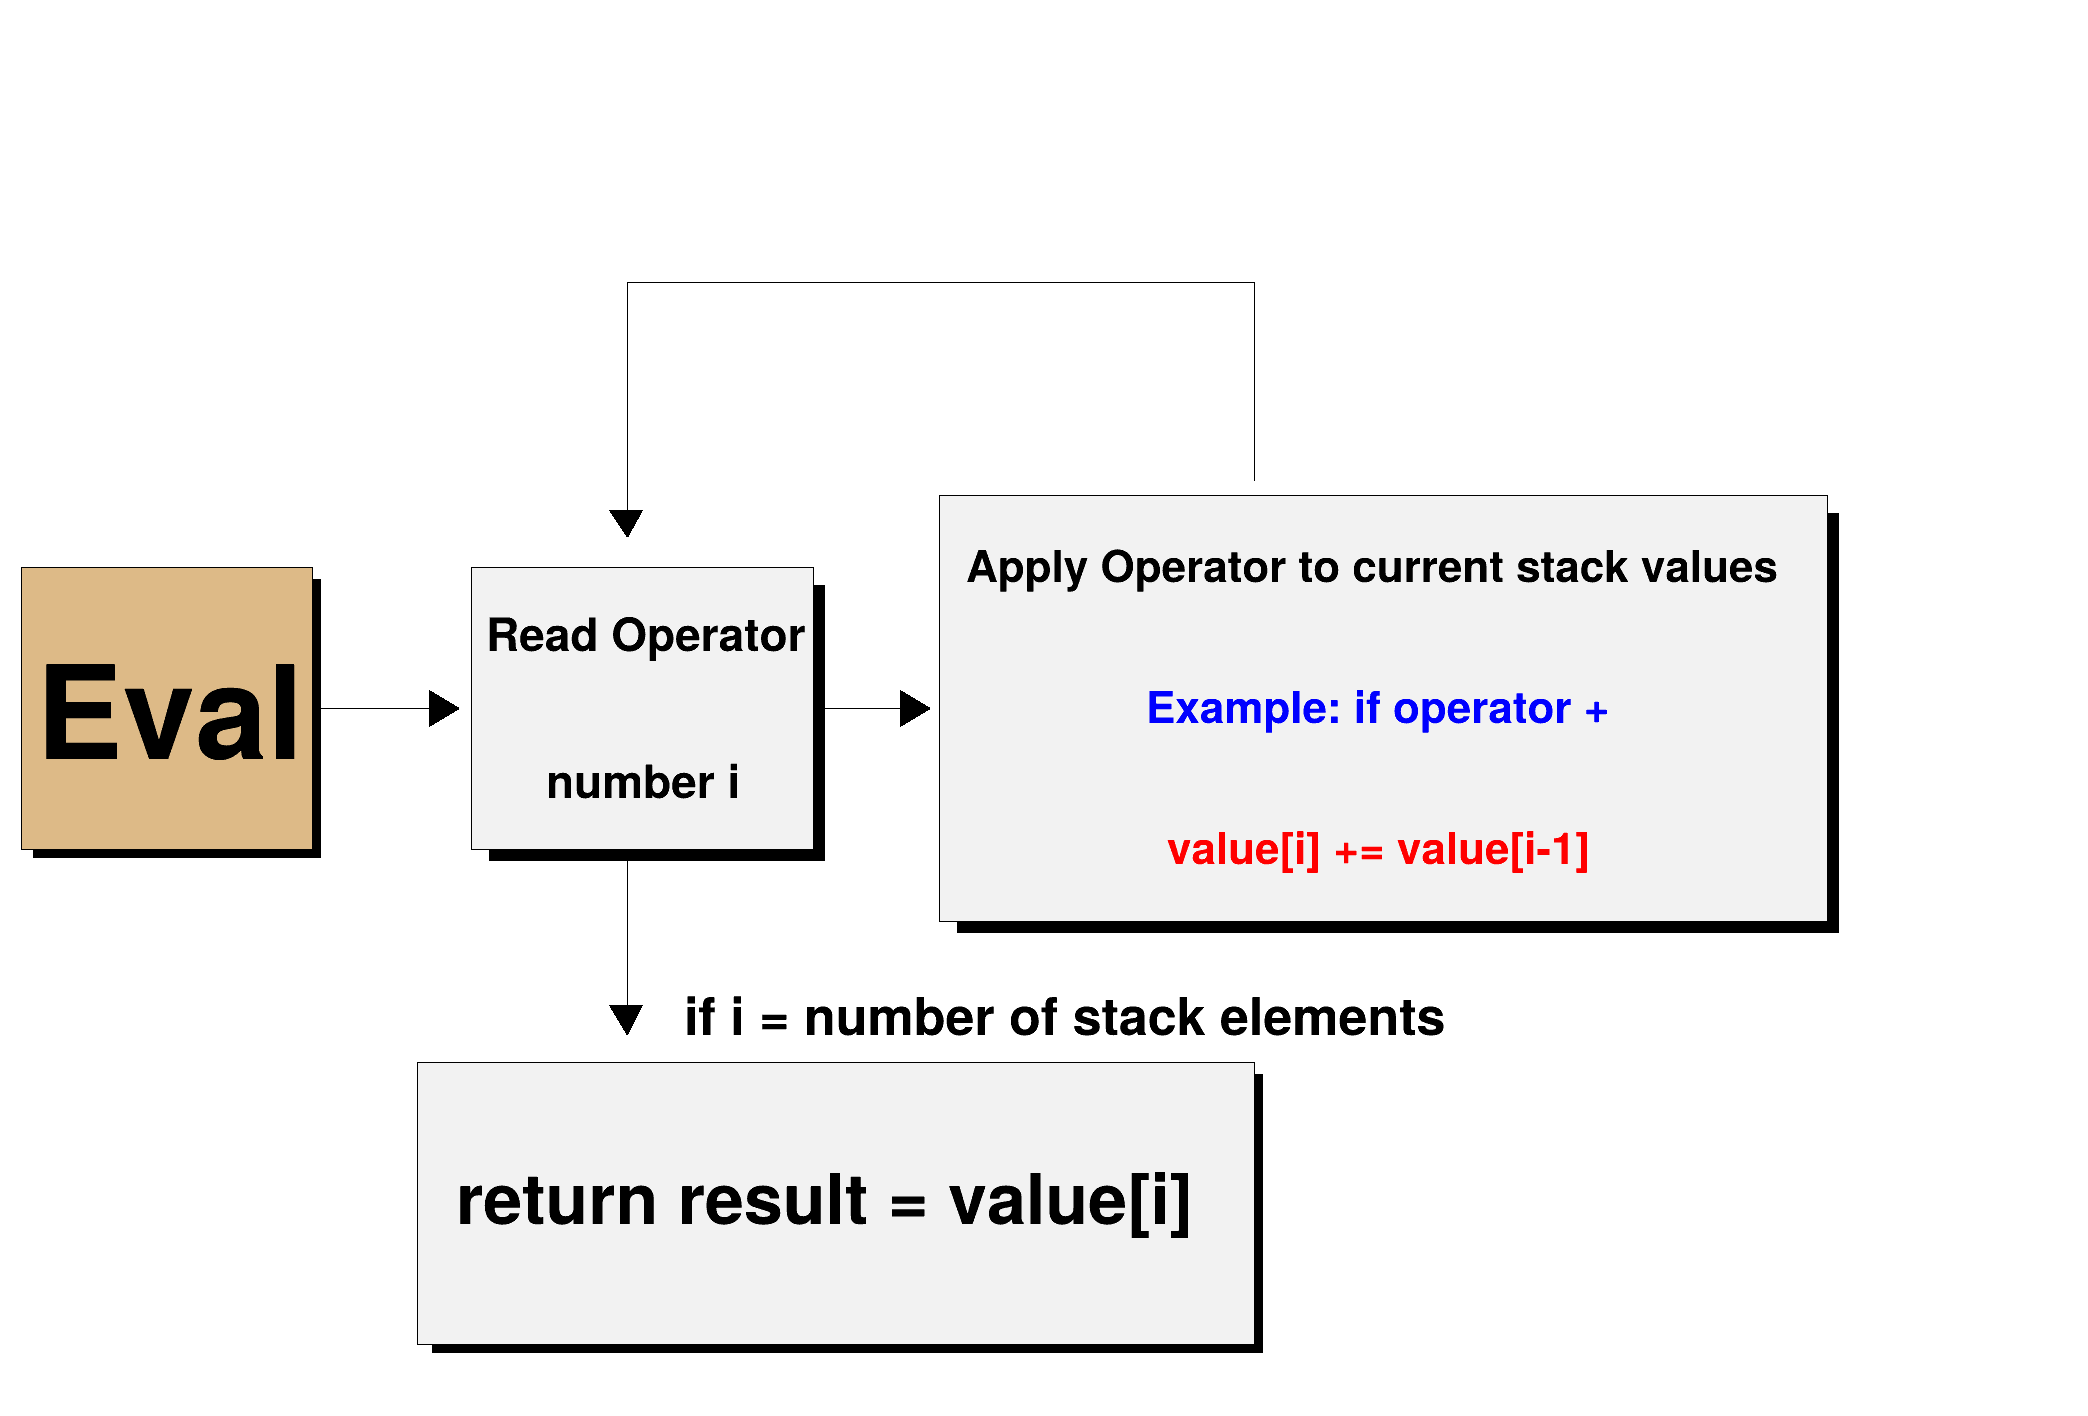 This macro produces the flowchart of TFormula::Eval. This macro produces the flowchart of TFormula::Eval. | |
| event.C | |
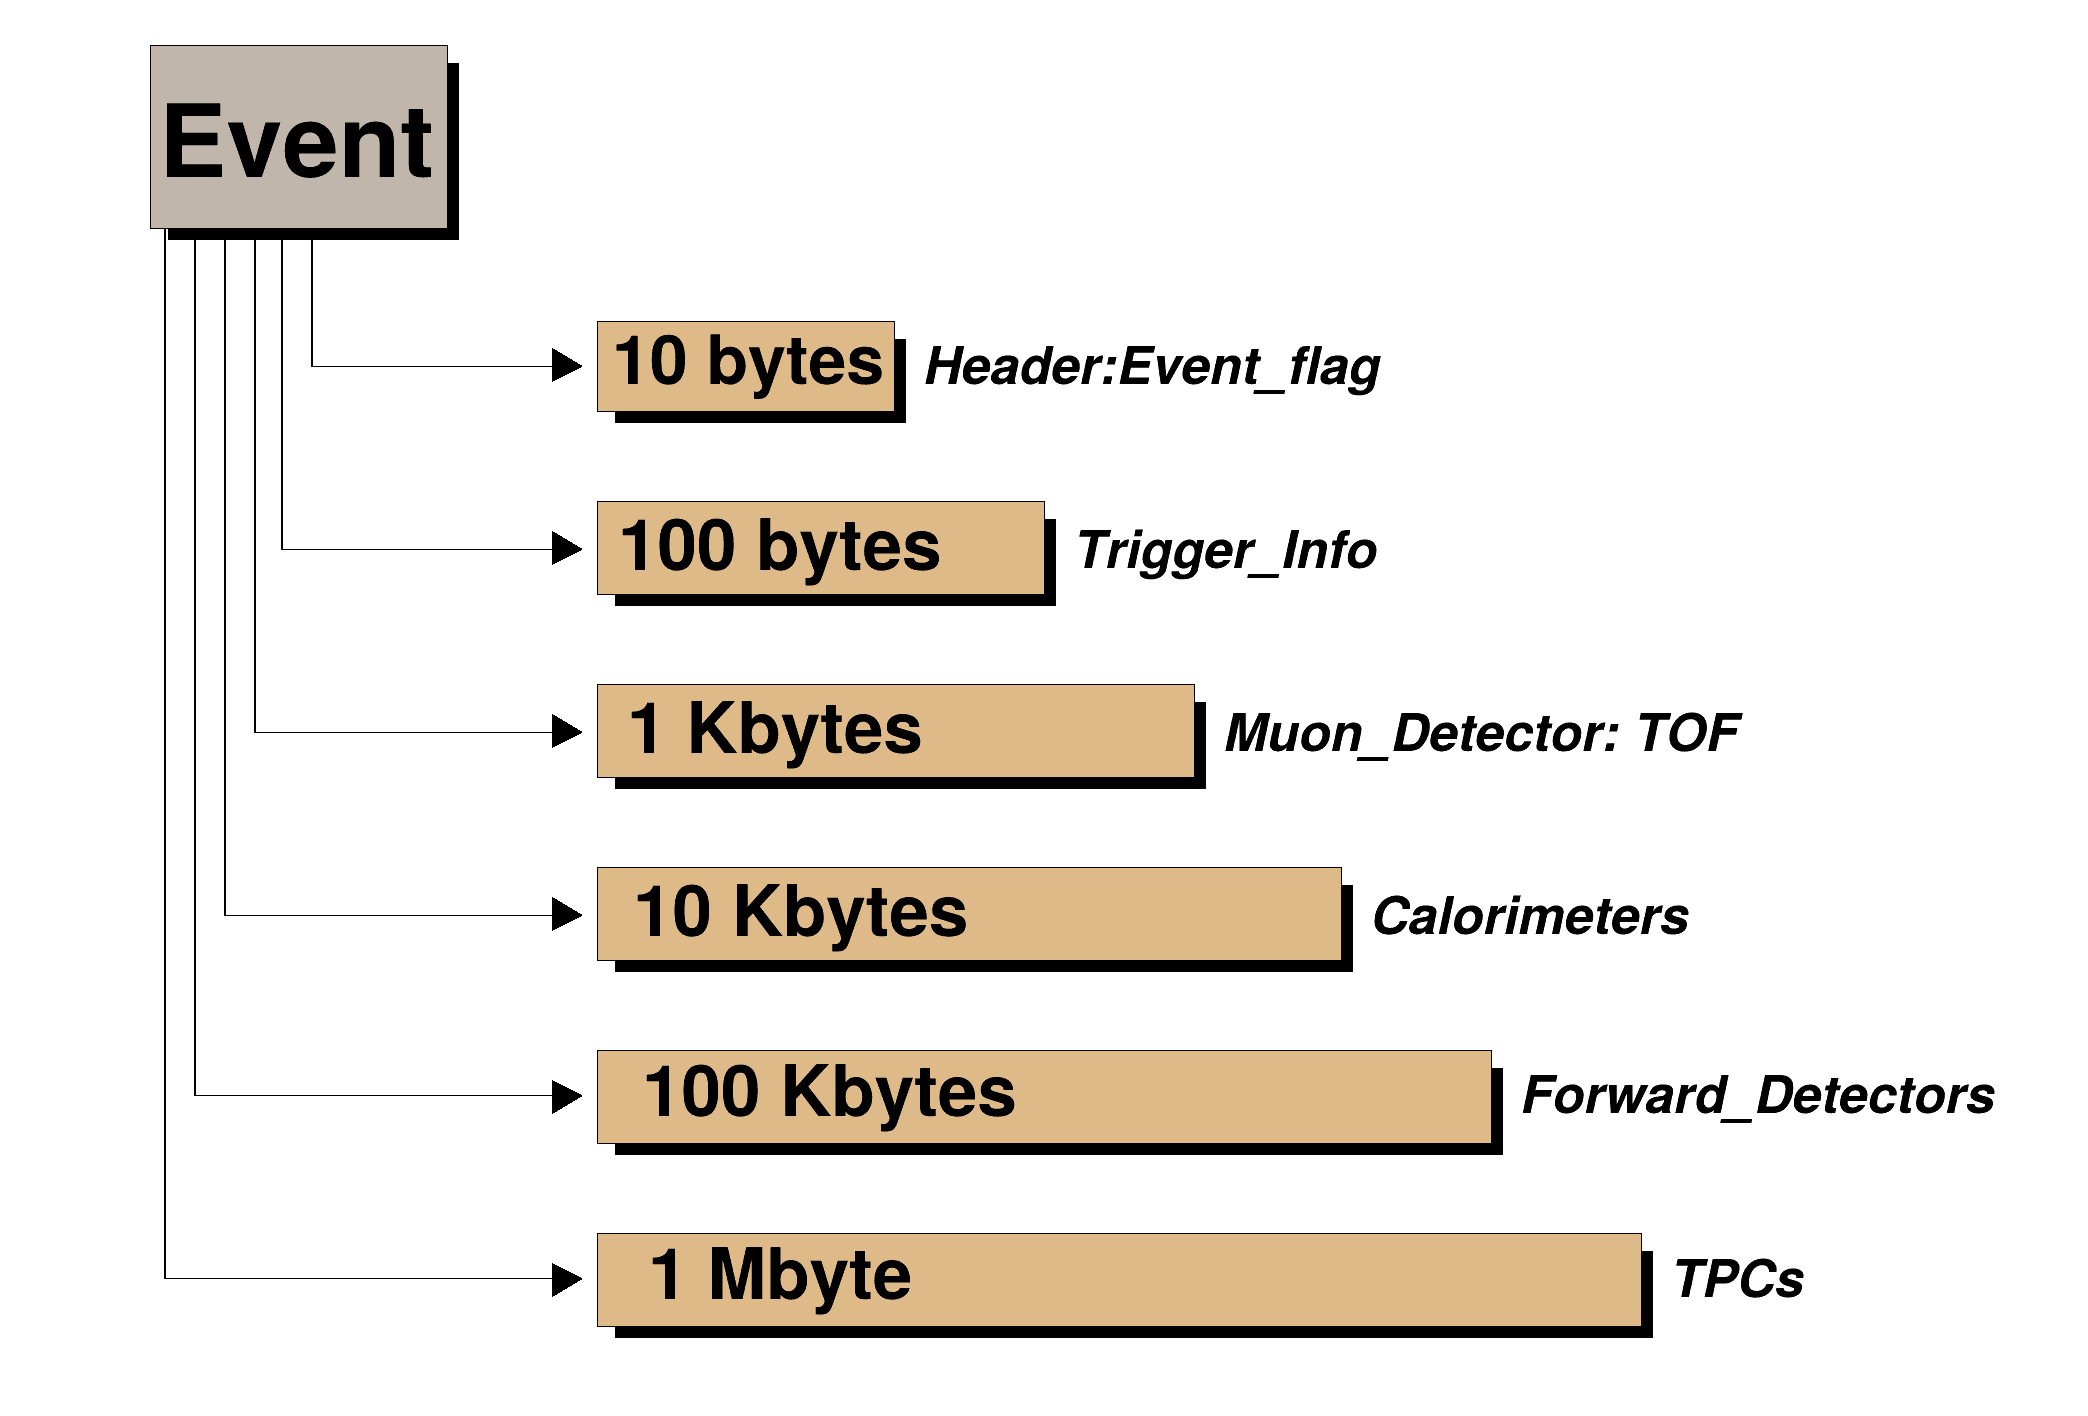 Illustrate some basic primitives. Illustrate some basic primitives. | |
| feynman.C | |
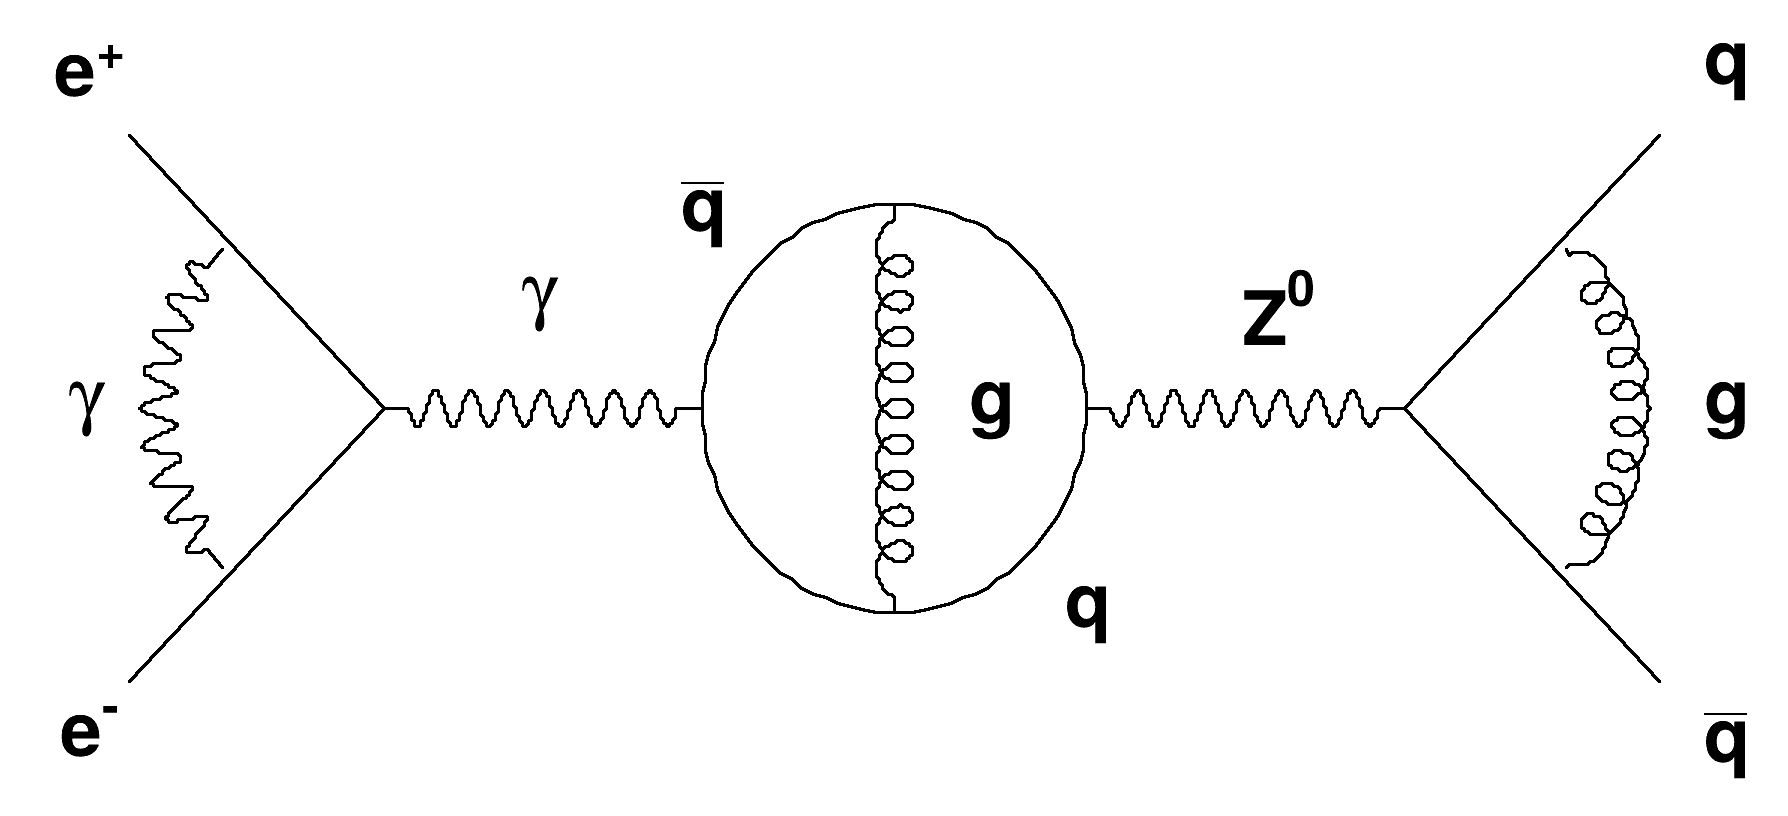 Draw Feynman diagrams. Draw Feynman diagrams. | |
| first.C | |
 Show some basic primitives. Show some basic primitives. | |
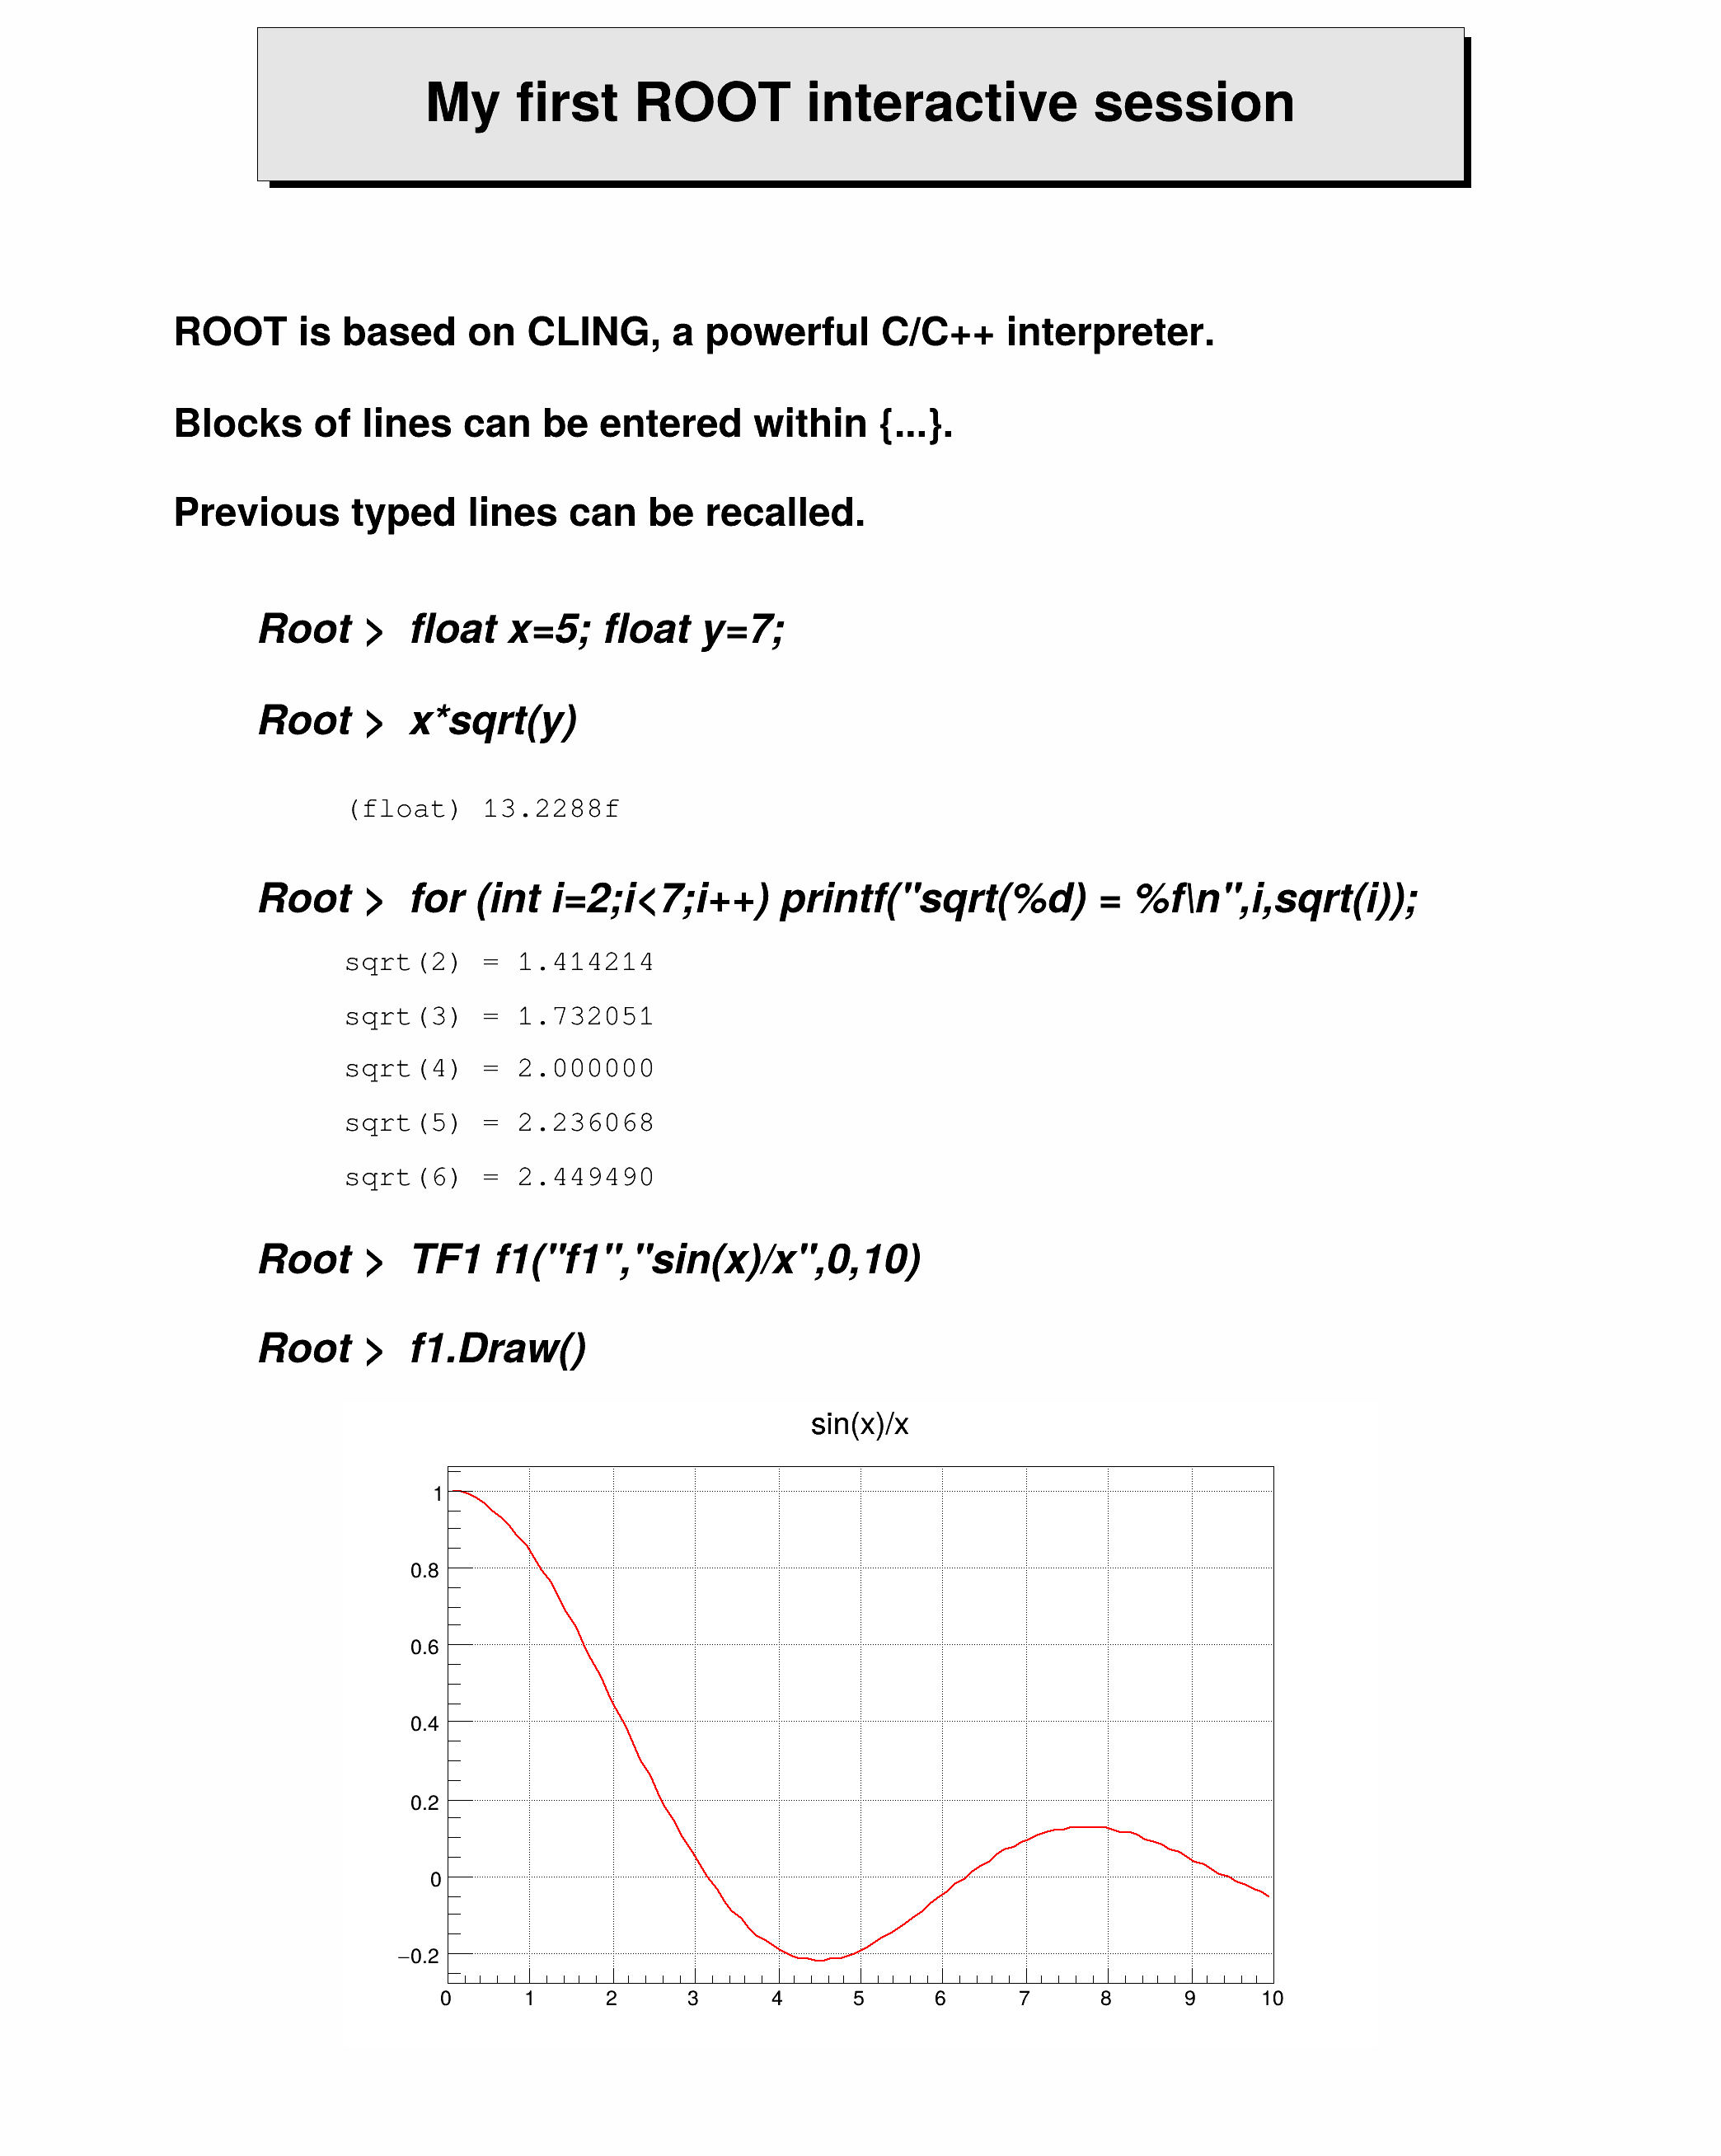
| formula1.C | |
 Display interpreted functions. Display interpreted functions. | |
| formula1.py | |
| TF1 example. | |
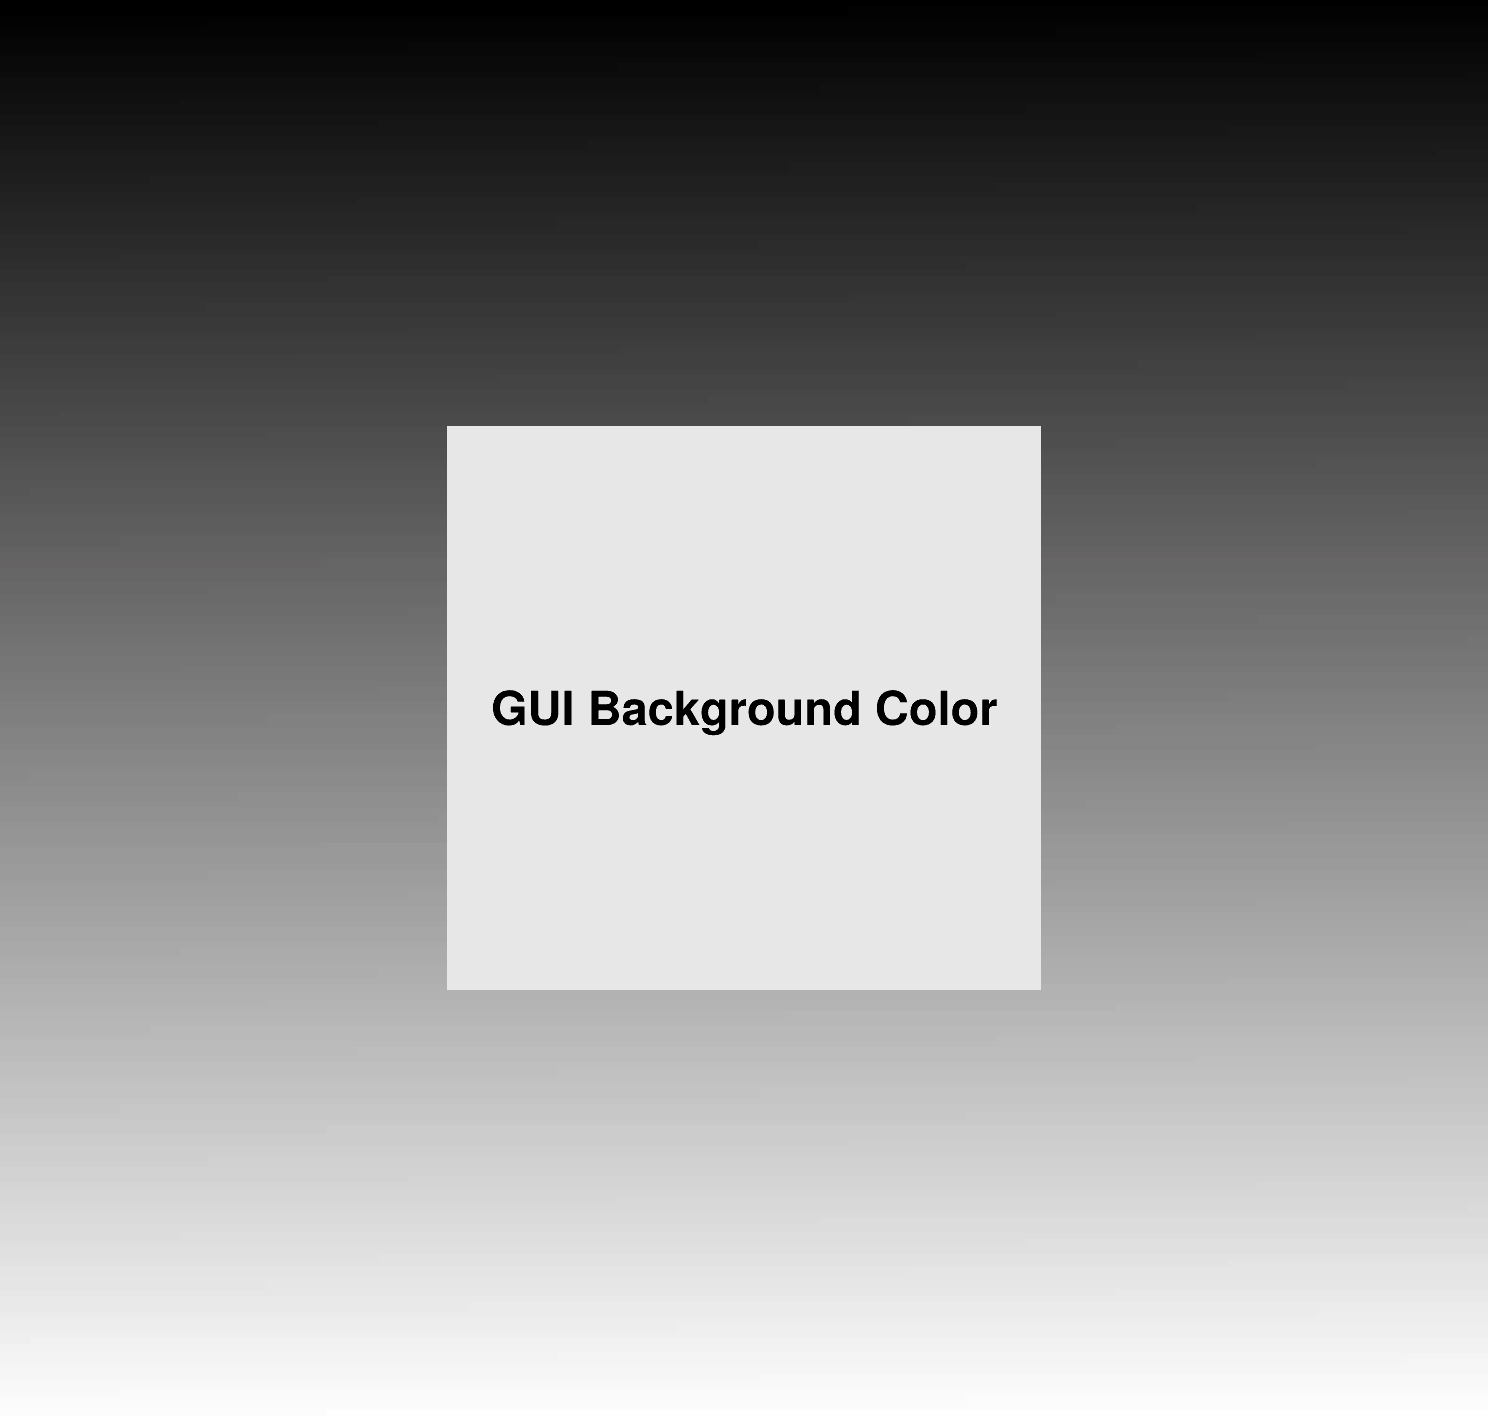
| framework.C | |
 An example with basic graphics illustrating the Object Oriented User Interface of ROOT. An example with basic graphics illustrating the Object Oriented User Interface of ROOT. | |
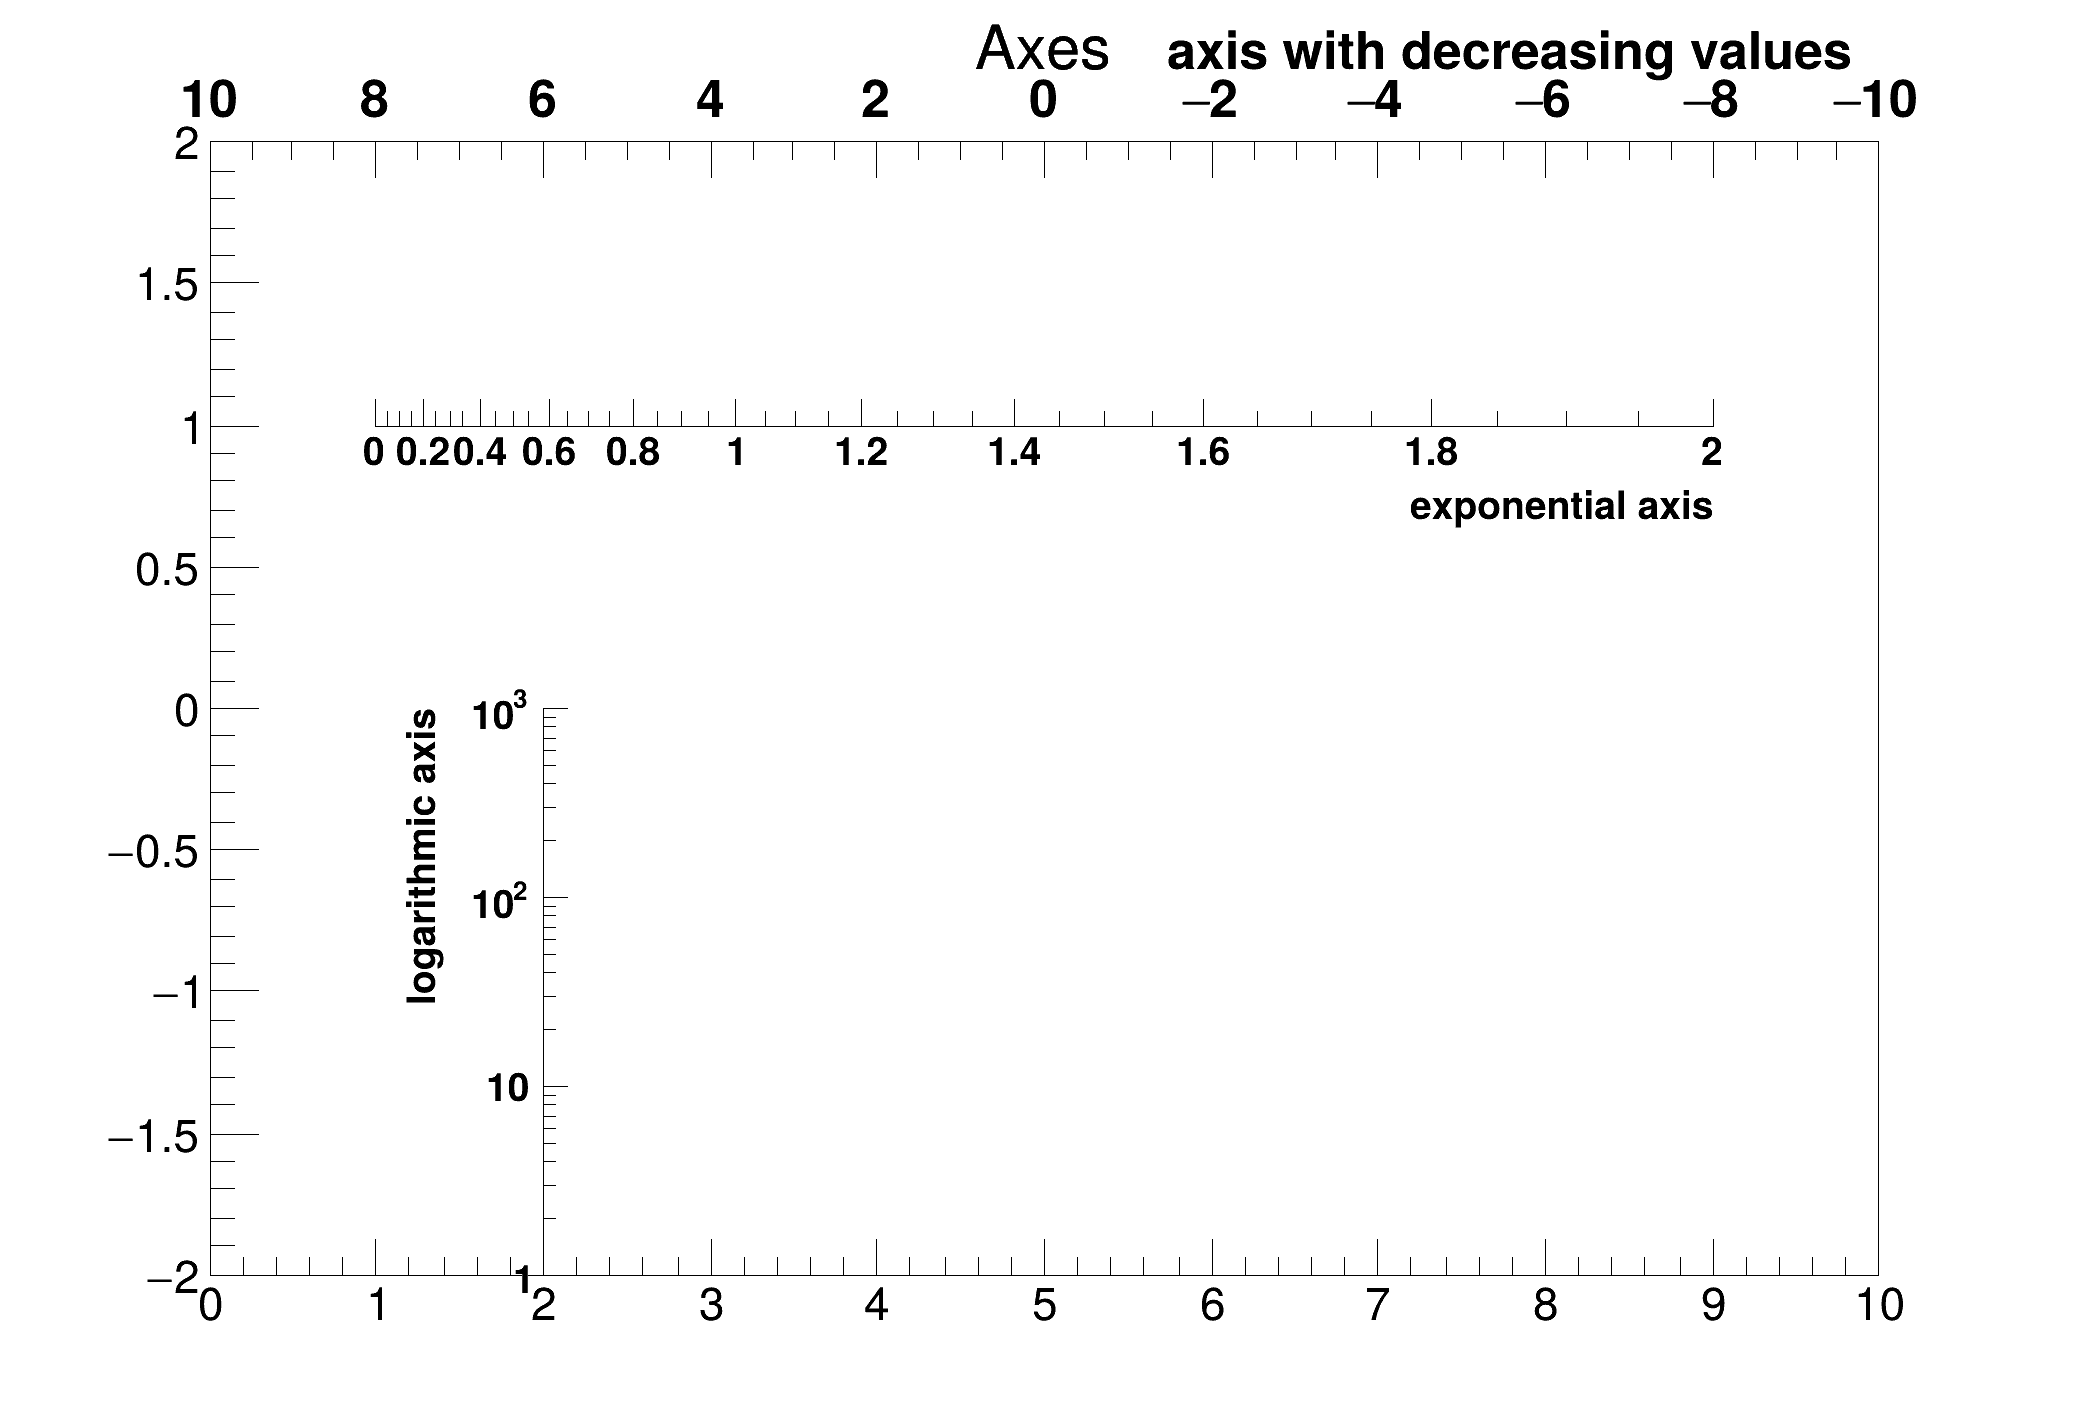
| gaxis.C | |
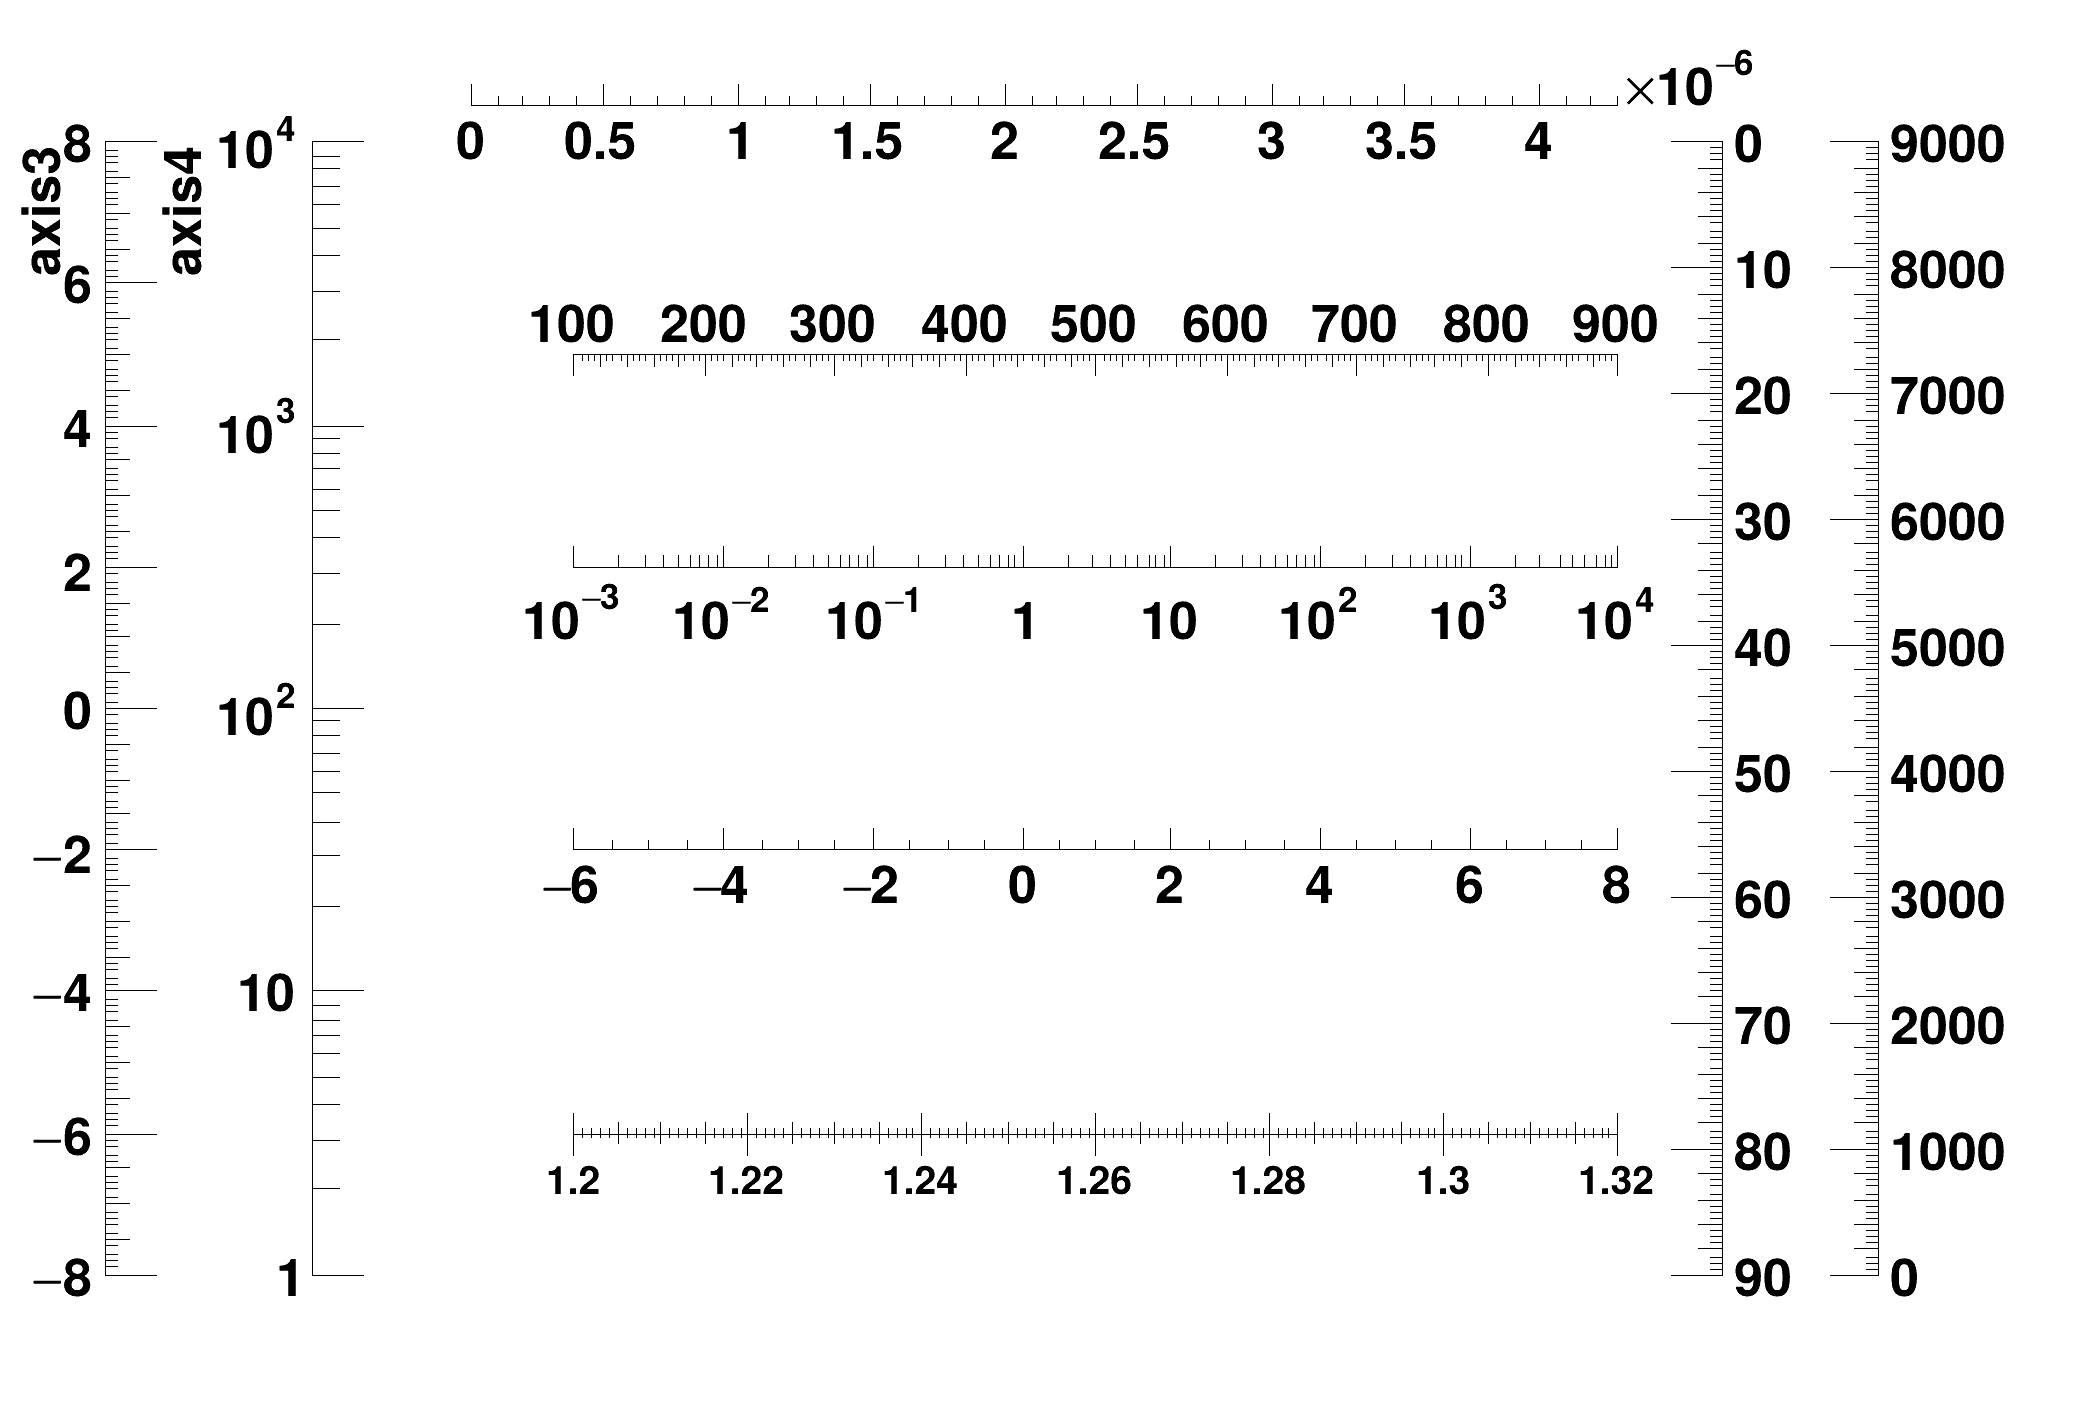 Simple example illustrating how to draw TGaxis objects in various formats. Simple example illustrating how to draw TGaxis objects in various formats. | |
| gaxis2.C | |
 Example illustrating how to draw TGaxis with labels defined by a function. Example illustrating how to draw TGaxis with labels defined by a function. | |
| gaxis3.C | |
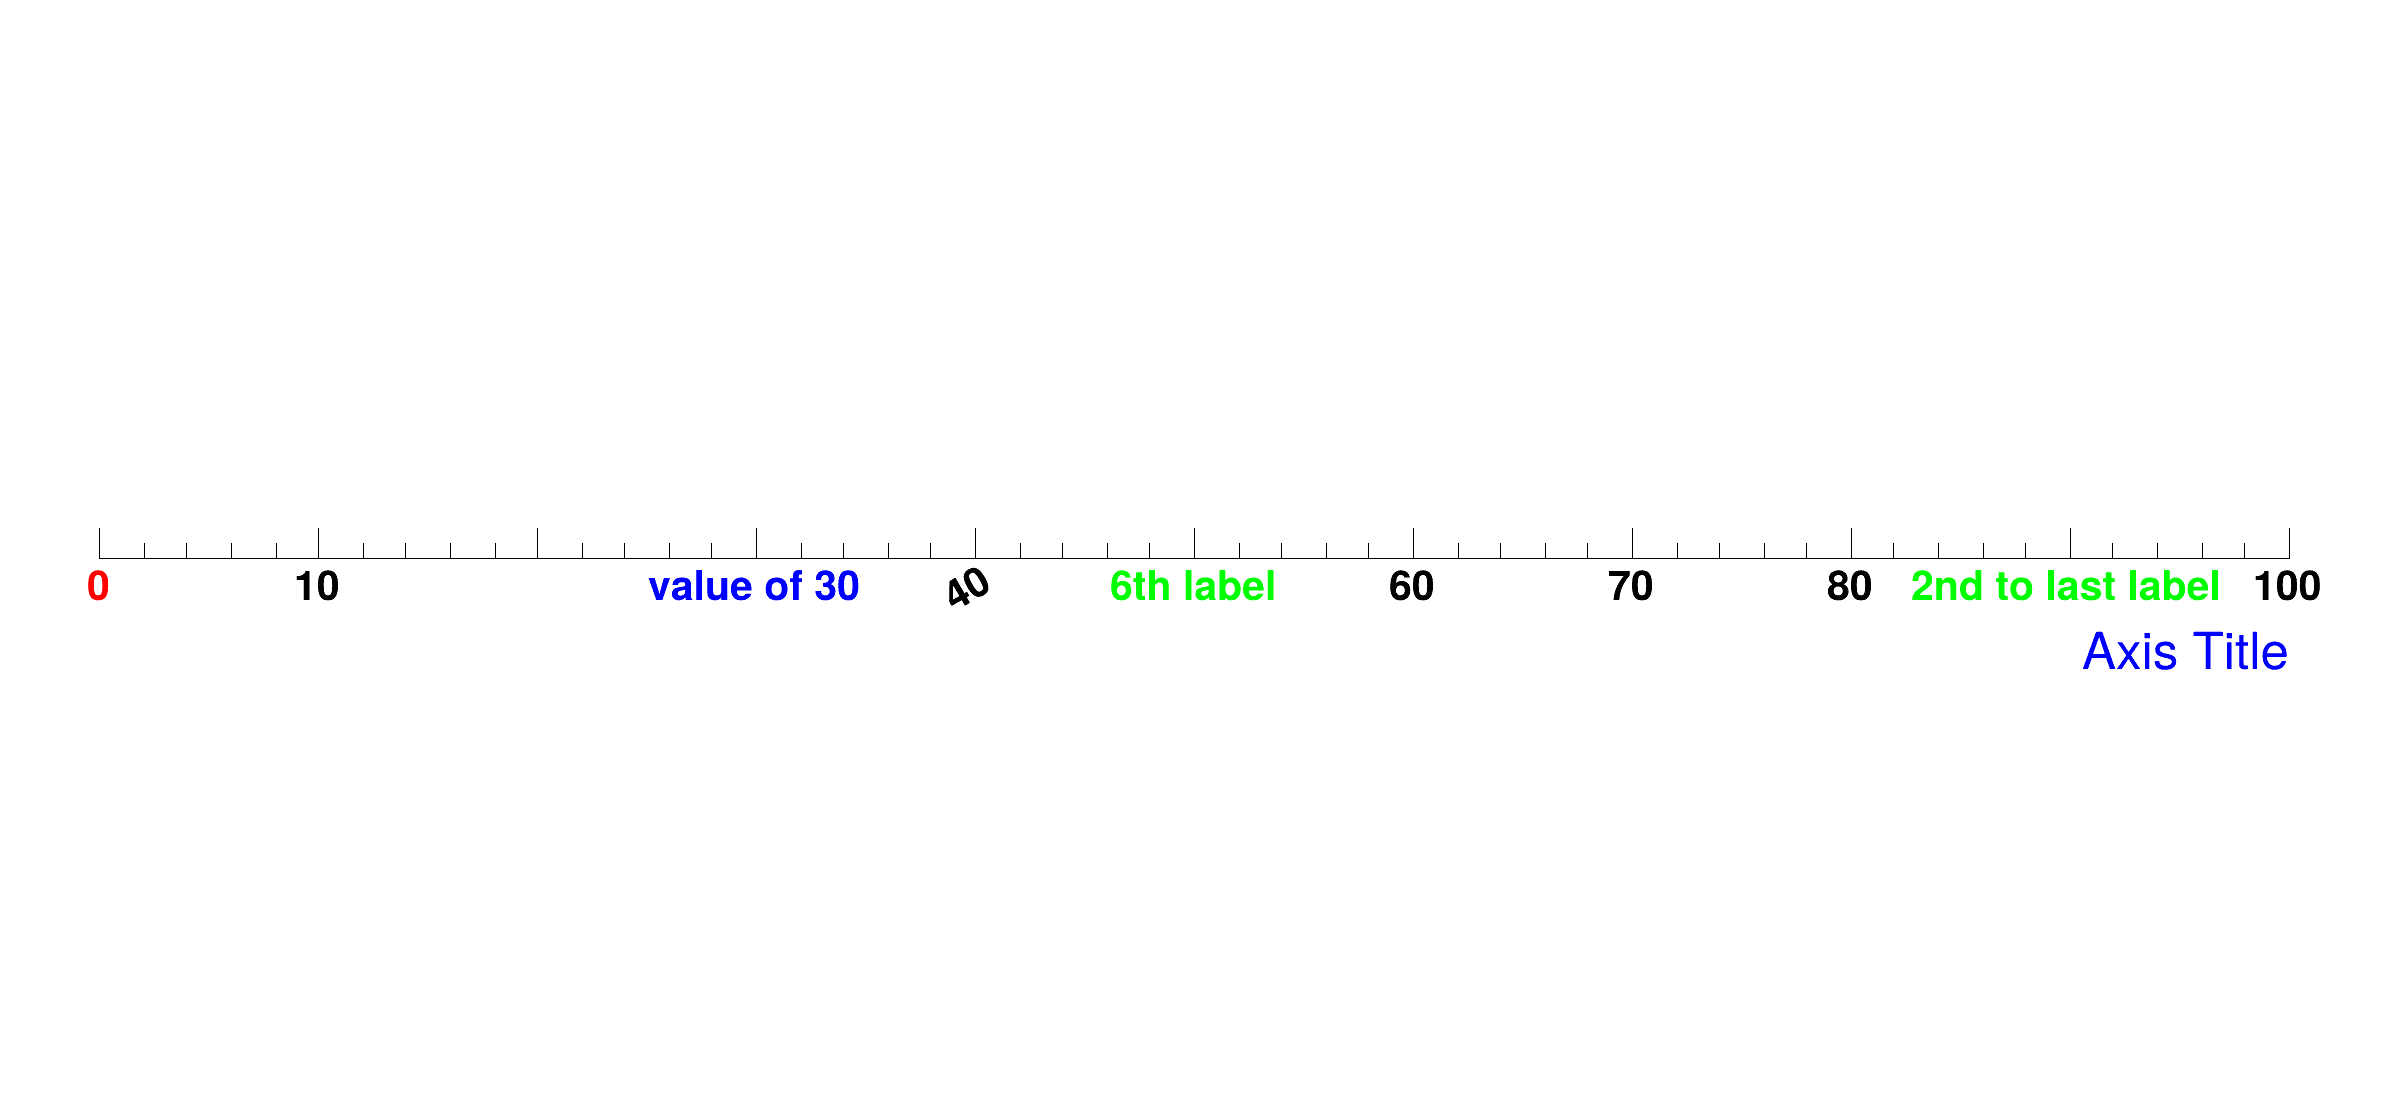 Example illustrating how to modify individual labels of a TGaxis. Example illustrating how to modify individual labels of a TGaxis. | |
| graph_edit_playback.C | |
| This macro plays a recorded ROOT session showing how to perform various interactive graphical editing operations. | |
| greyscale.C | |
 Create grey scale of 200x200 boxes. Create grey scale of 200x200 boxes. | |
| gtime.C | |
| Example of a graph of data moving in time. | |
| inside.C | |
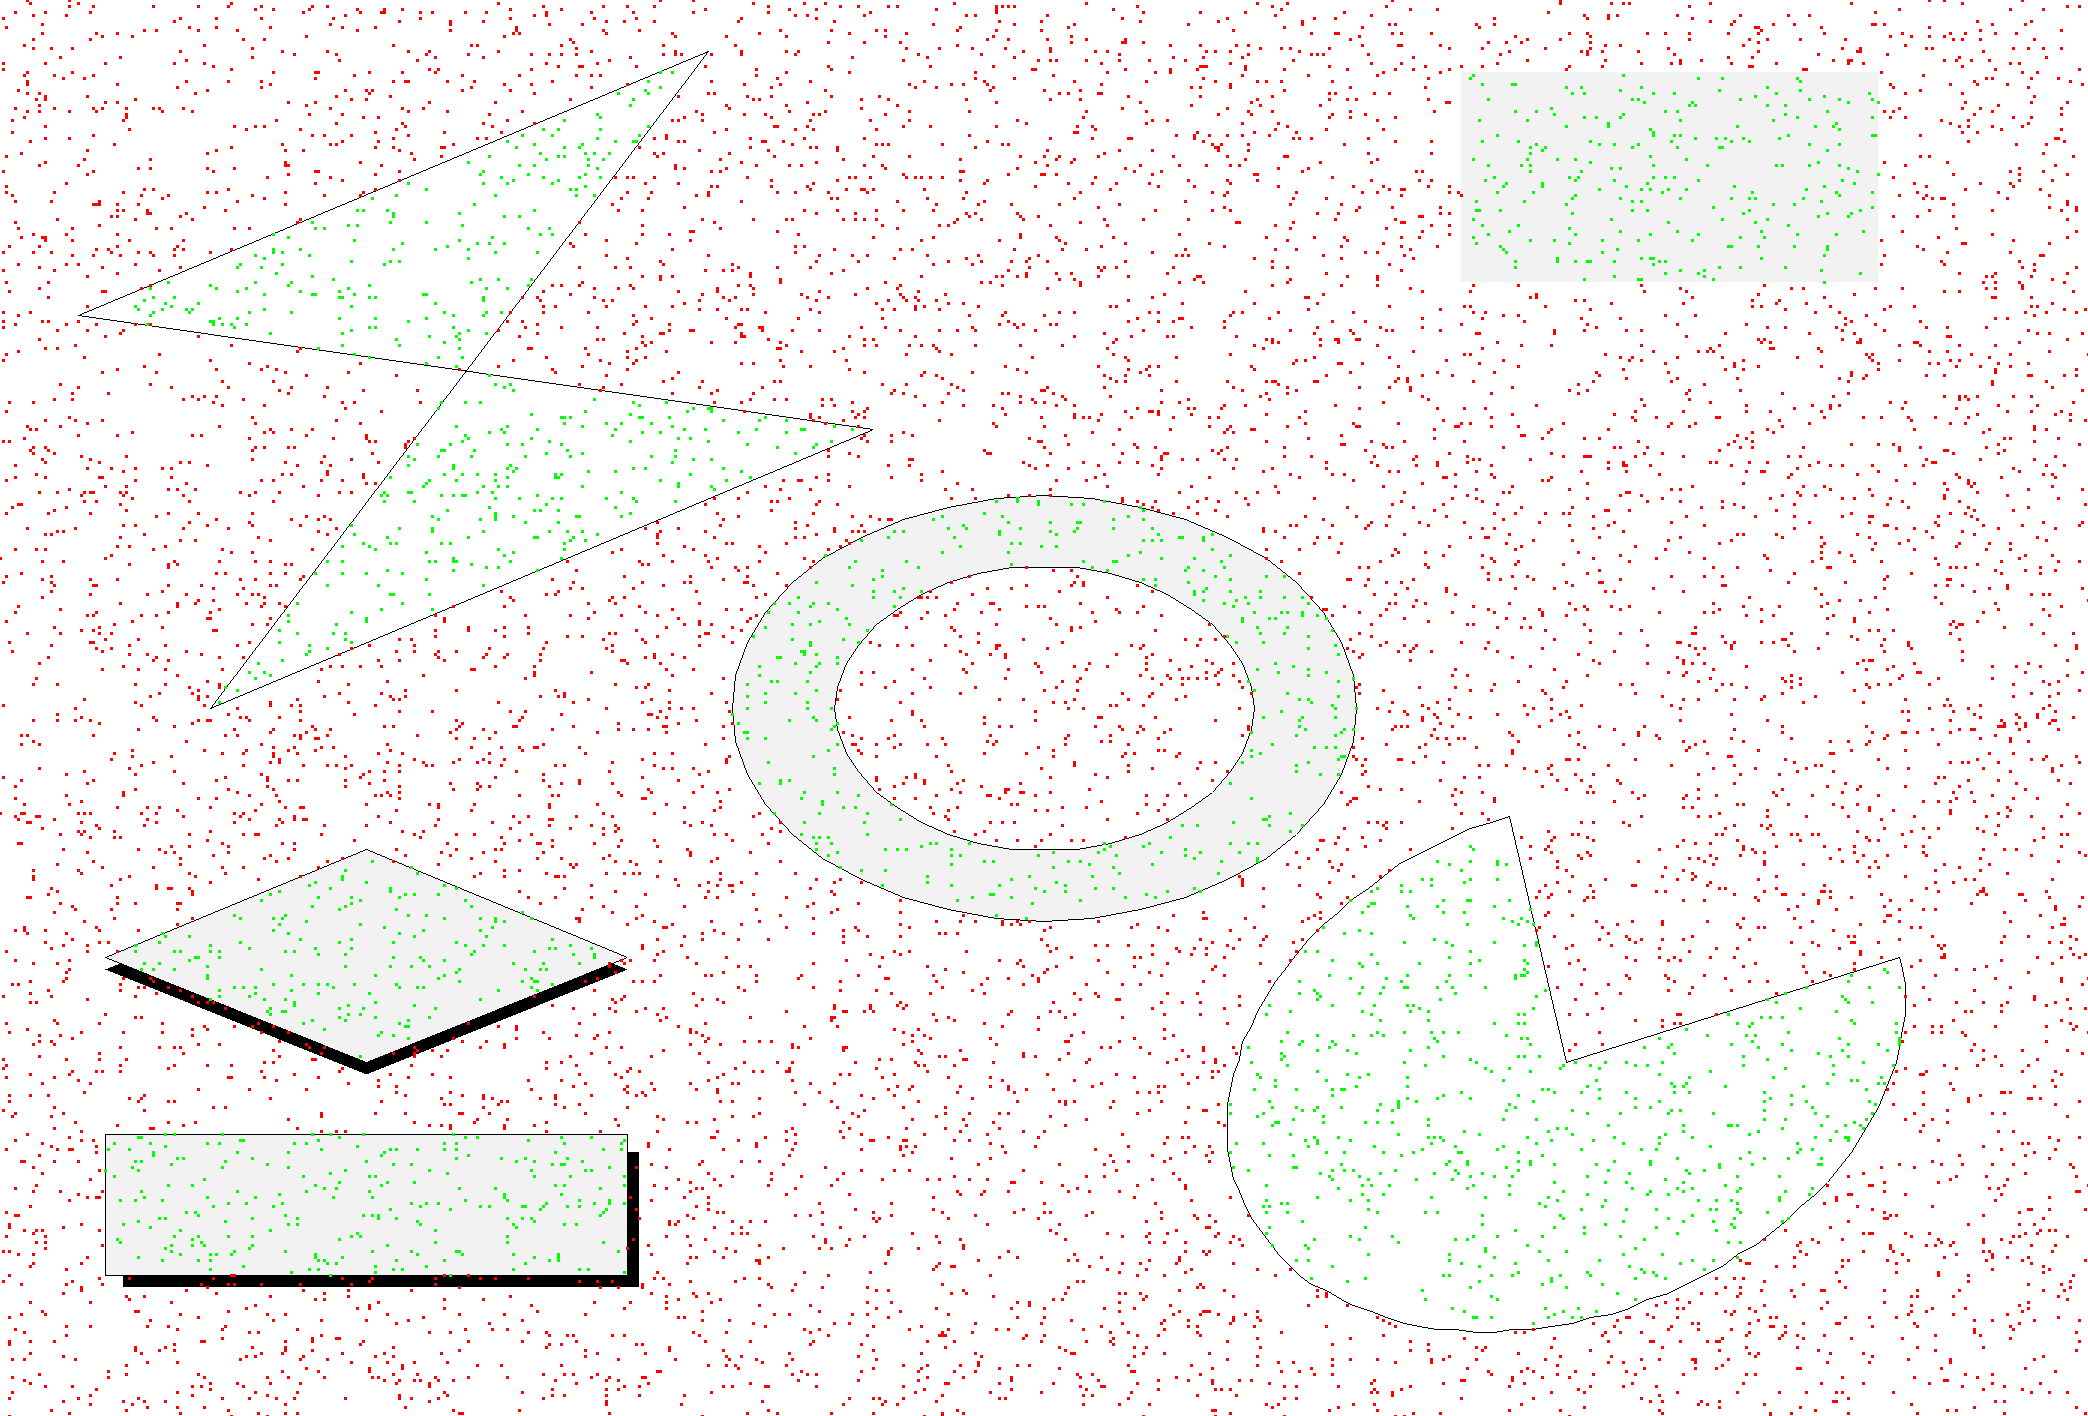 Test the IsInside methods of various graphics primitives. Test the IsInside methods of various graphics primitives. | |
| latex.C | |
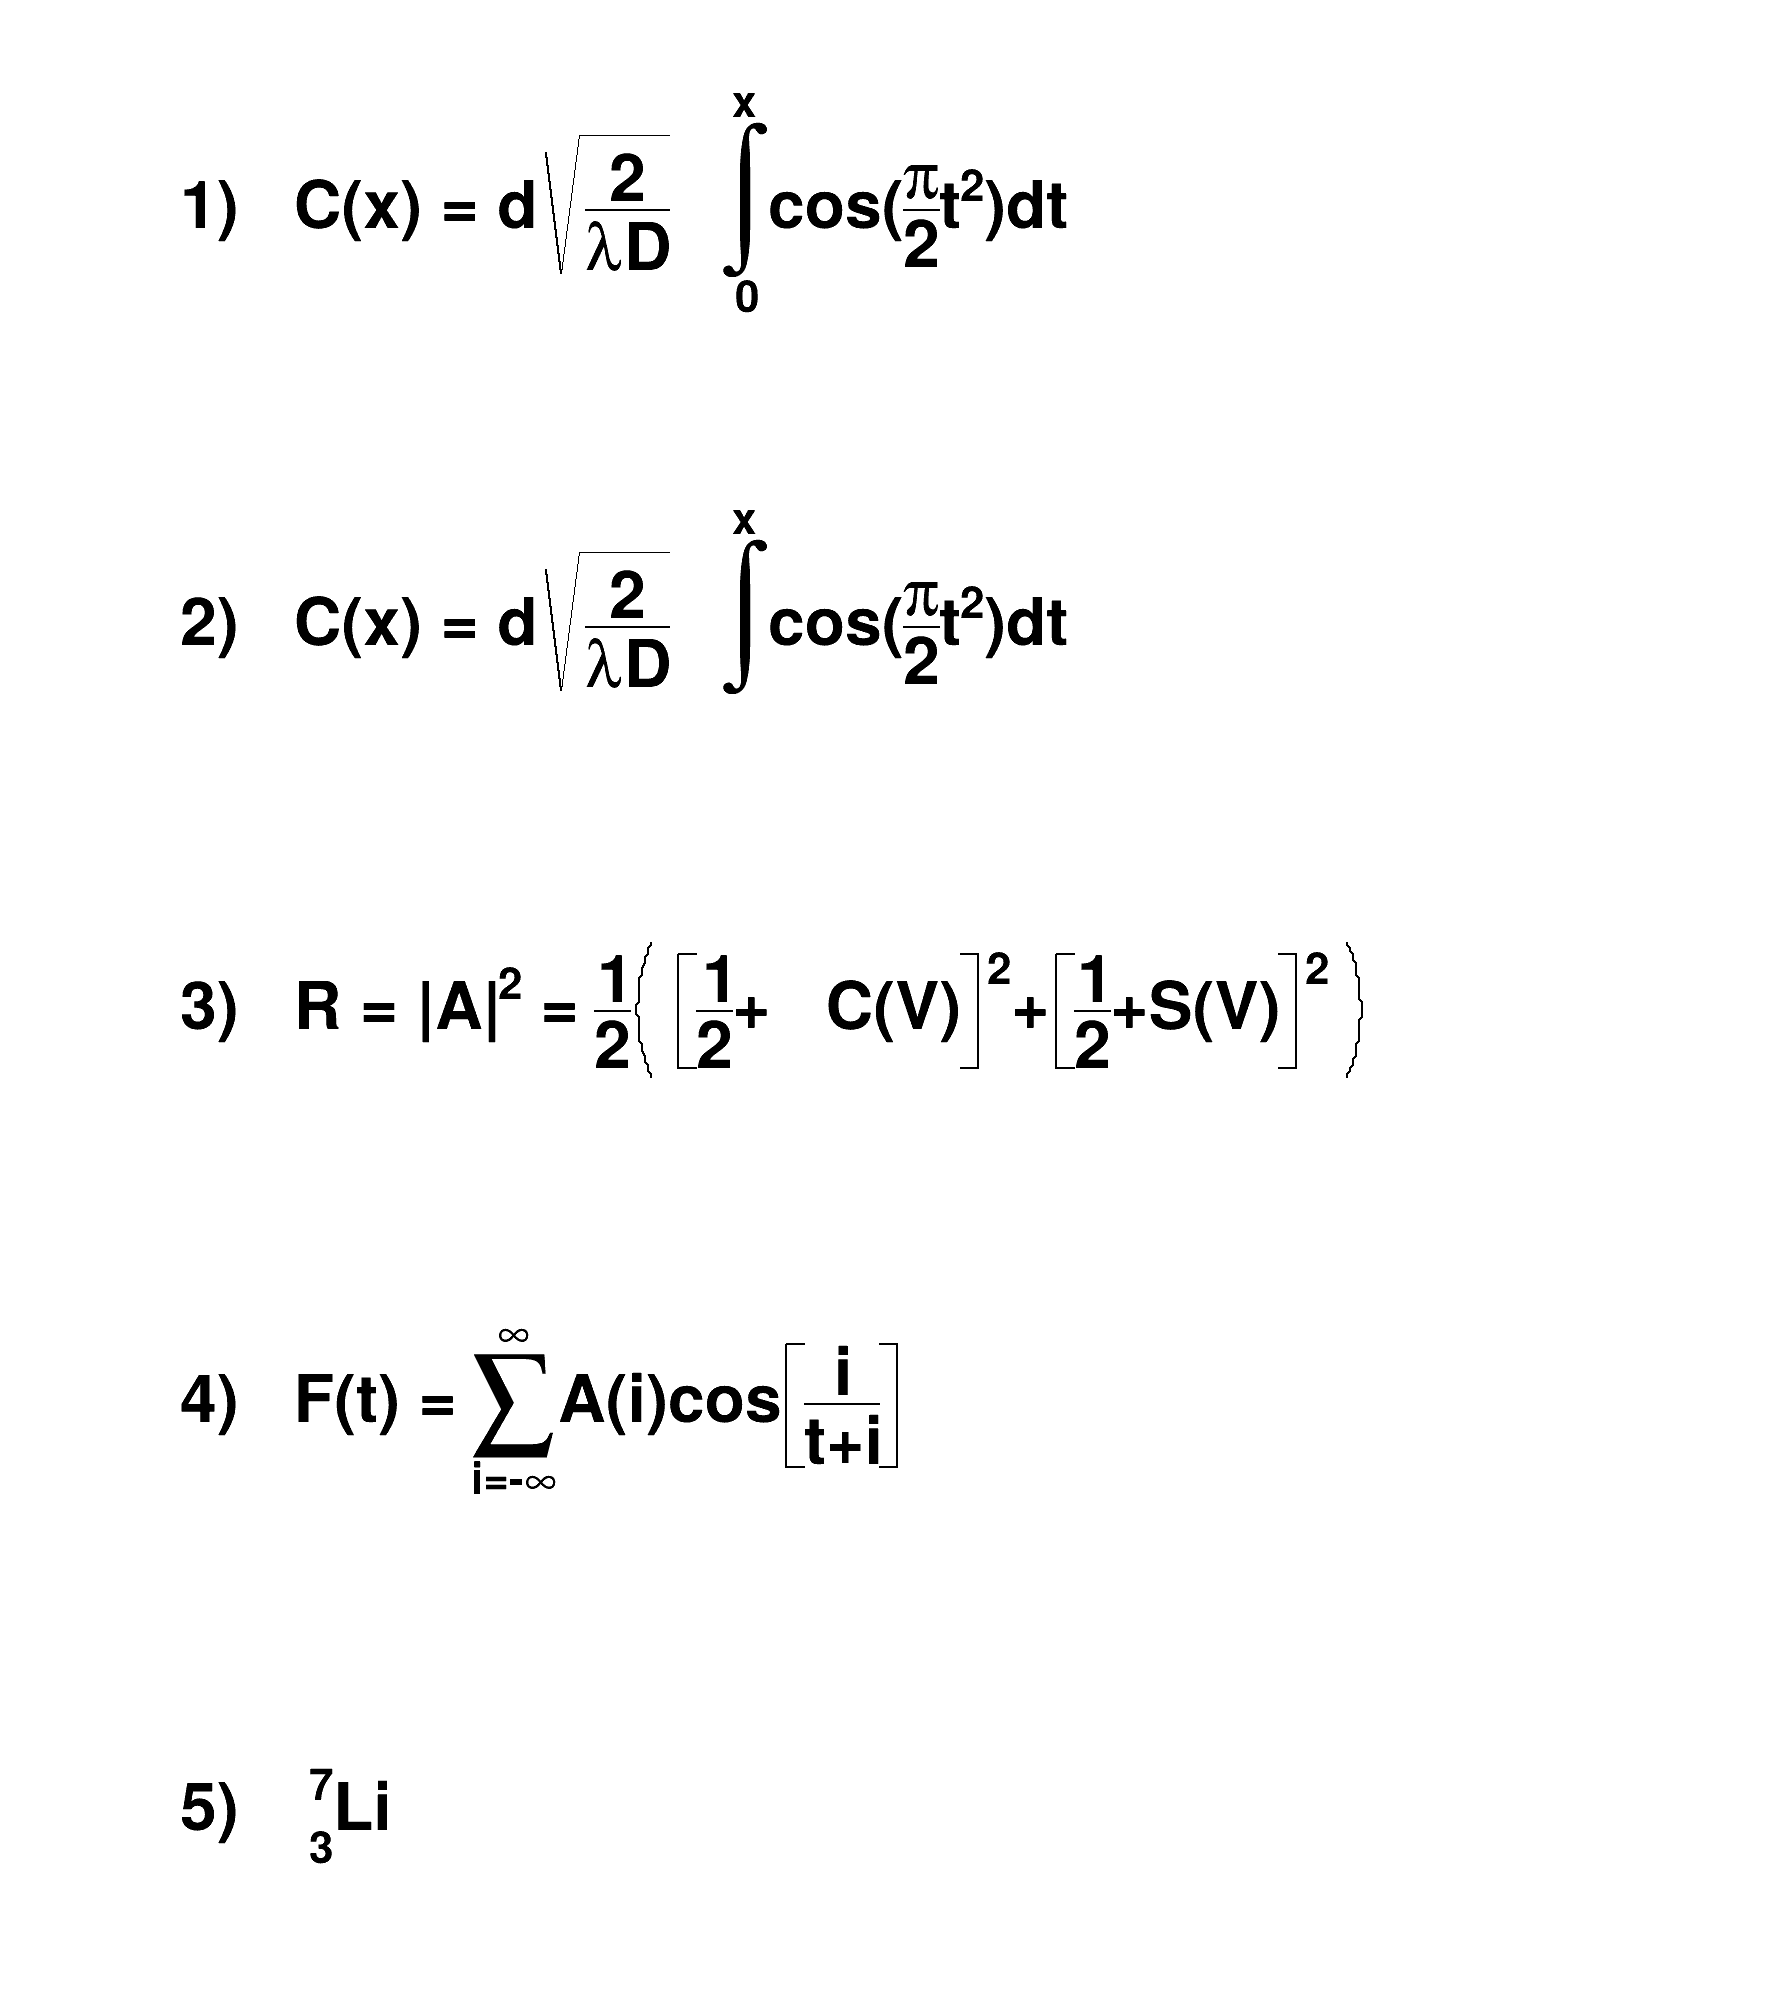 This macro draws 5 Latex-style formula in a canvas and prints the canvas as a Postscript file. This macro draws 5 Latex-style formula in a canvas and prints the canvas as a Postscript file. | |
| latex2.C | |
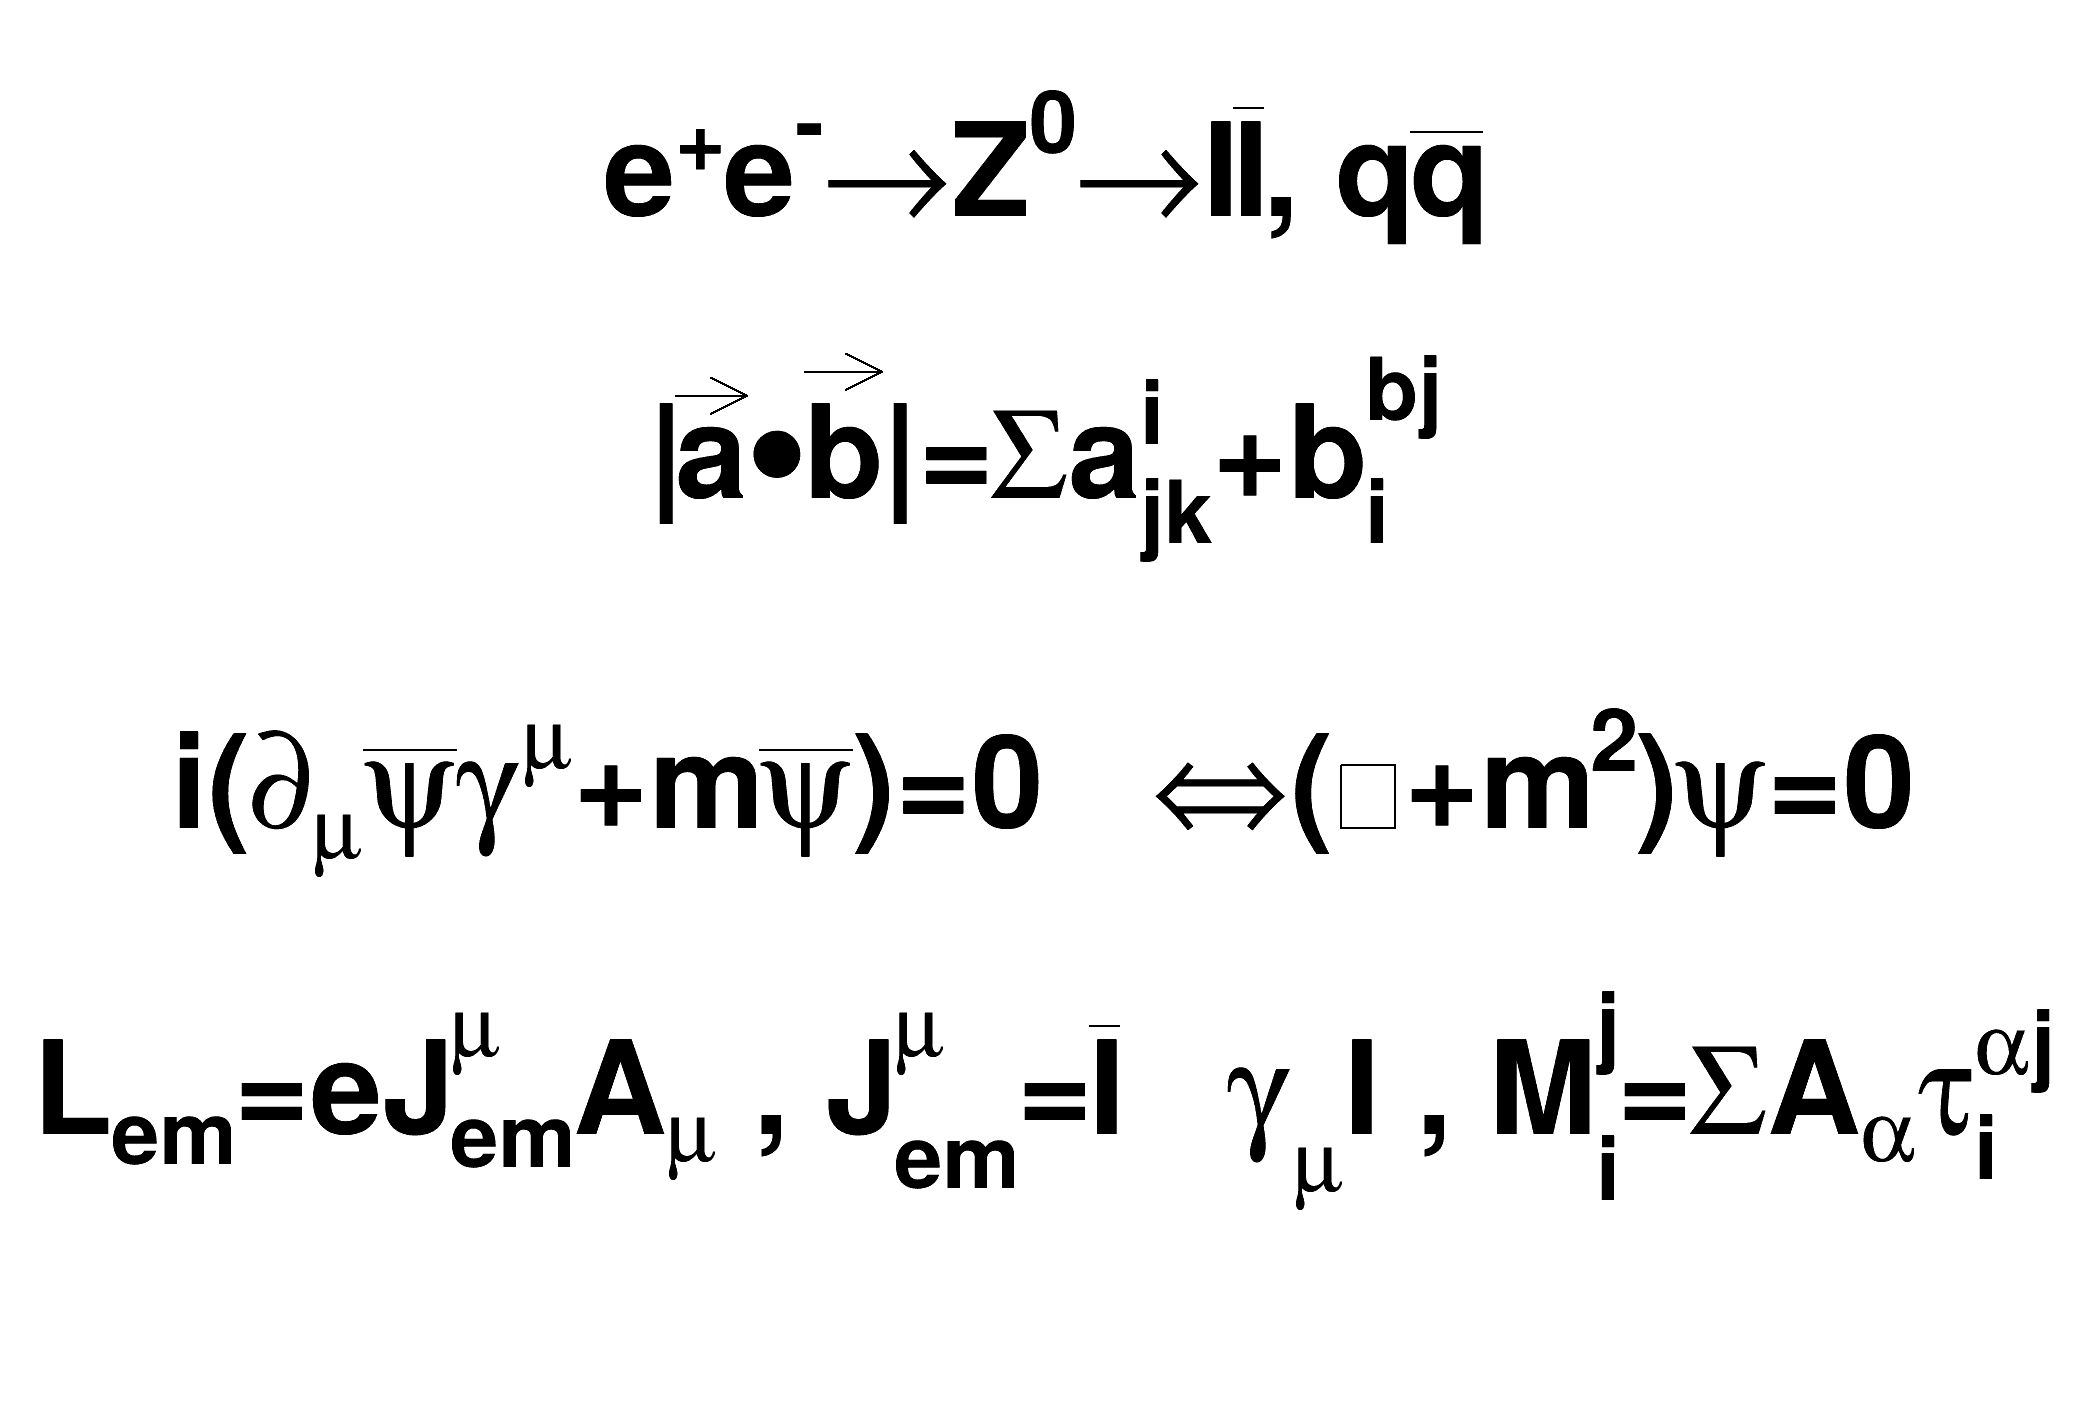 This macro draws 4 Latex-style formula in a canvas and prints the canvas as a Postscript file. This macro draws 4 Latex-style formula in a canvas and prints the canvas as a Postscript file. | |
| latex3.C | |
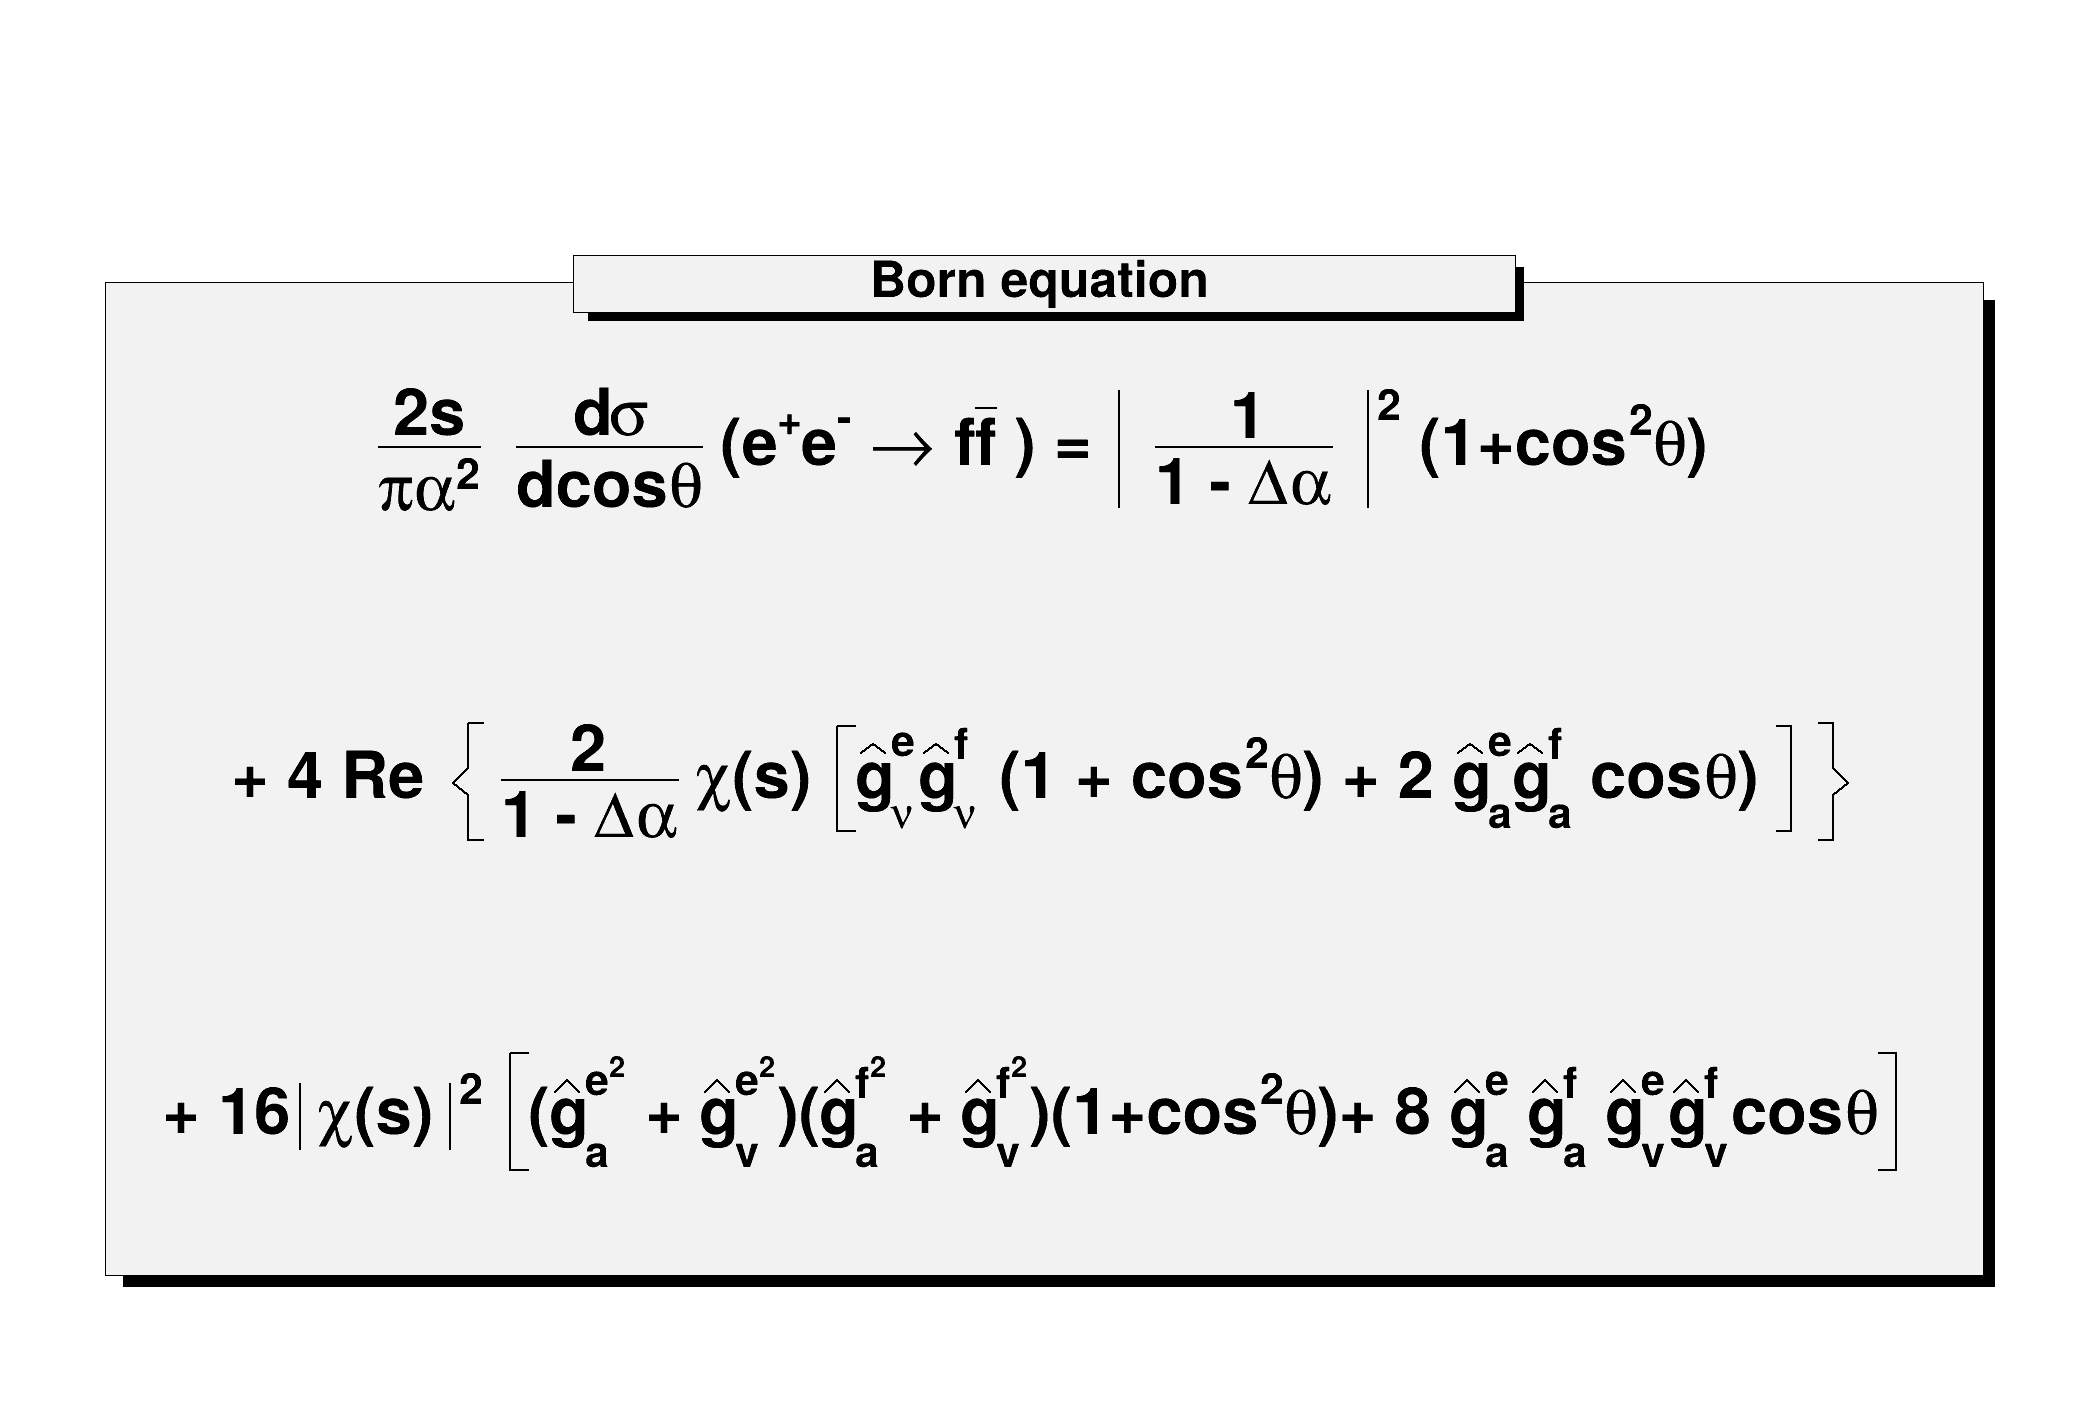 Example illustrating a TPaveText with Latex inside. Example illustrating a TPaveText with Latex inside. | |
| latex4.C | |
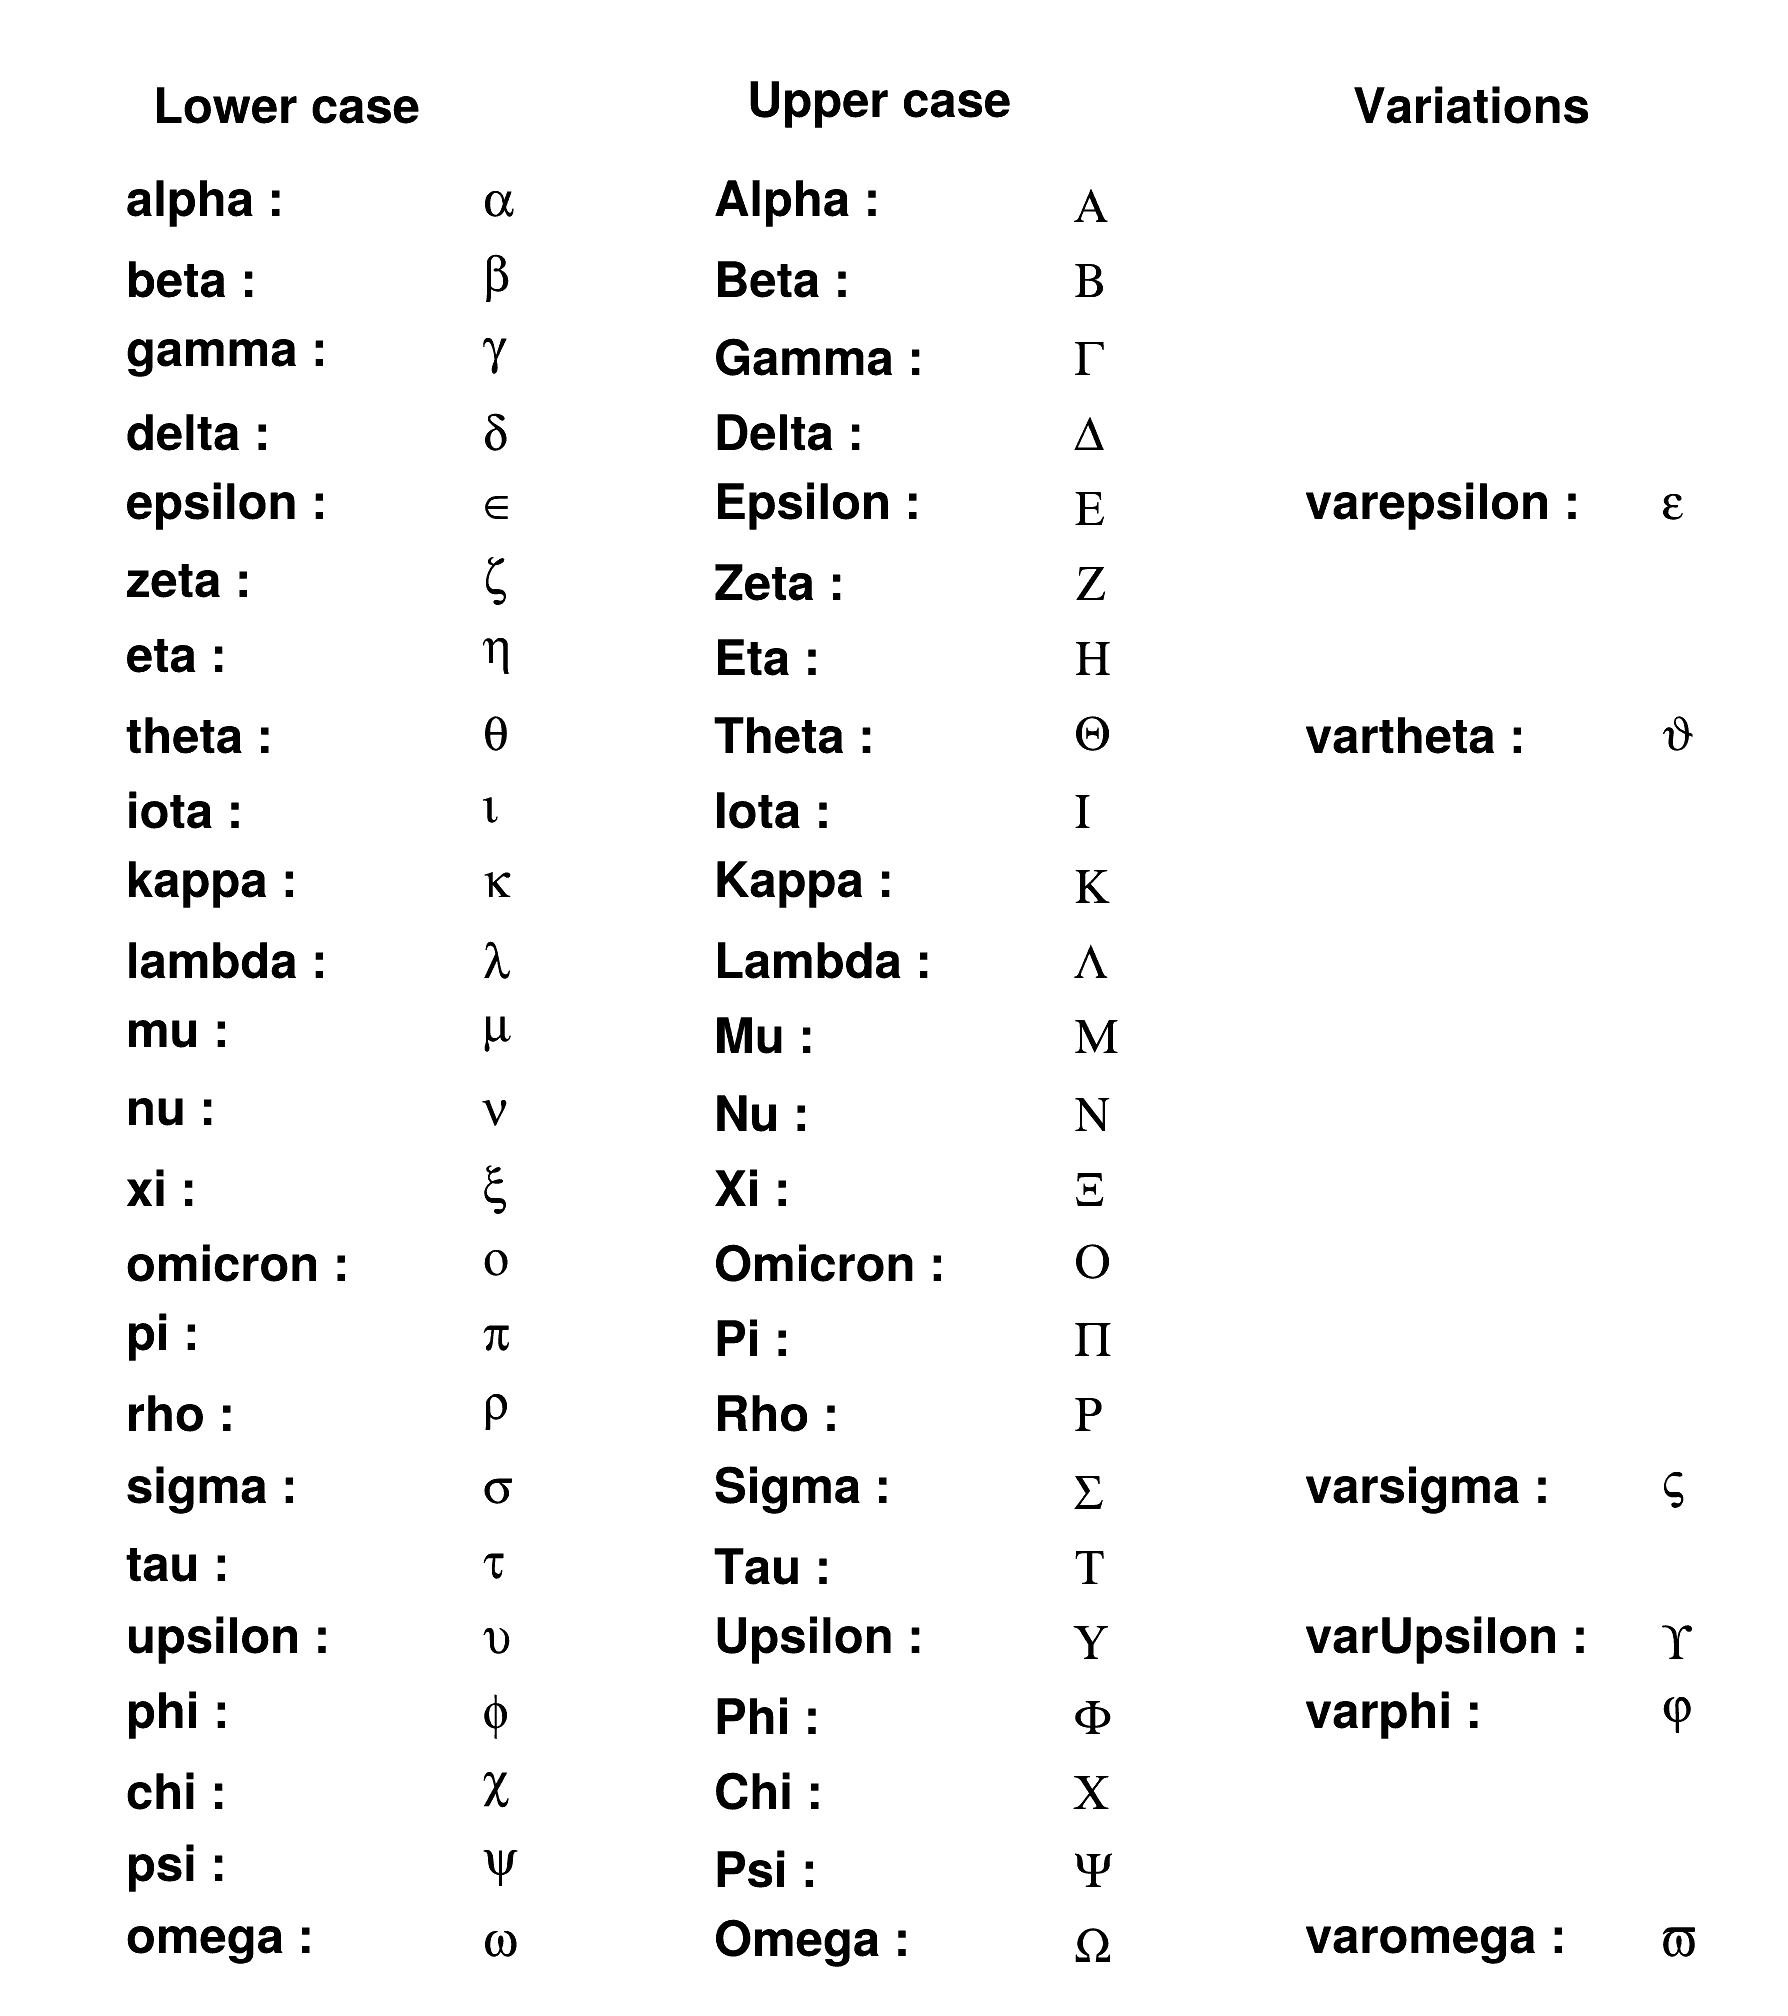 Draw the Greek letters as a table and save the result as GIF, PS, PDF and SVG files. Draw the Greek letters as a table and save the result as GIF, PS, PDF and SVG files. | |
| latex5.C | |
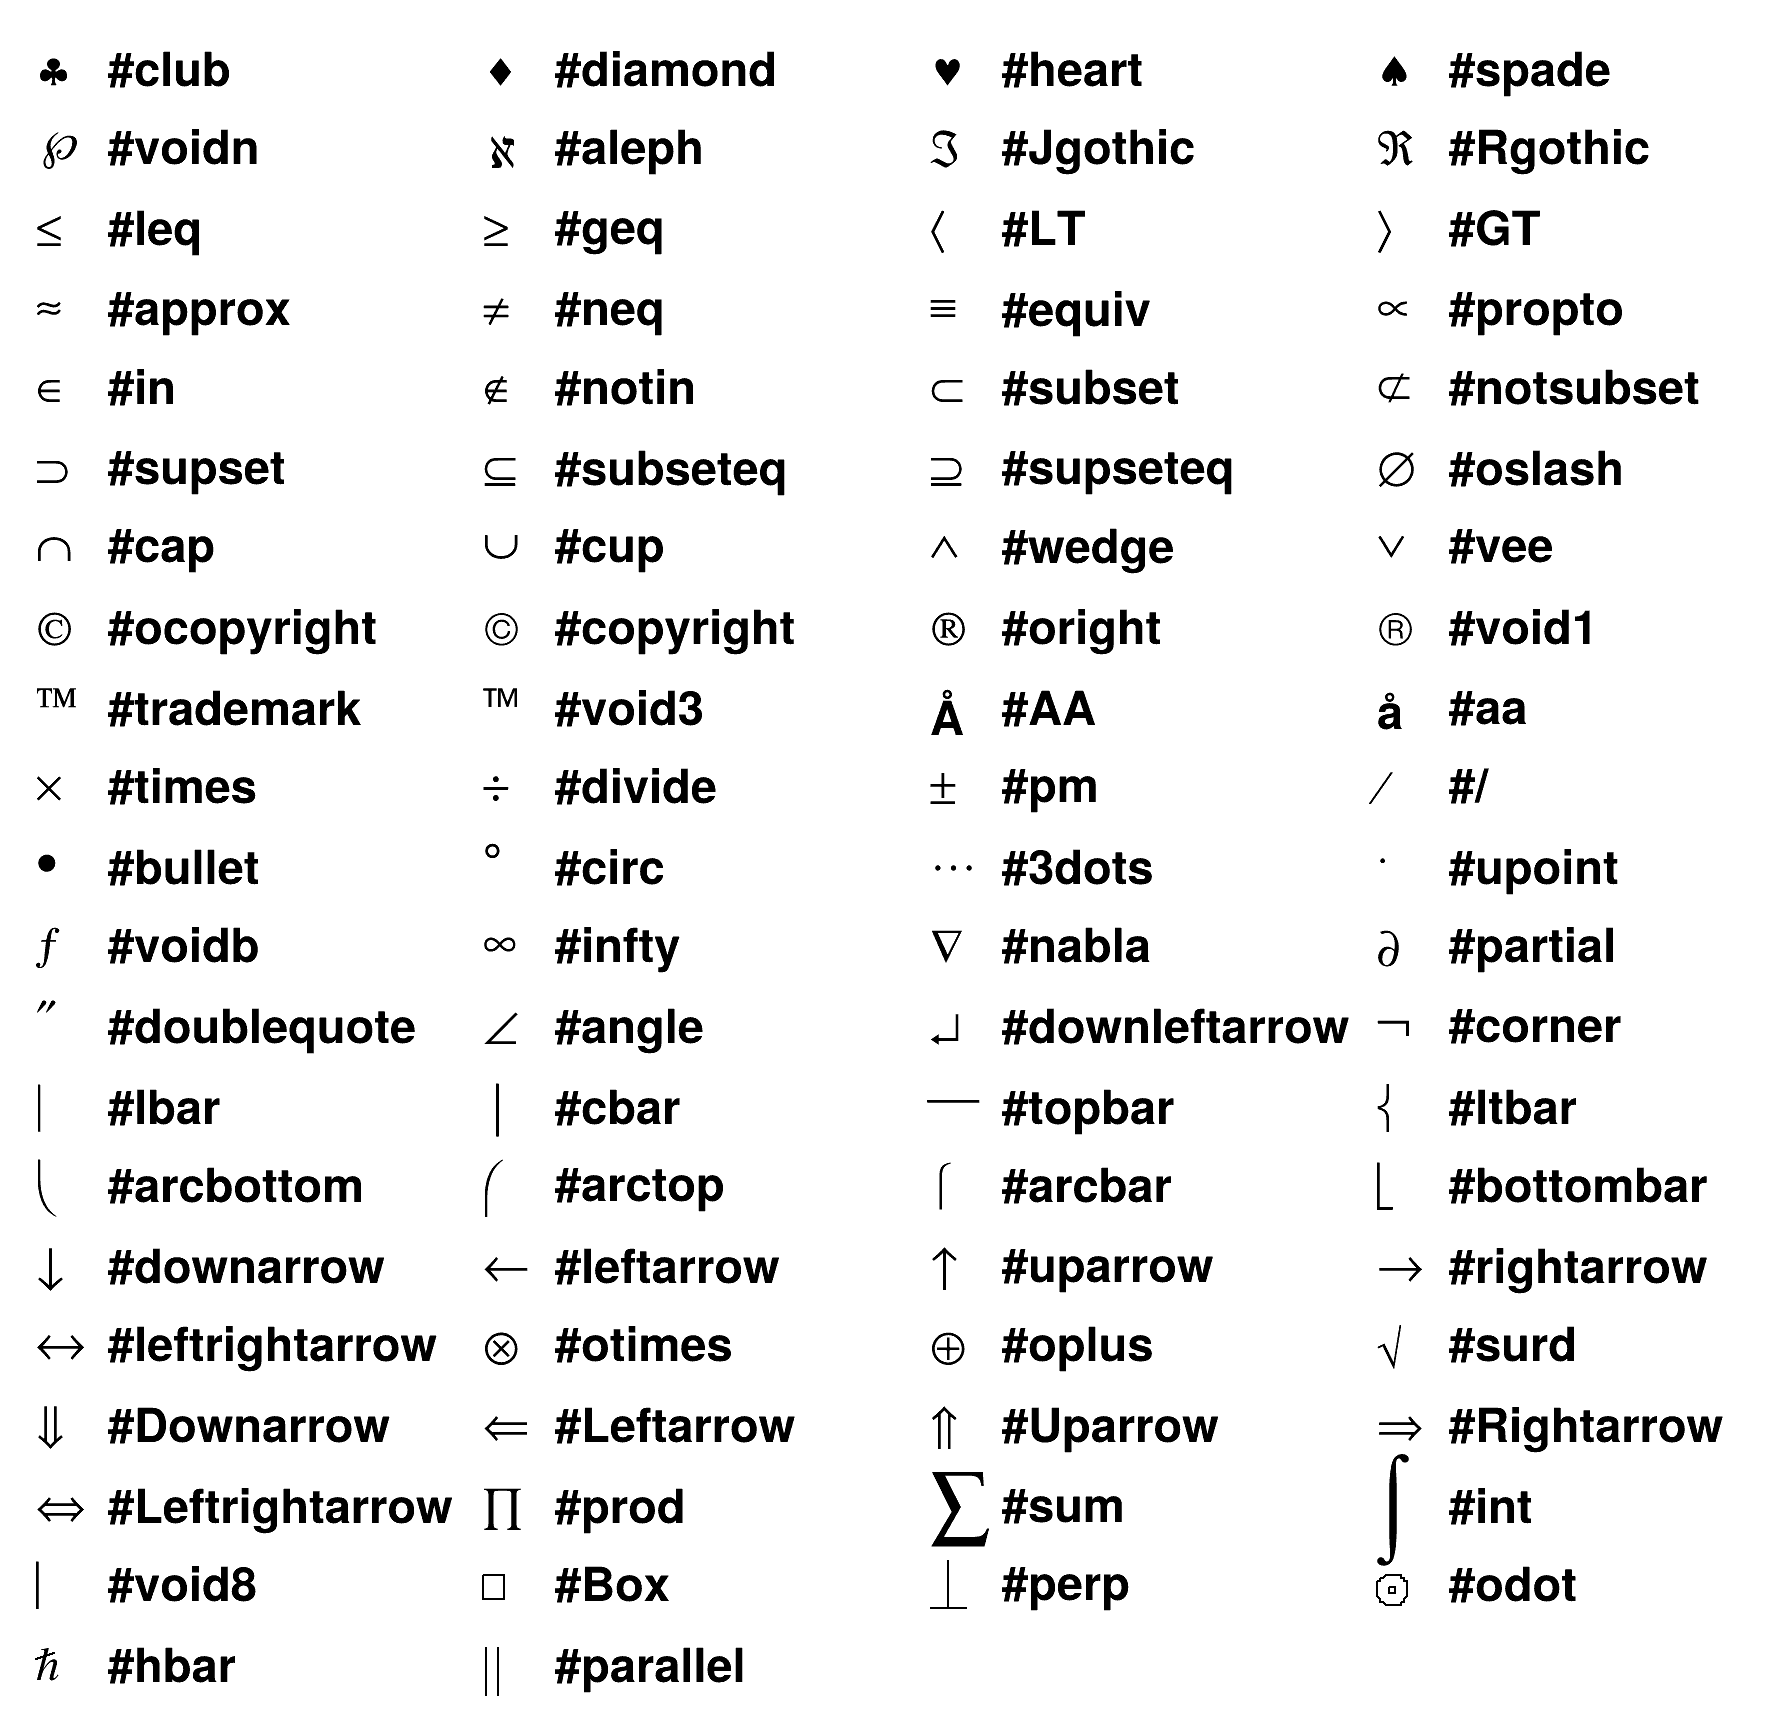 This draws the Mathematical Symbols letters as a table and save the result as GIF, PS, PDF and SVG files. This draws the Mathematical Symbols letters as a table and save the result as GIF, PS, PDF and SVG files. | |
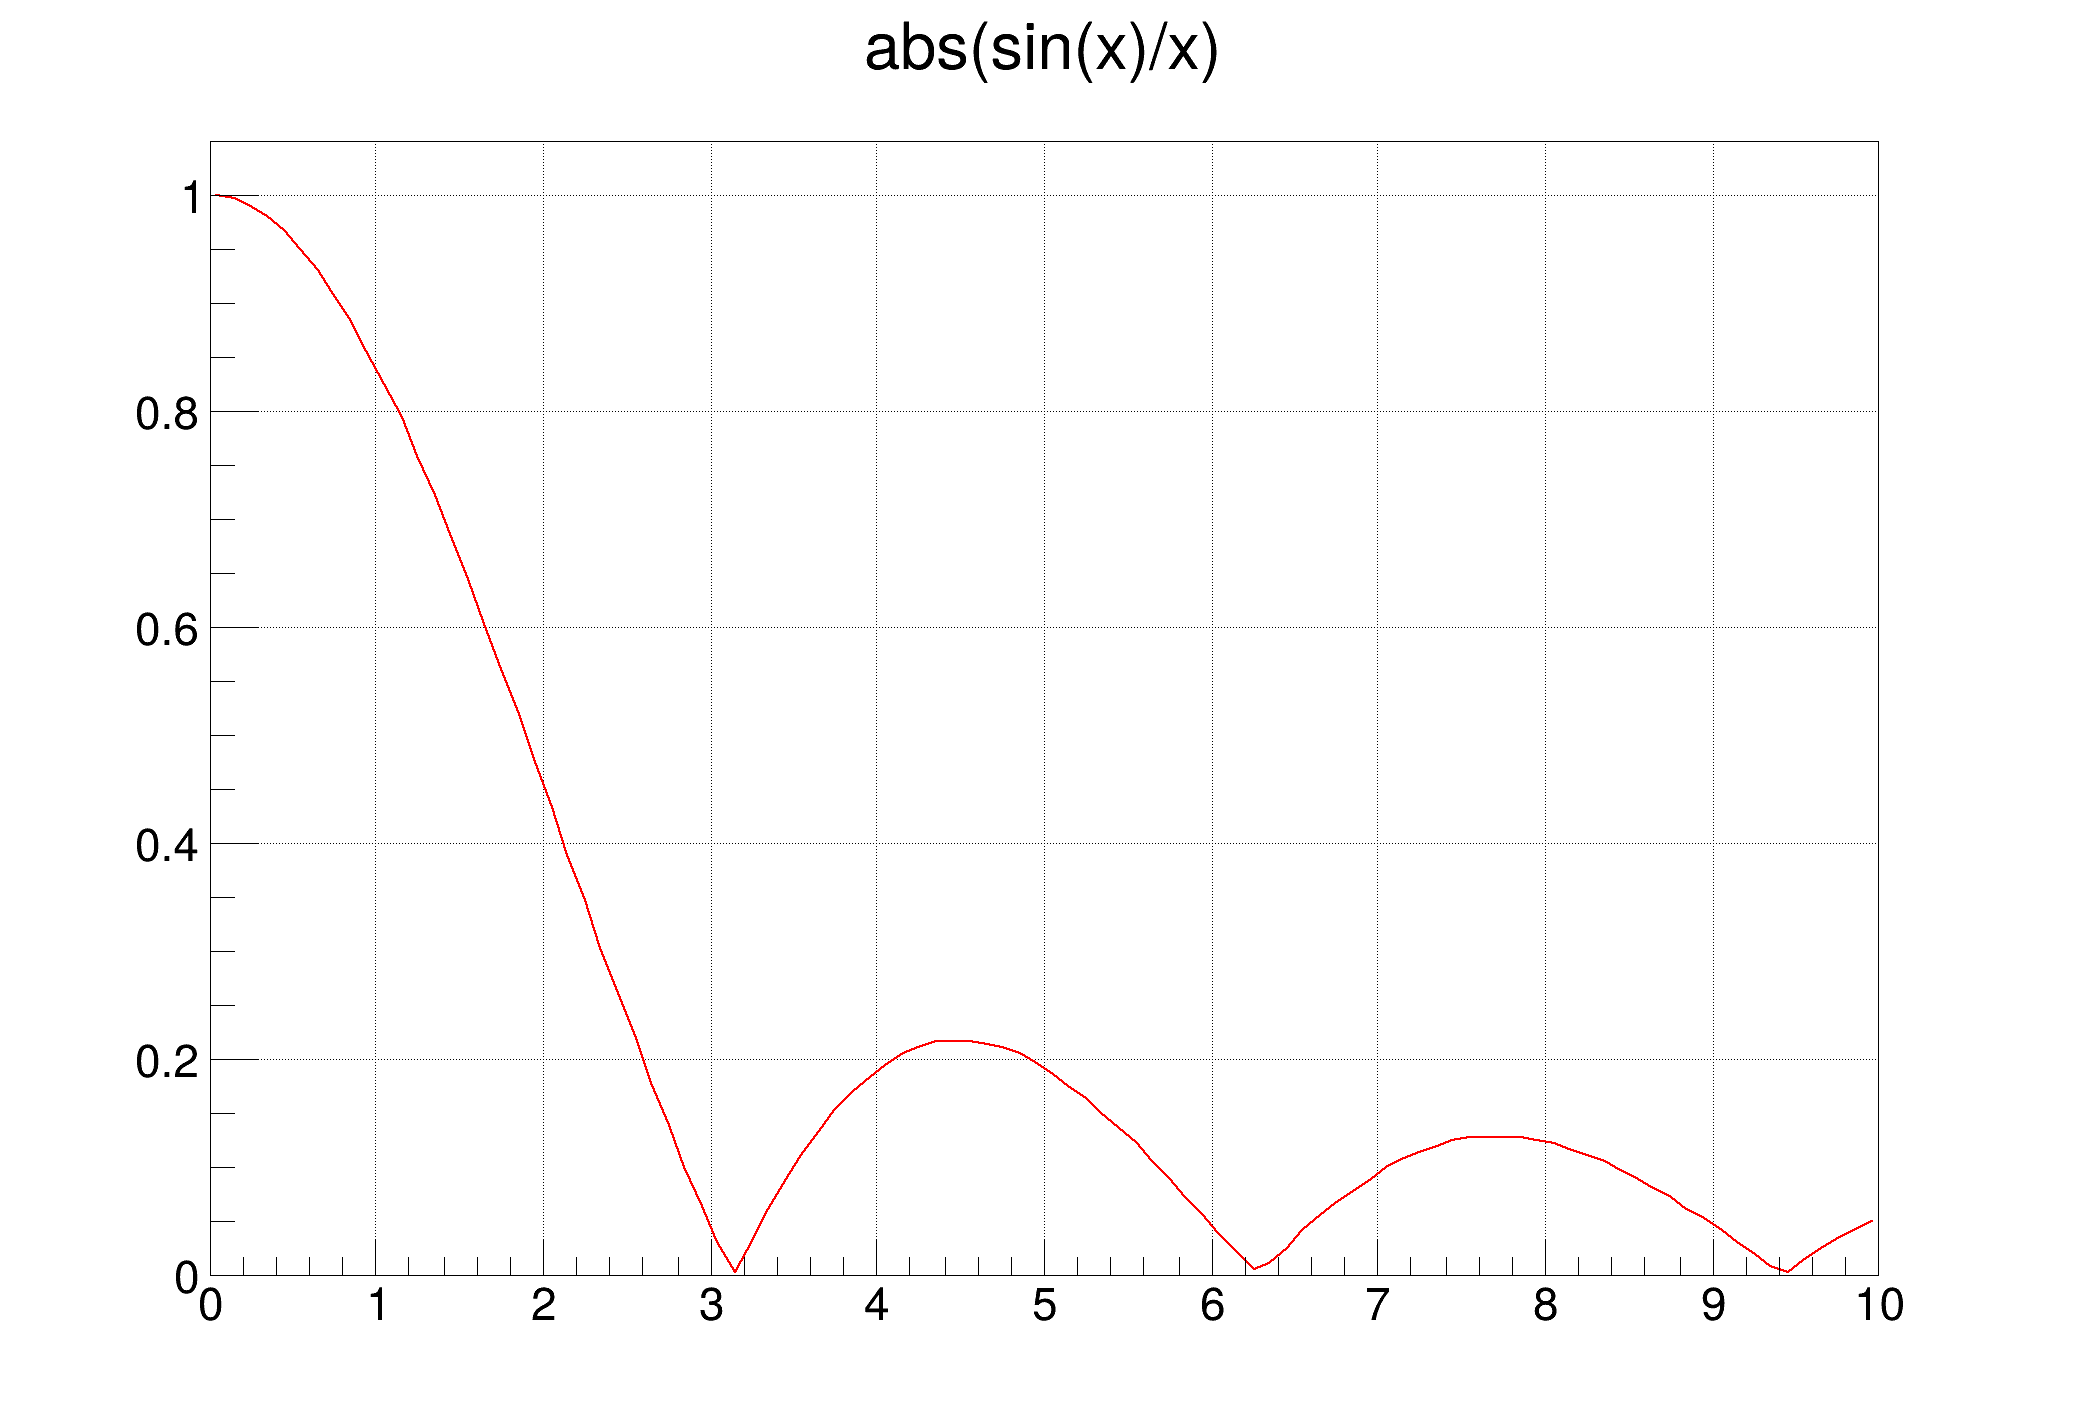
| logscales.C | |
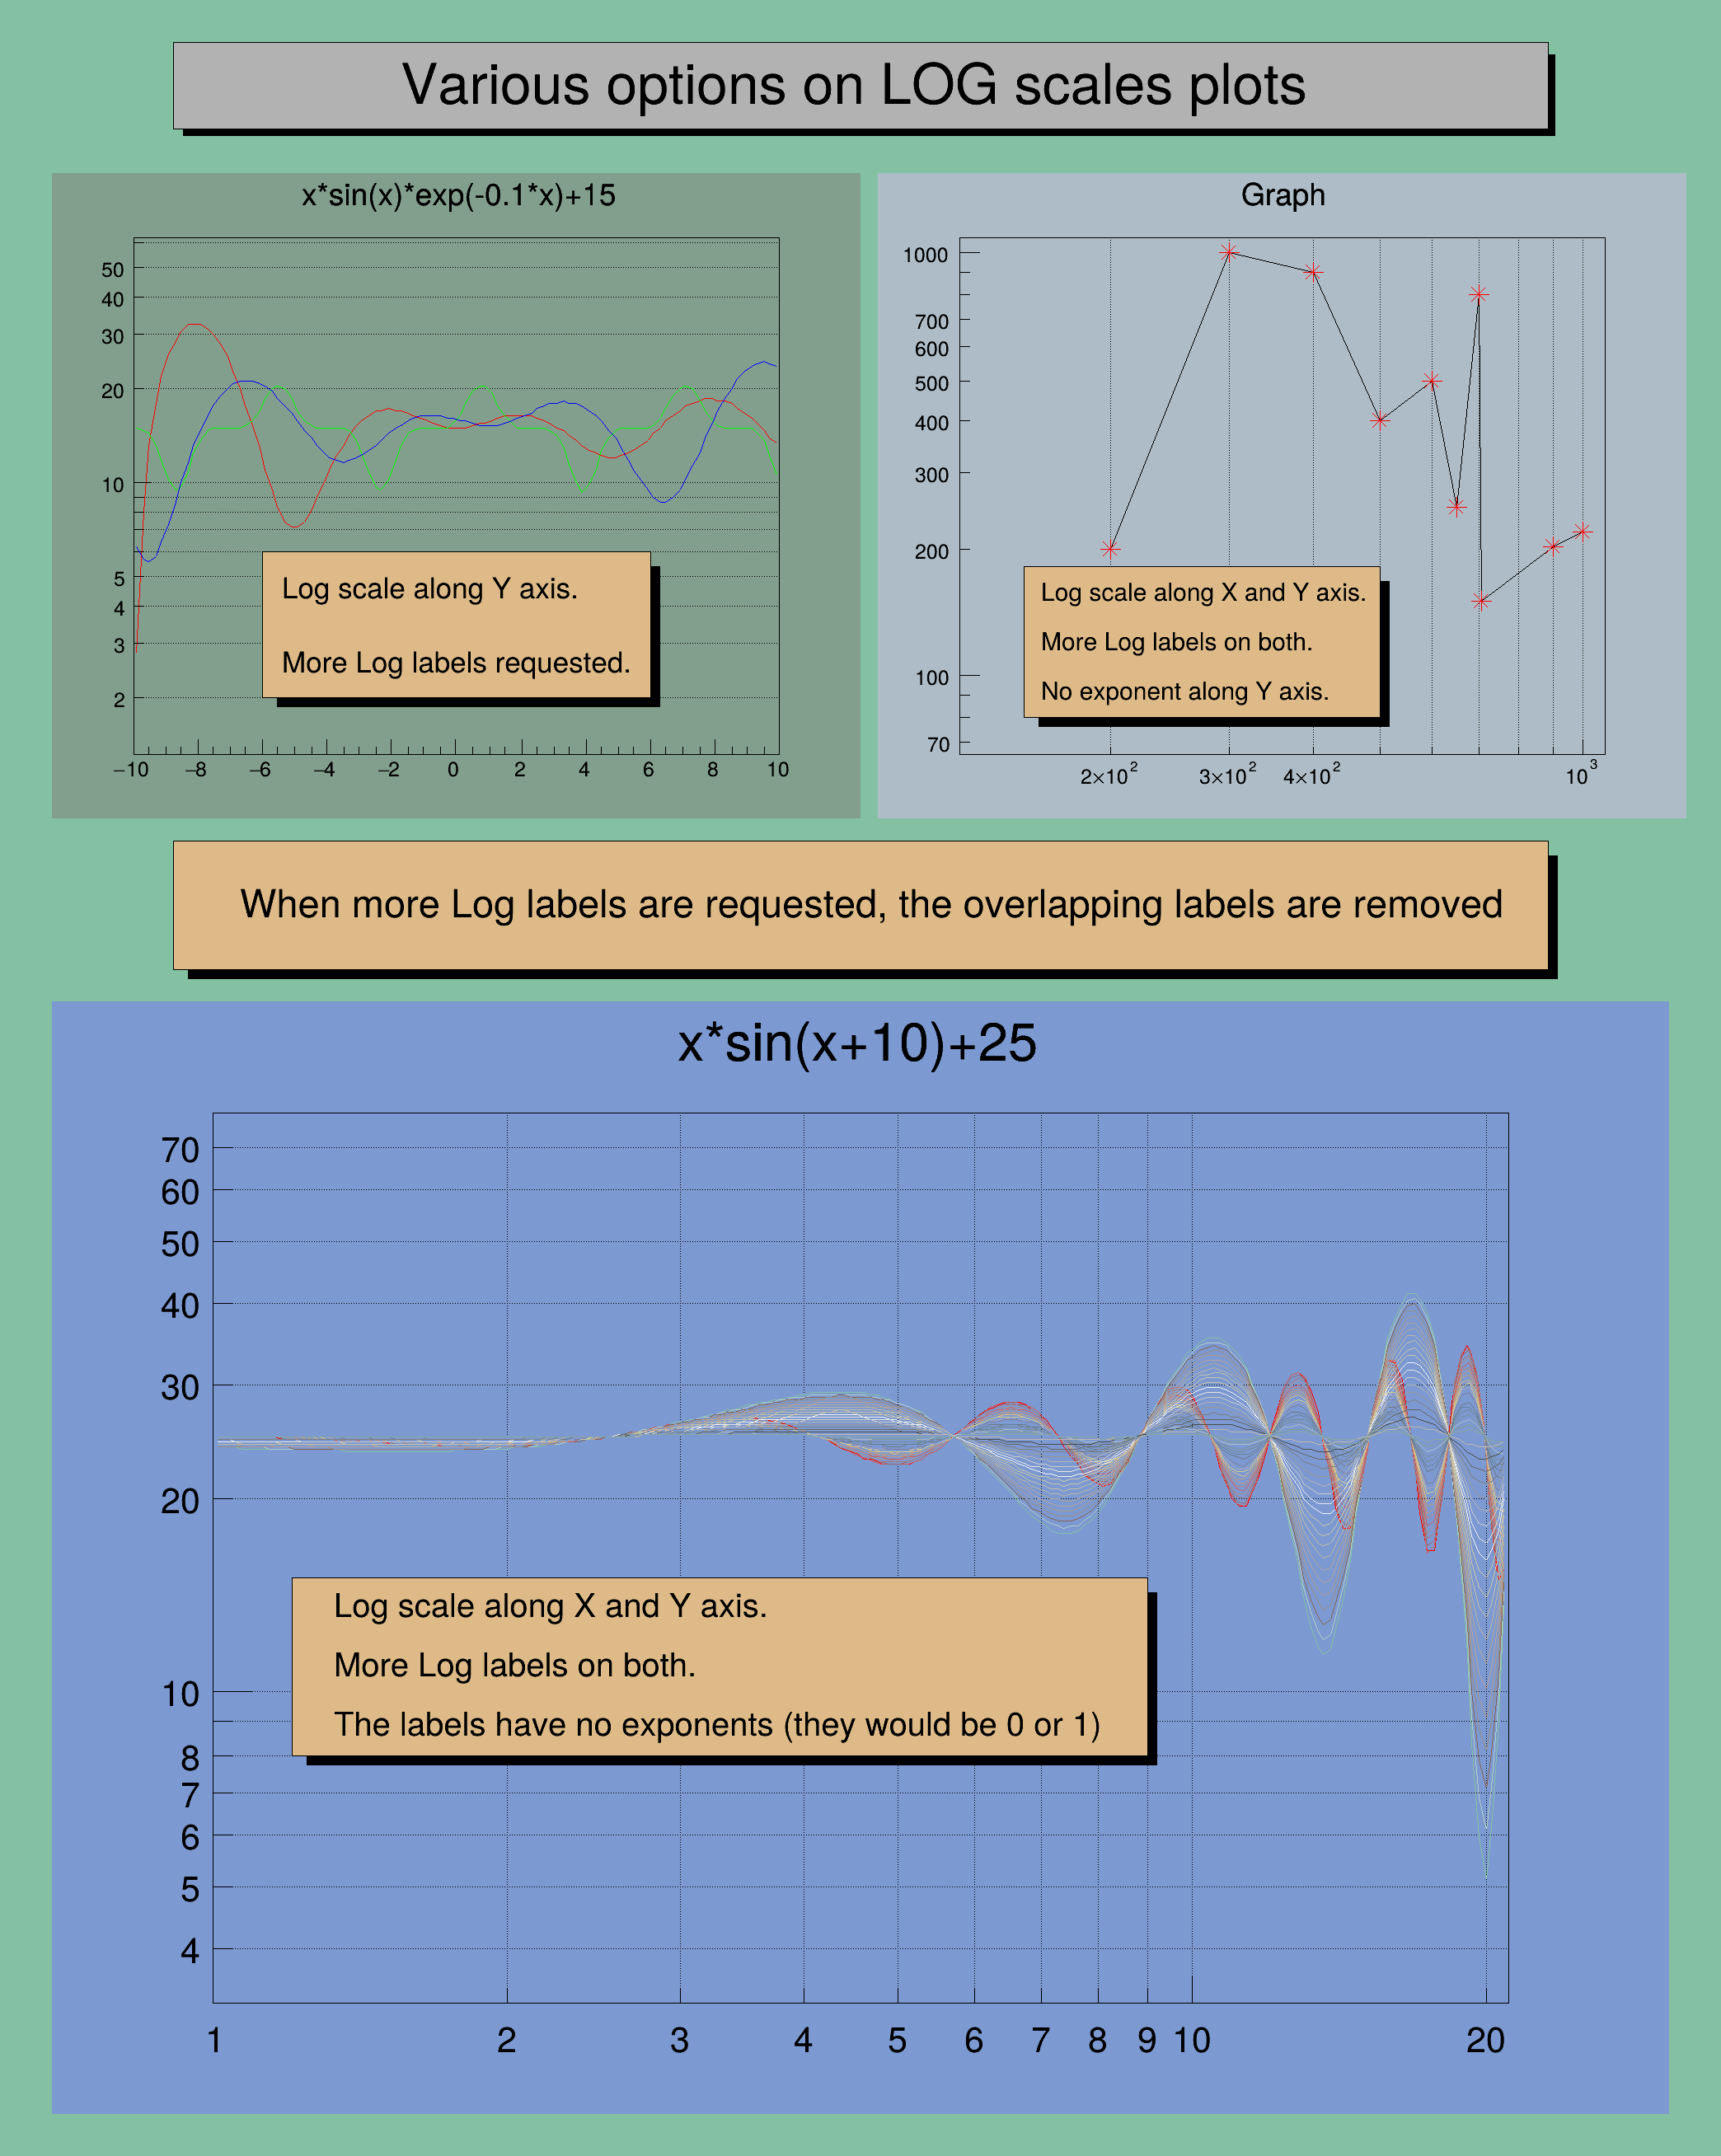 Draw parametric functions with log scales. Draw parametric functions with log scales. | |
| mandelbrot.C | |
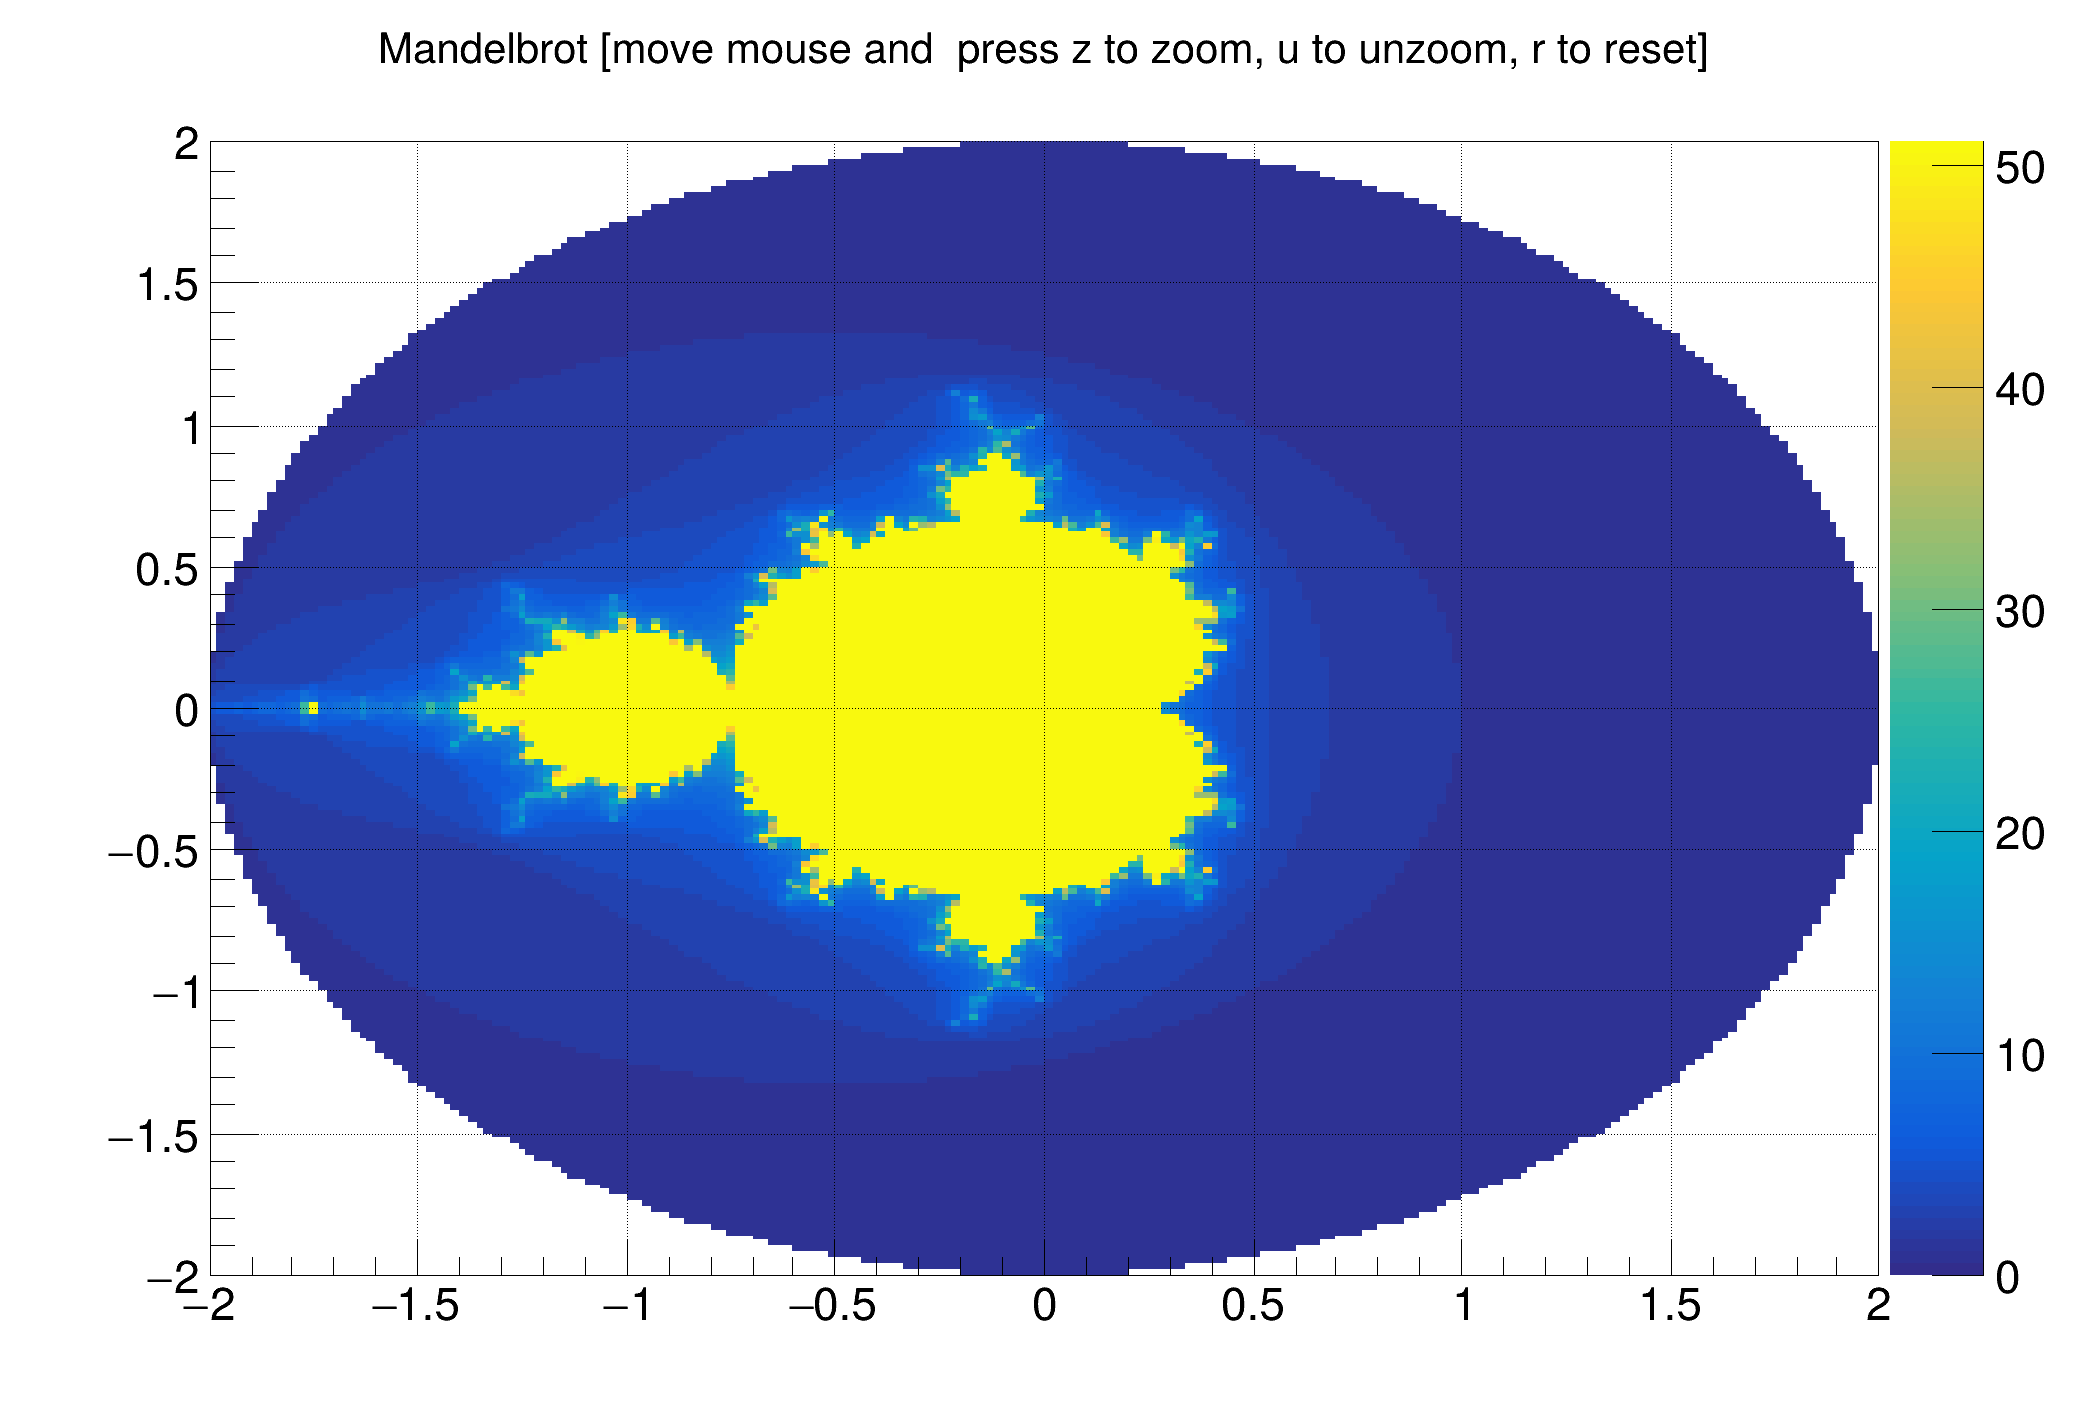 Using TExec to handle keyboard events and TComplex to draw the Mandelbrot set. Using TExec to handle keyboard events and TComplex to draw the Mandelbrot set. | |
| markerwarning.C | |
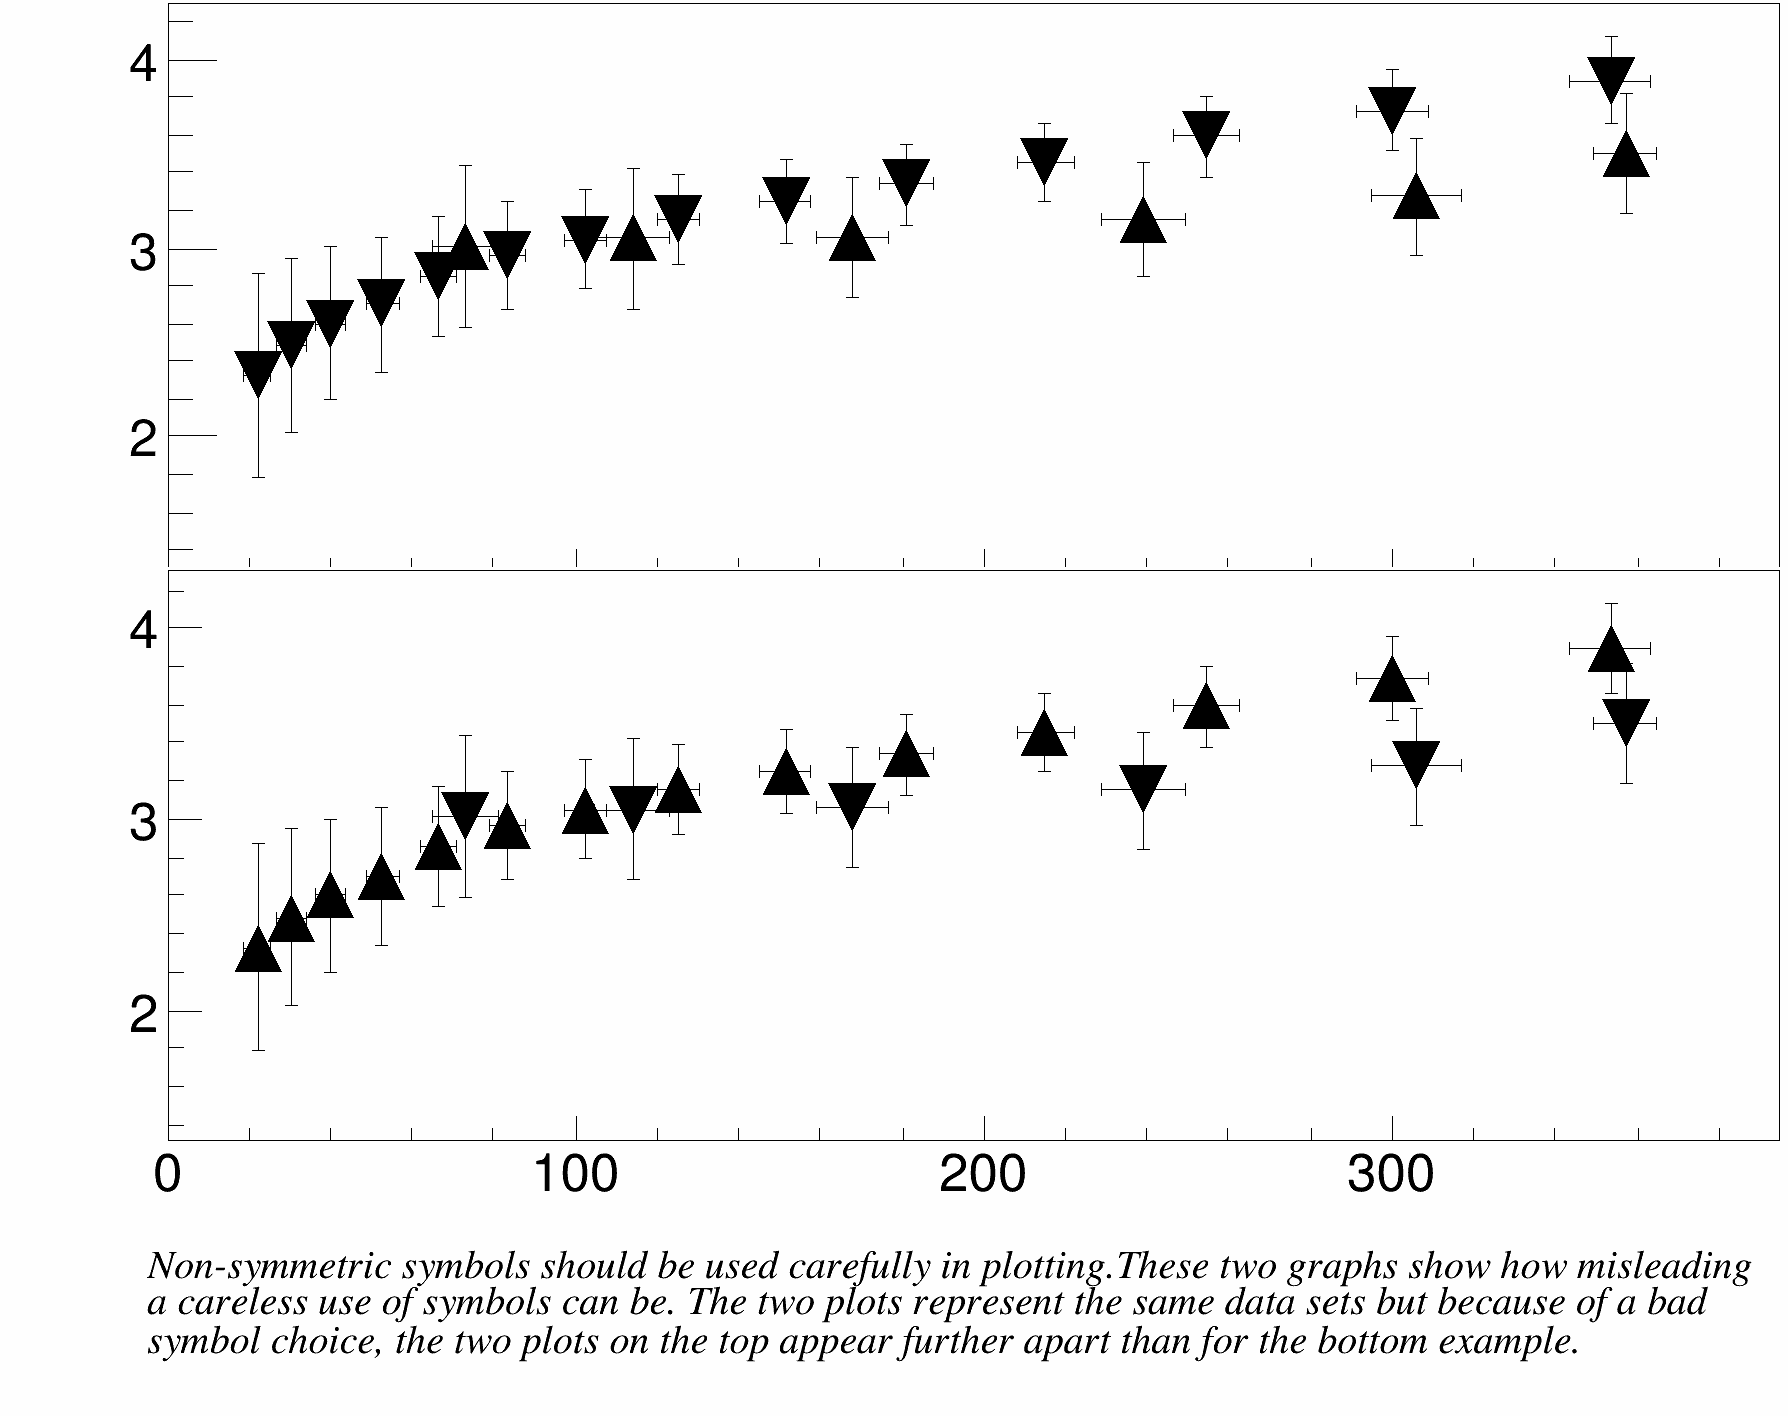 This script illustrates the danger of using asymmetric symbols. This script illustrates the danger of using asymmetric symbols. | |
| mass_spectrum.C | |
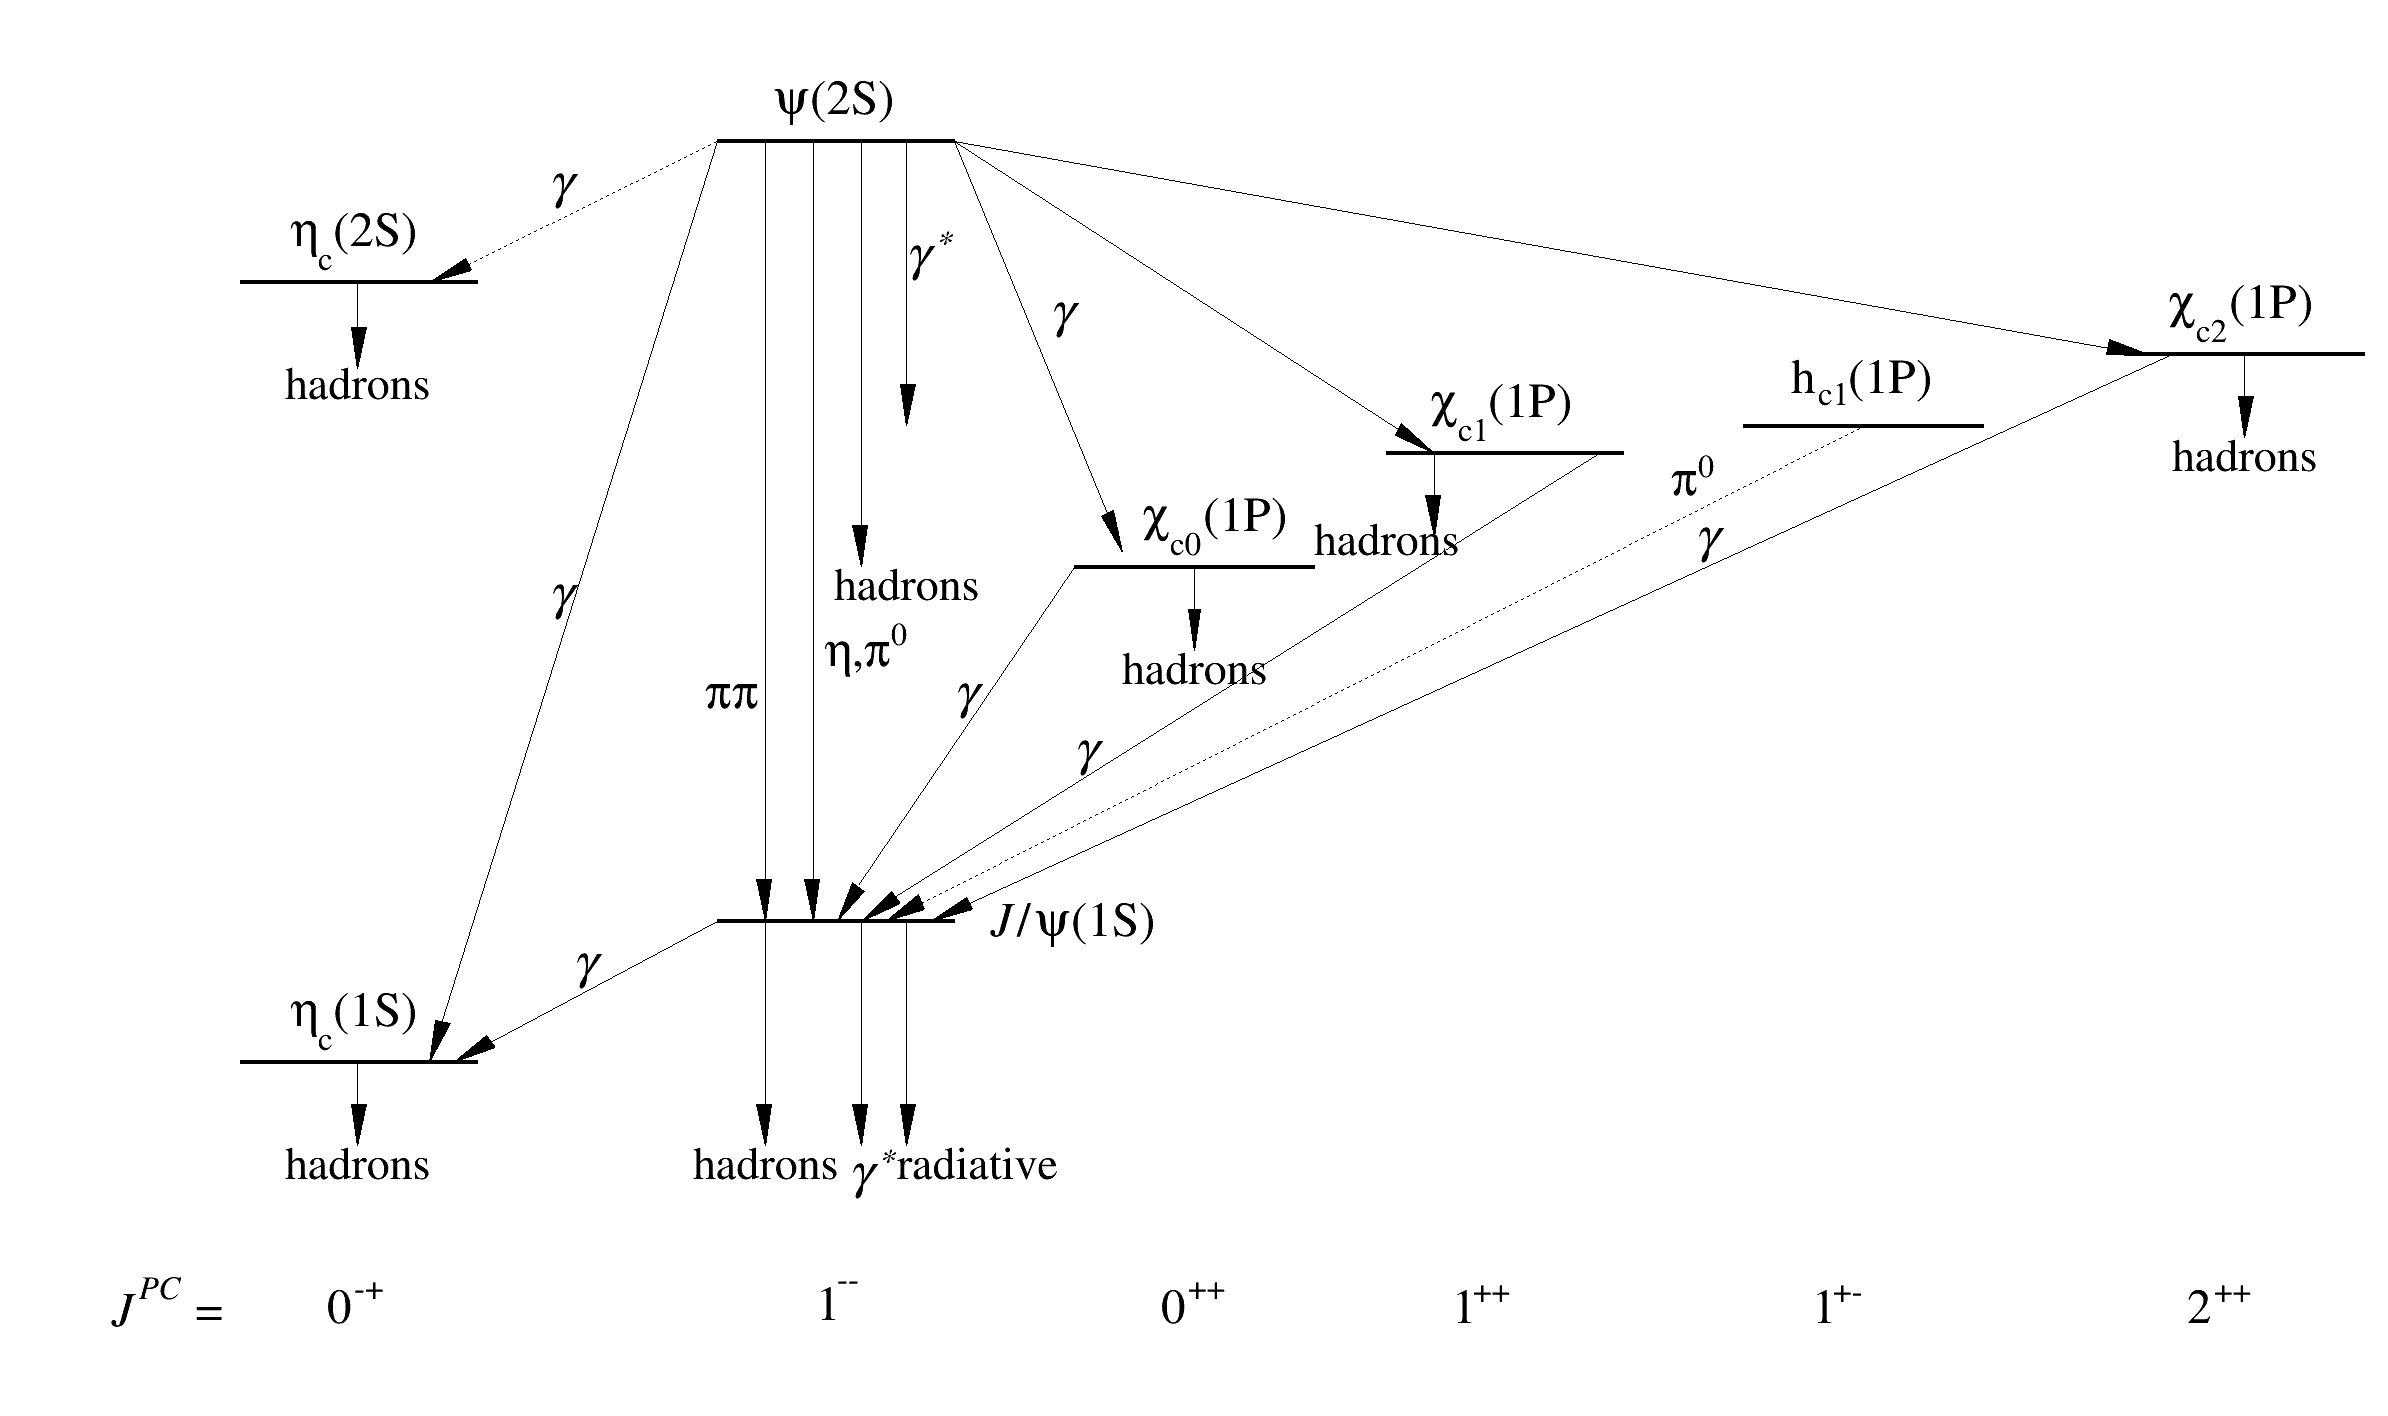 This macro makes use of some basic graphics primitives such as line, arrow and text. This macro makes use of some basic graphics primitives such as line, arrow and text. | |
| multipalette.C | |
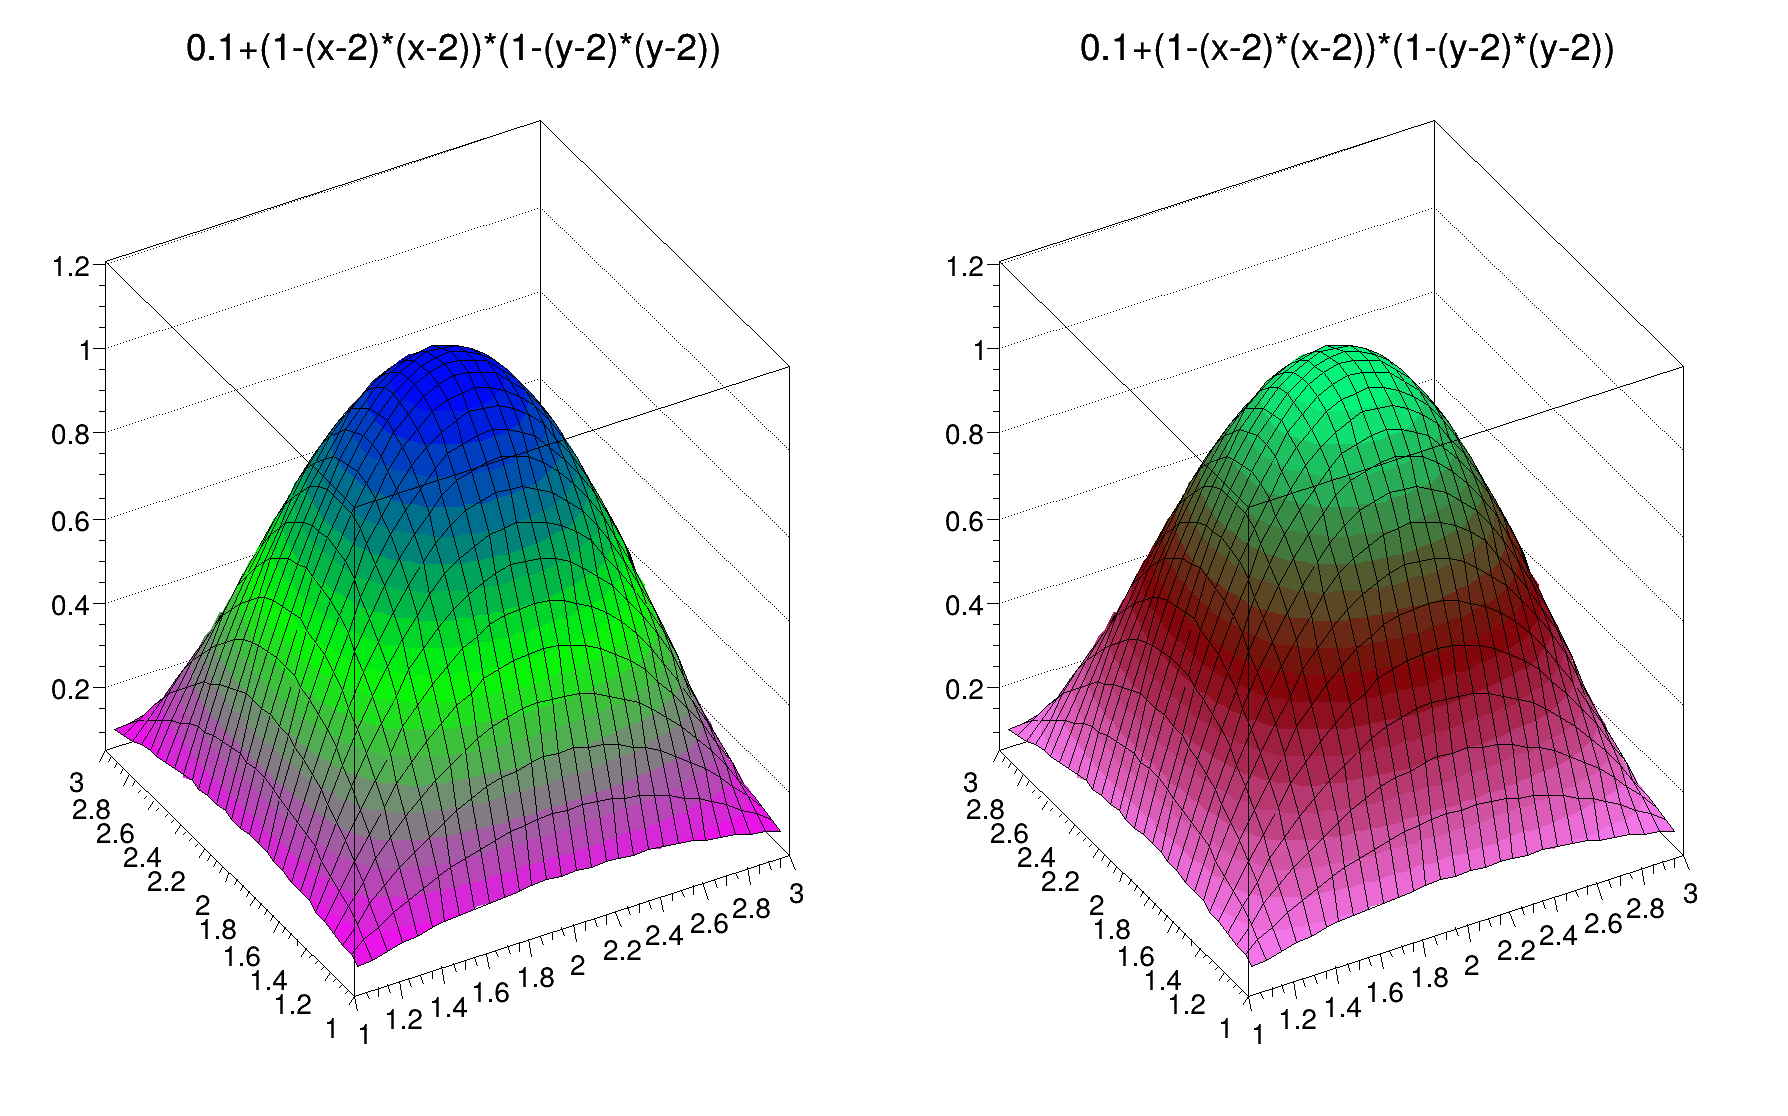 Draw color plots using different color palettes. Draw color plots using different color palettes. | |
| palettes.C | |
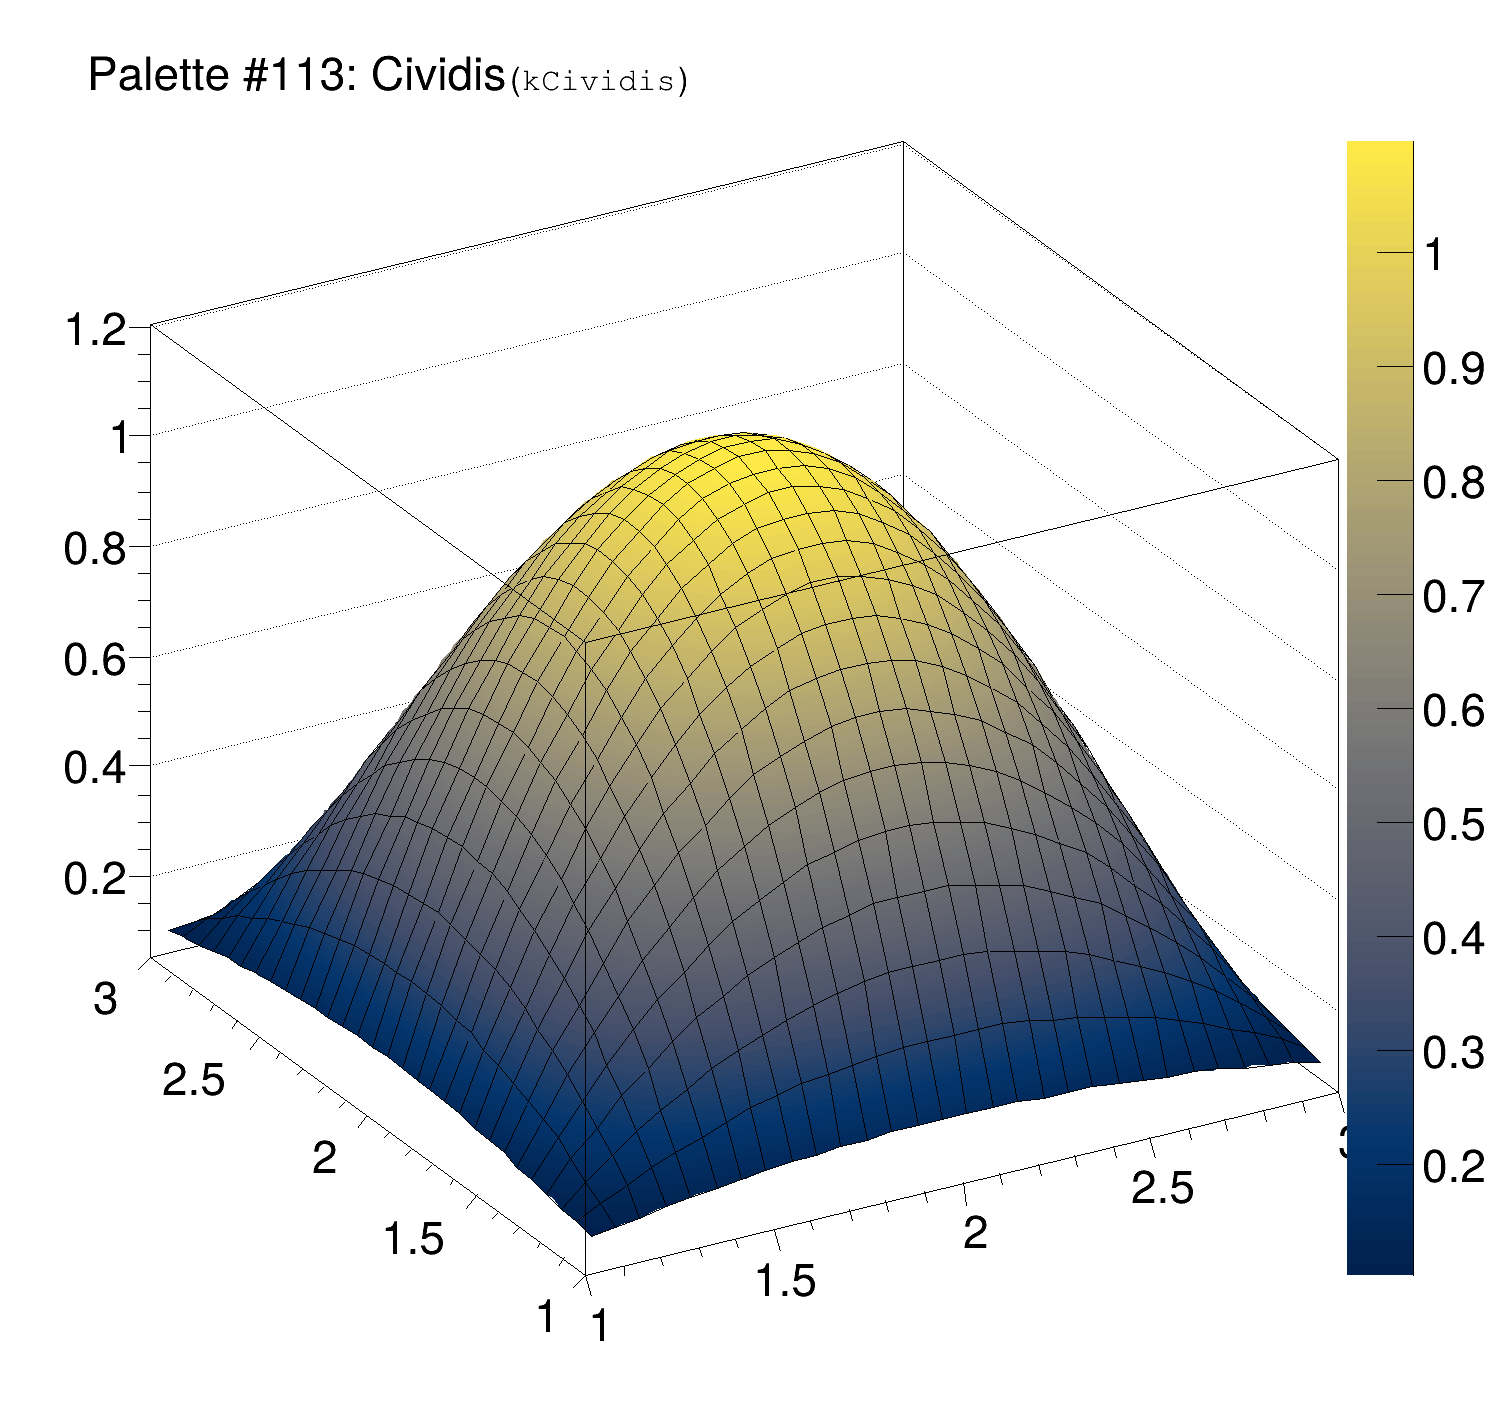 This macro draws all the high definition palettes available in ROOT. This macro draws all the high definition palettes available in ROOT. | |
| pavetext.C | |
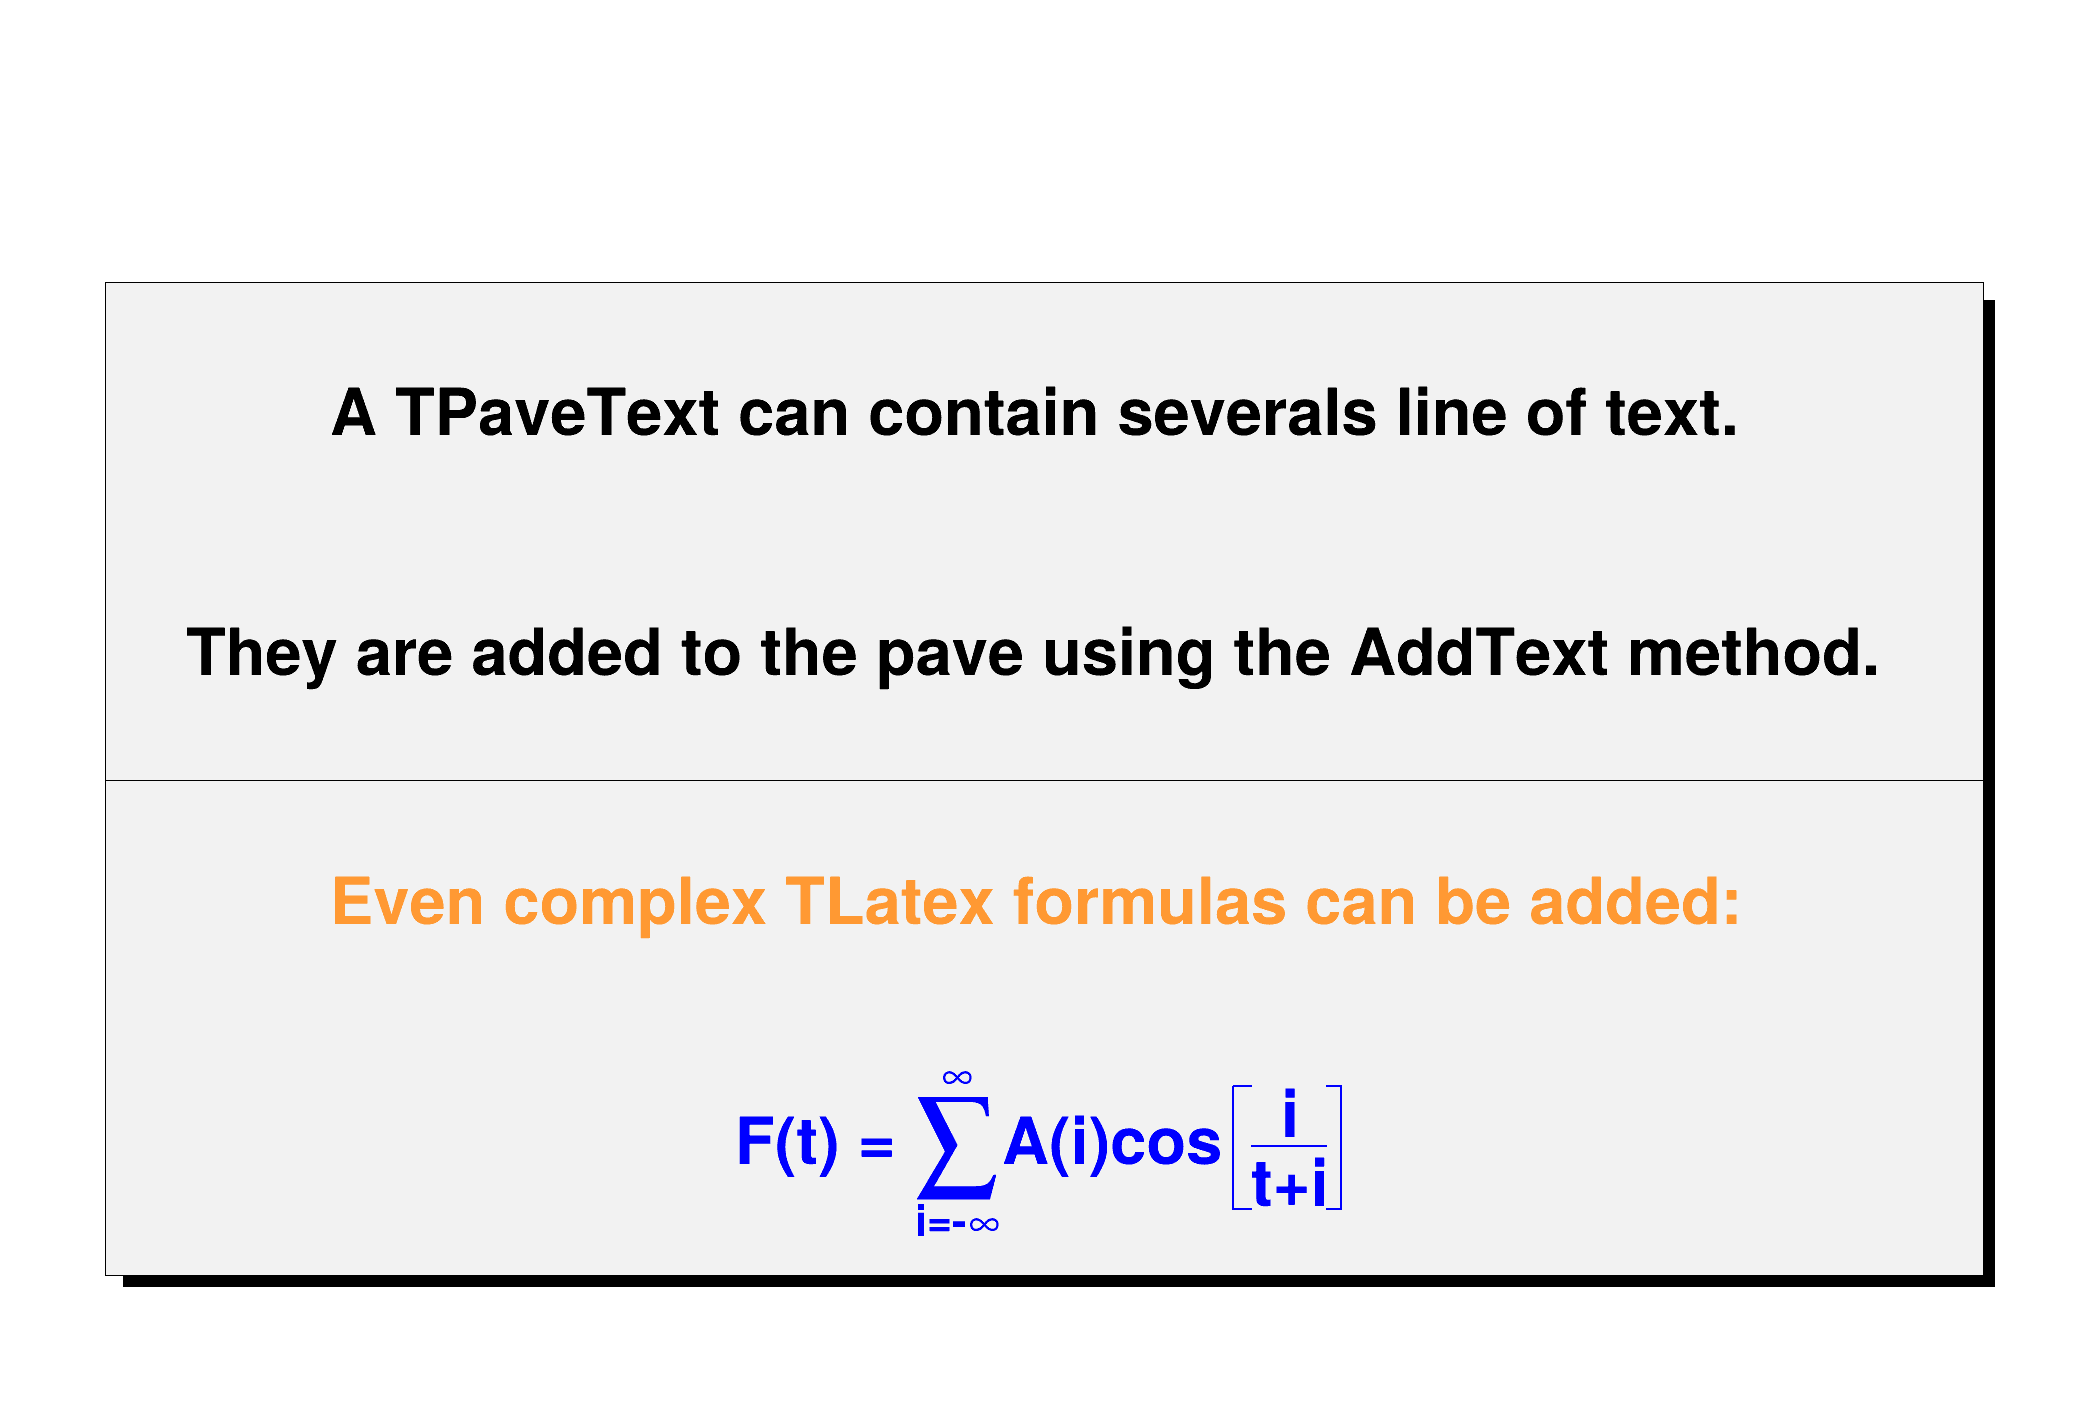 Draw a pave text. Draw a pave text. | |
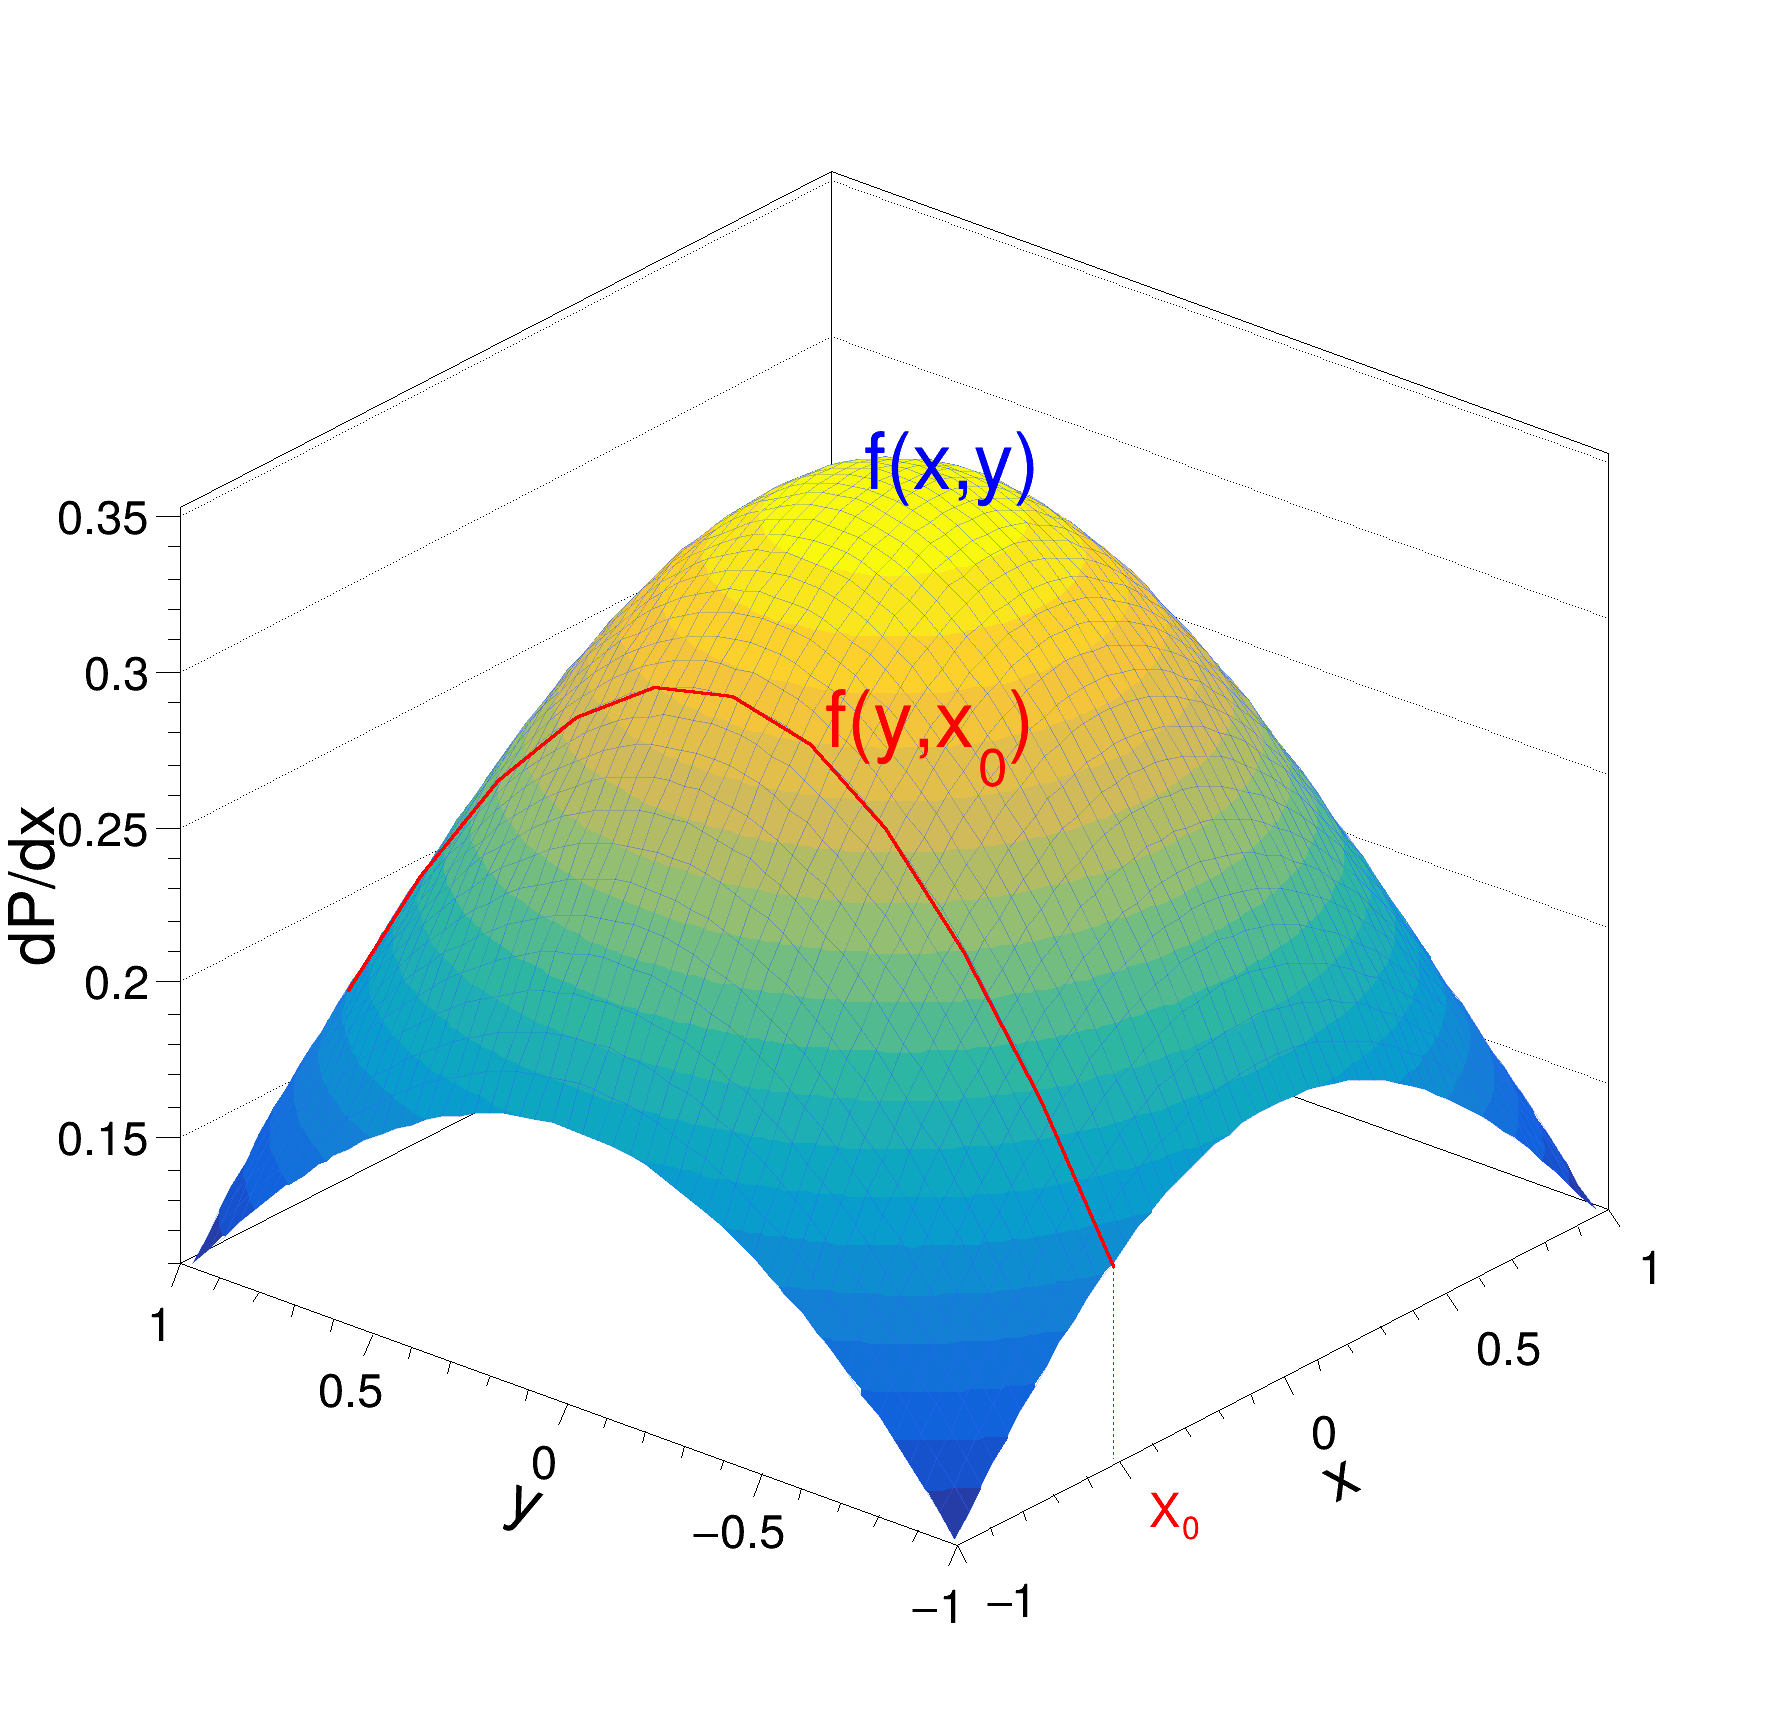
| perceptualcolormap.C | |
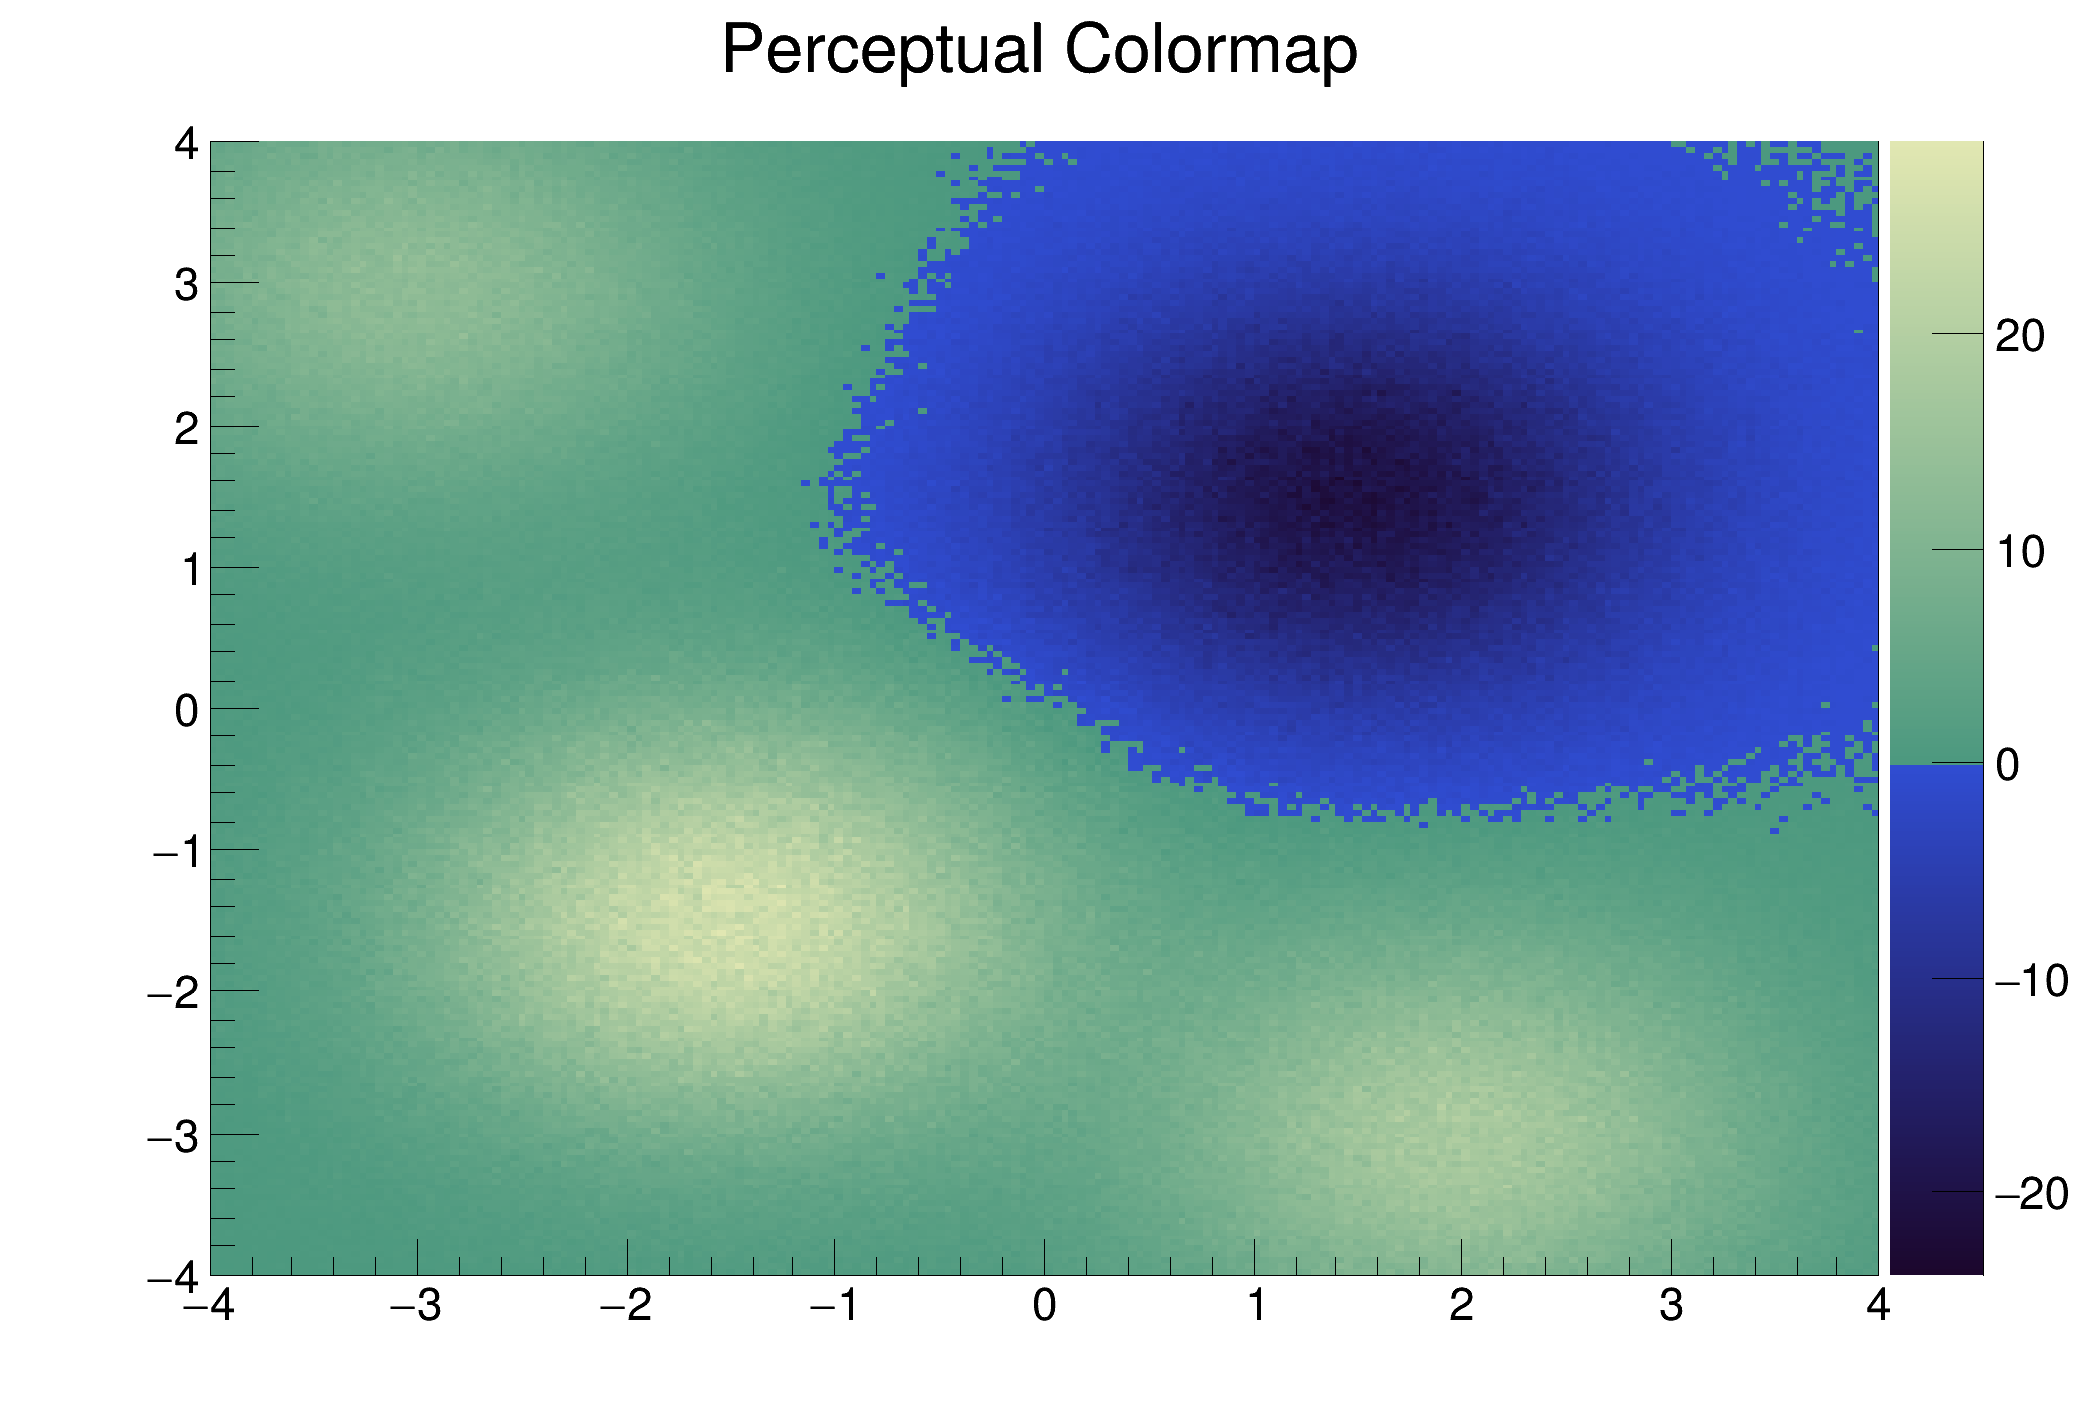 A “Perceptual” colormap explicitly identifies a fixed value in the data. A “Perceptual” colormap explicitly identifies a fixed value in the data. | |
| piechart.C | |
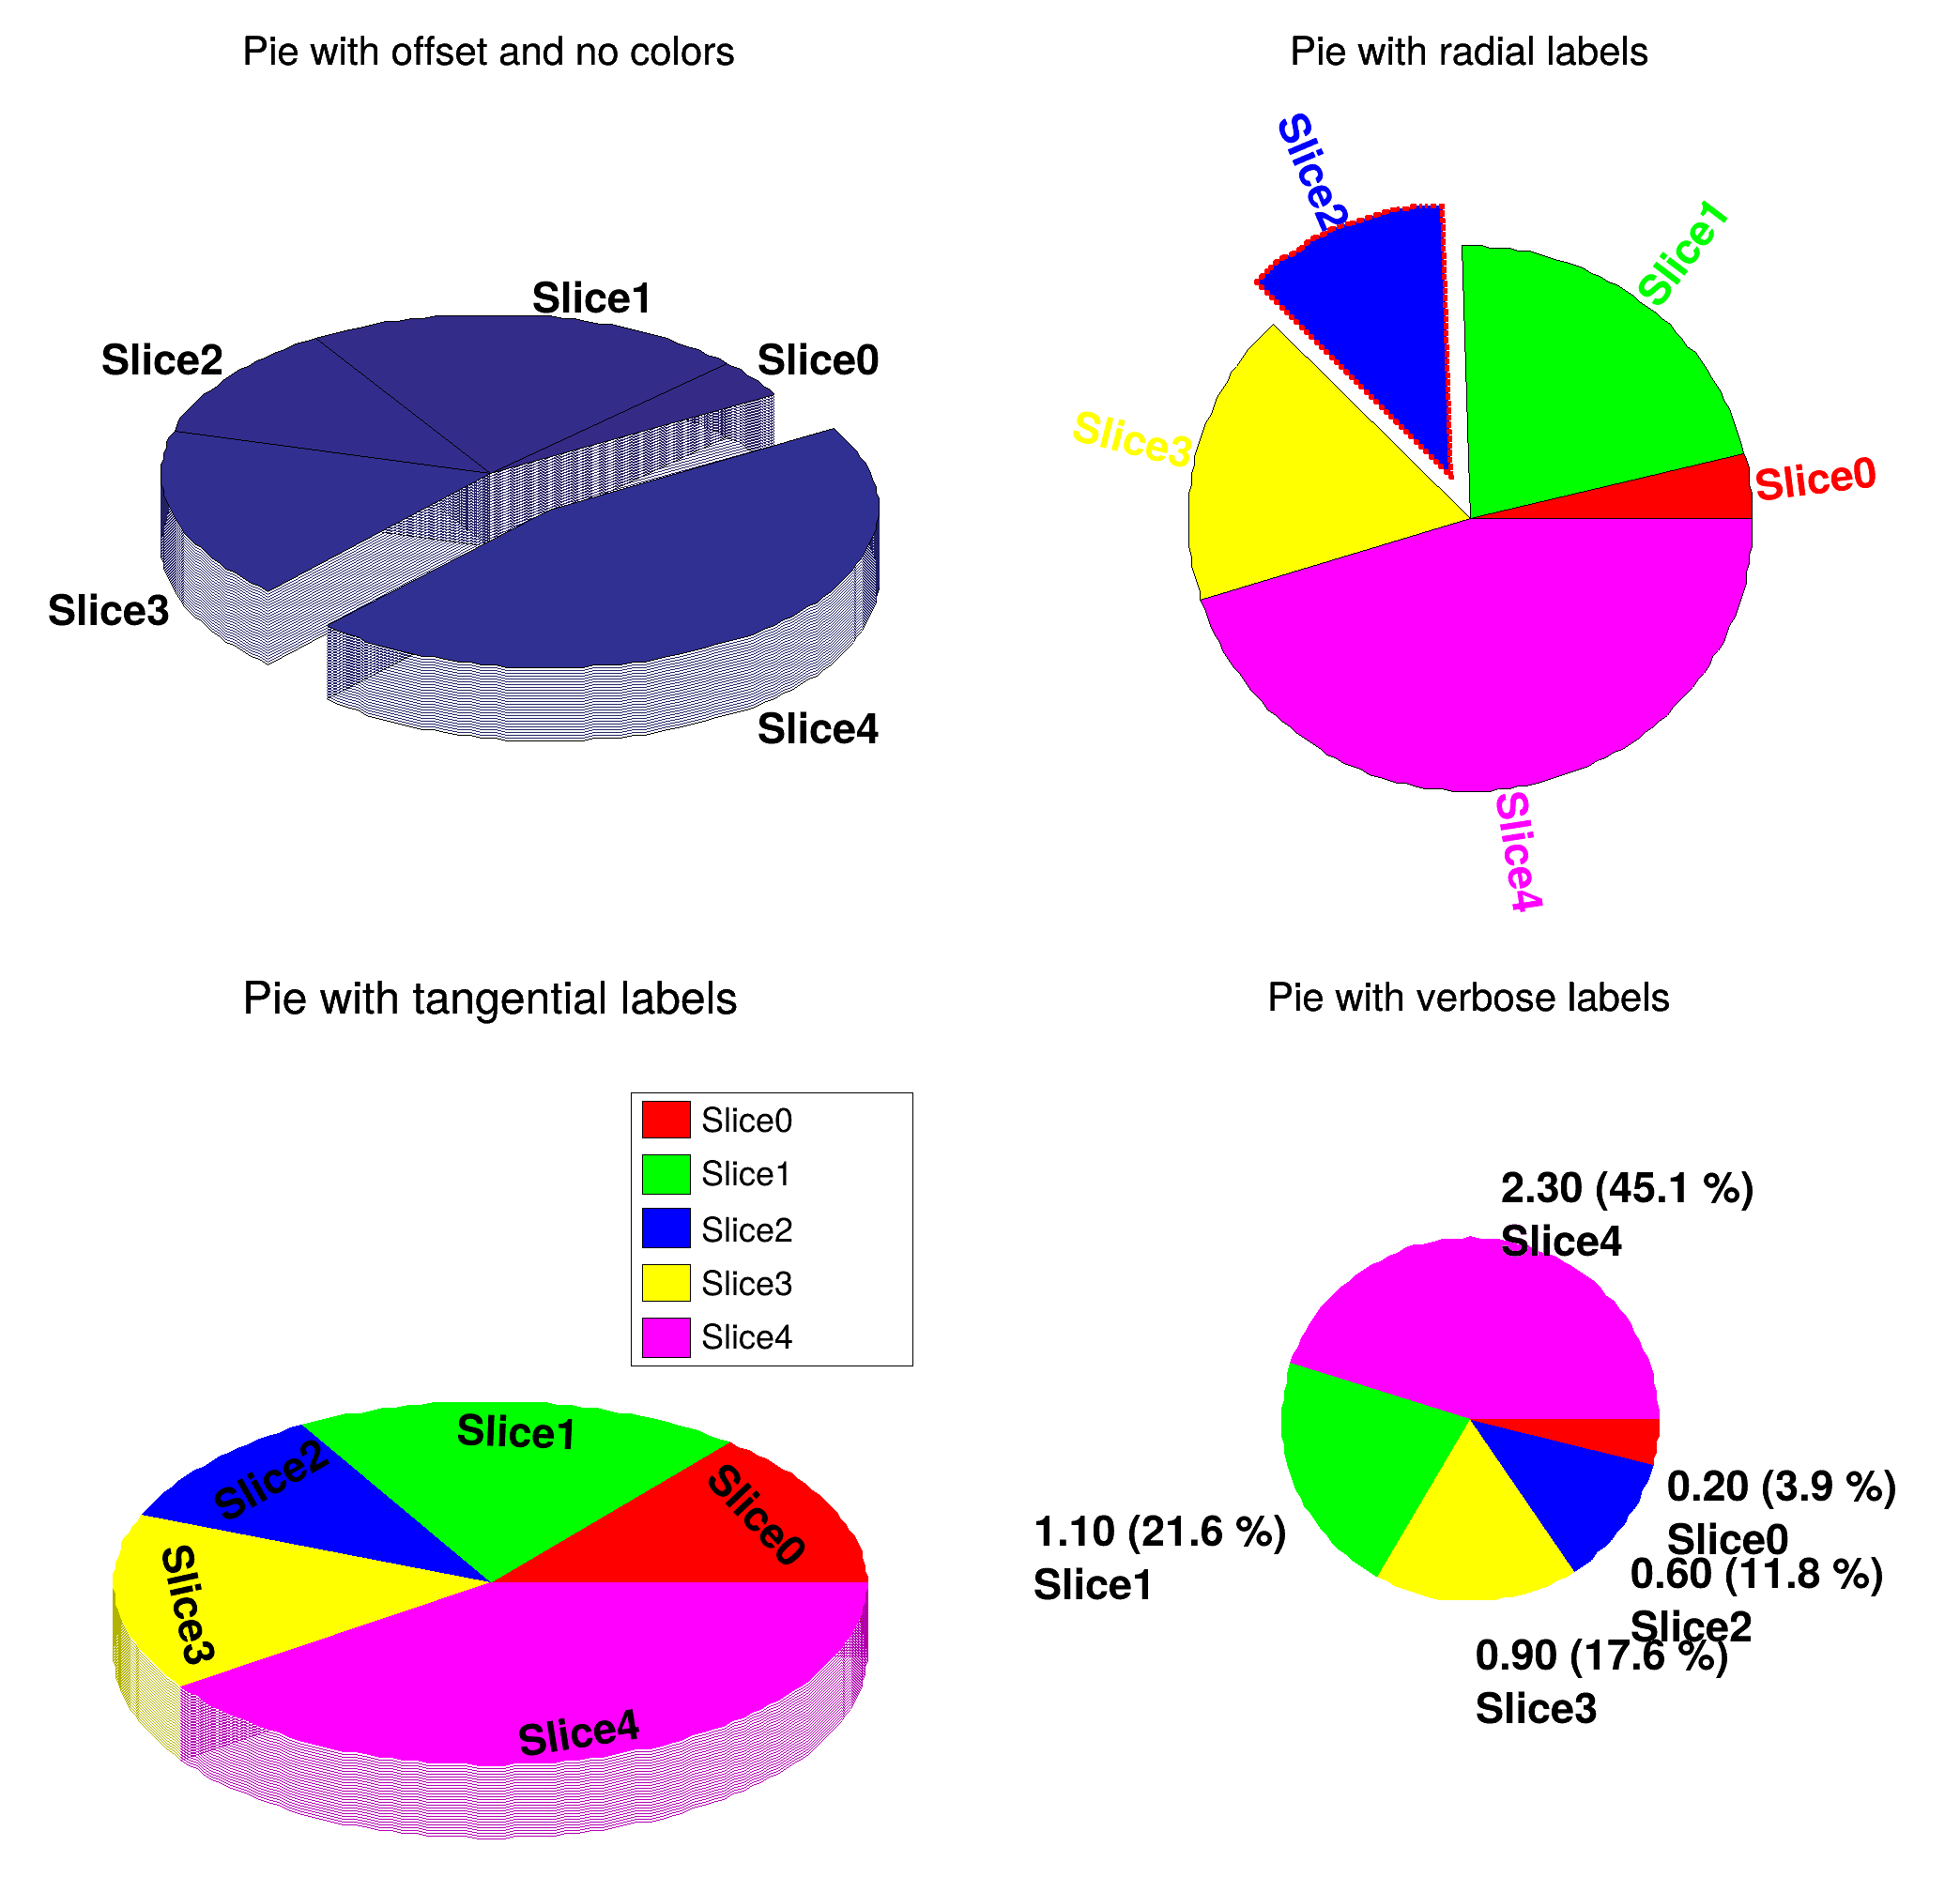 Pie chart example. Pie chart example. | |
| polytest1.C | |
| This macro is testing the "compacting" algorithm in TPadPainter. | |
| polytest2.C | |
| This macro is testing the "compacting" algorithm in TPadPainter. | |
| pstable.C | |
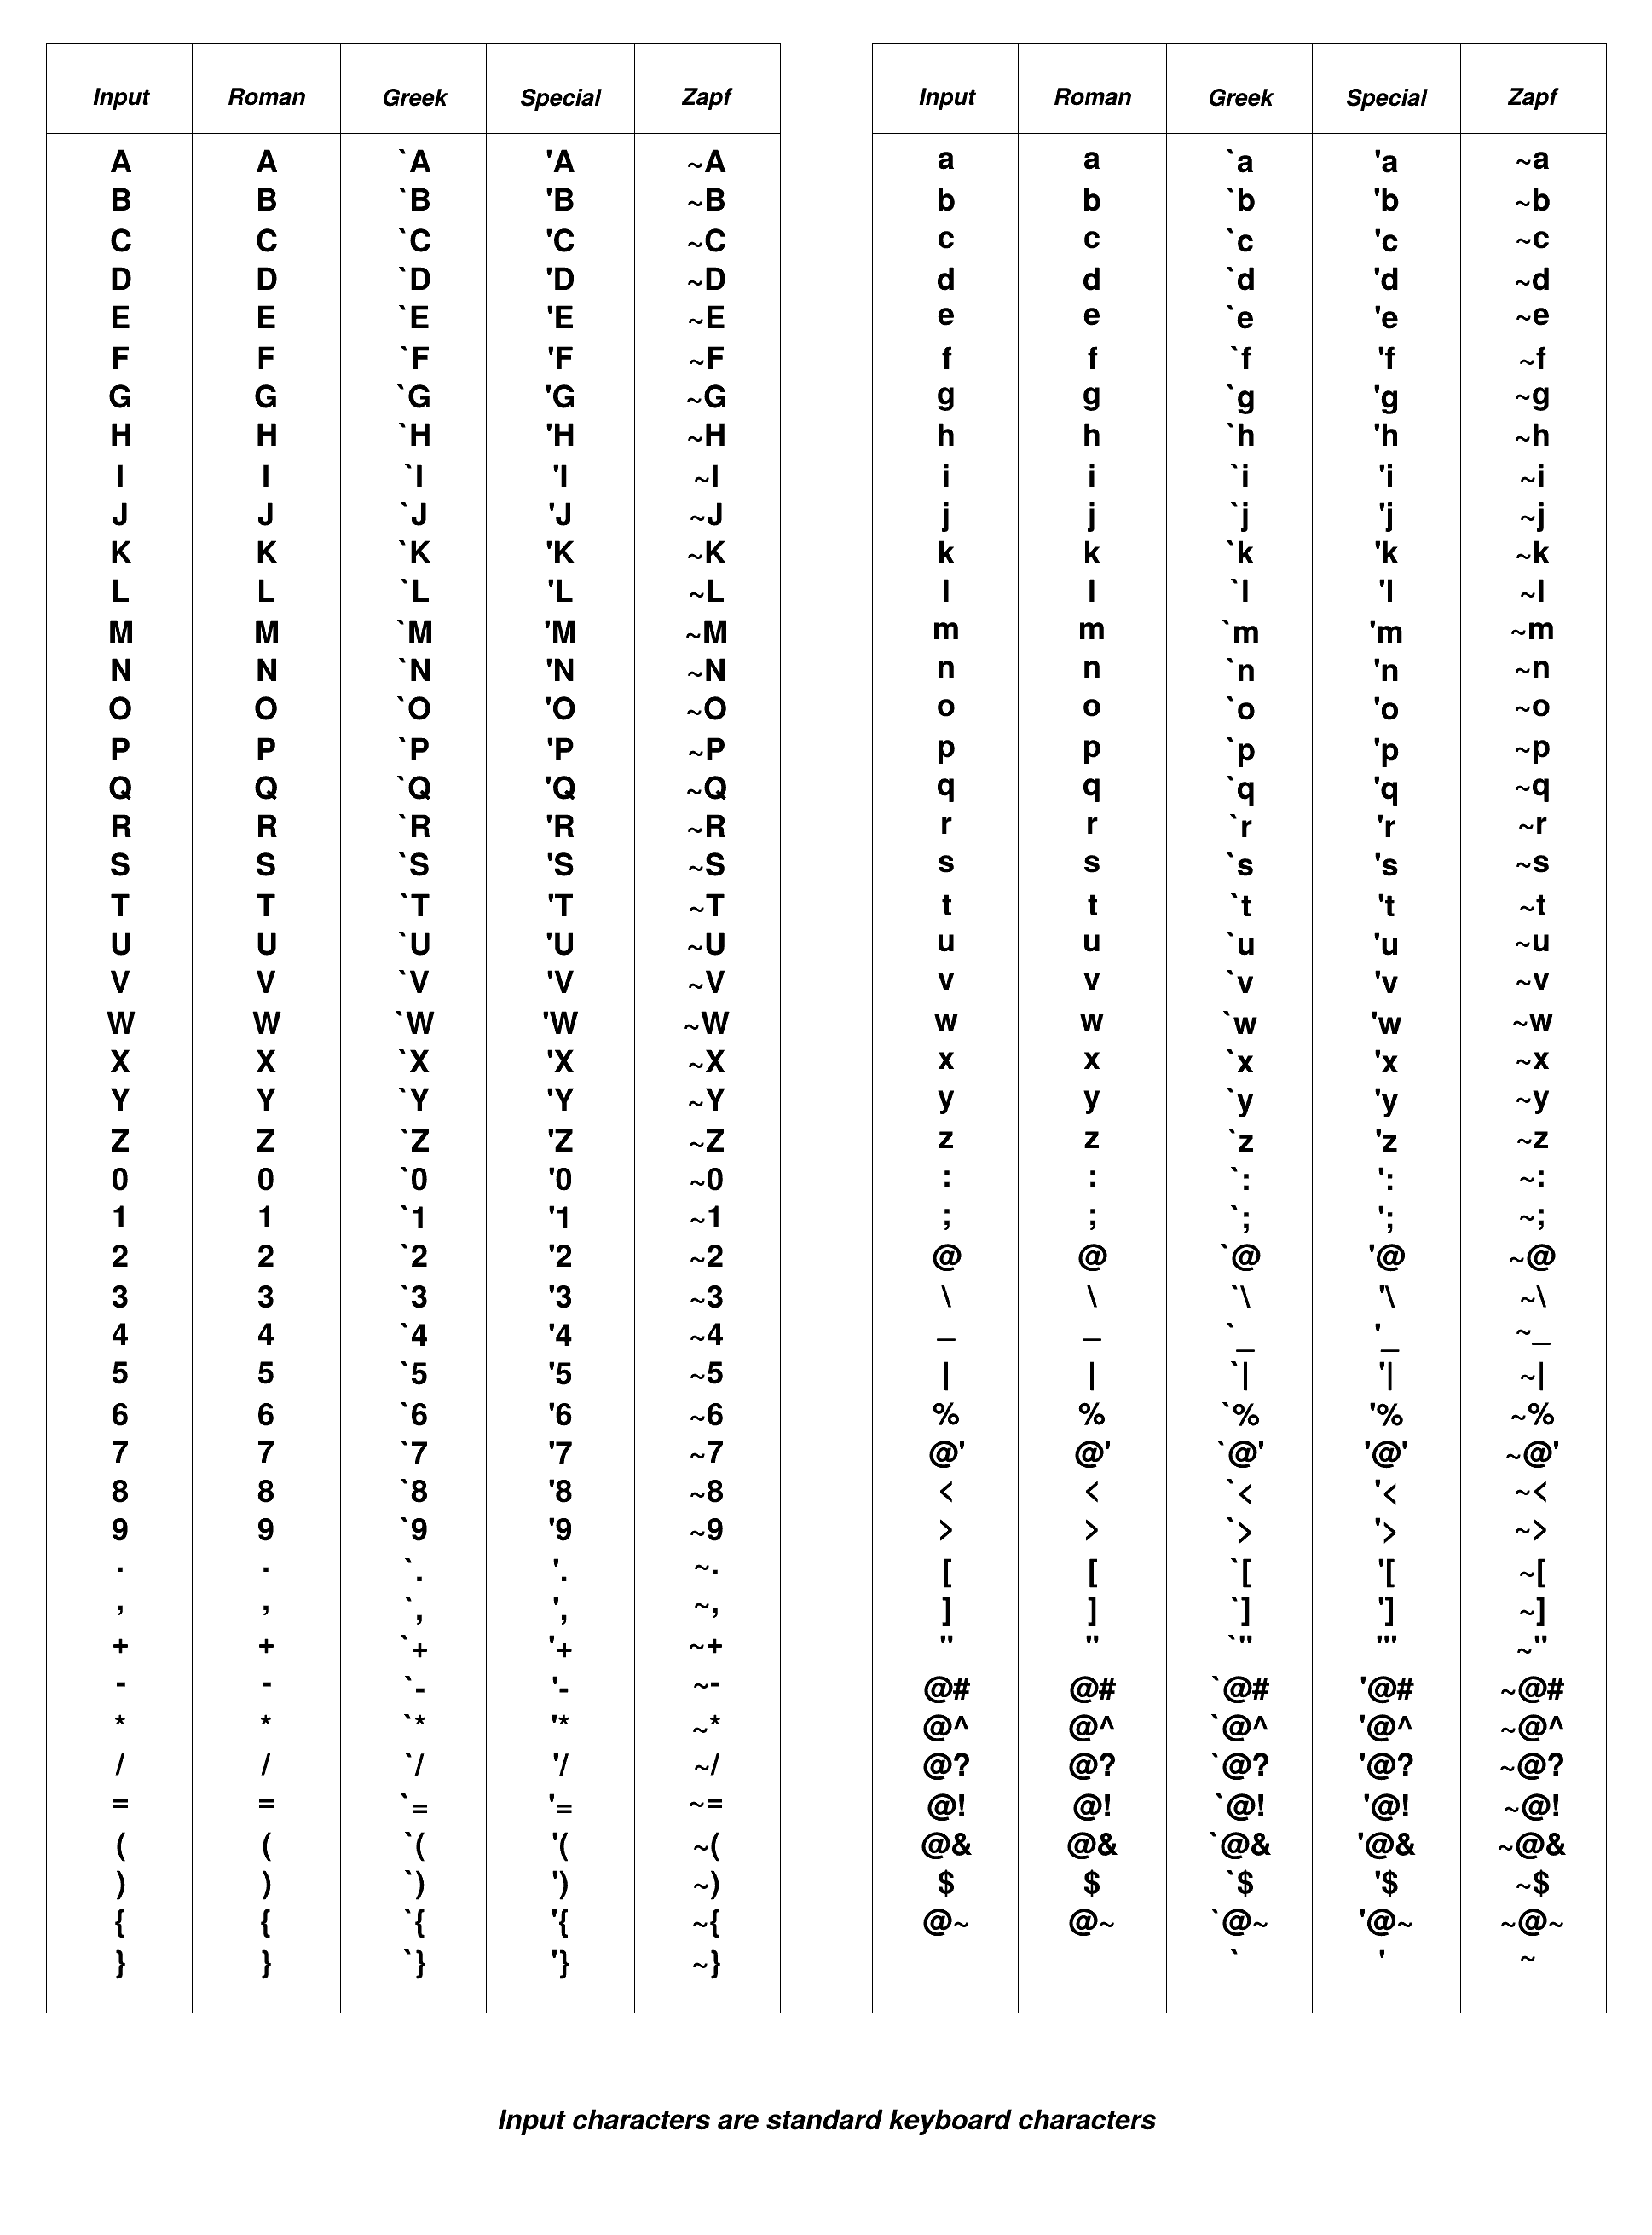 Display all possible types of ROOT/Postscript characters. Display all possible types of ROOT/Postscript characters. | |
| psview.C | |
| An example how to display PS, EPS, PDF files in canvas. | |
| quarks.C | |
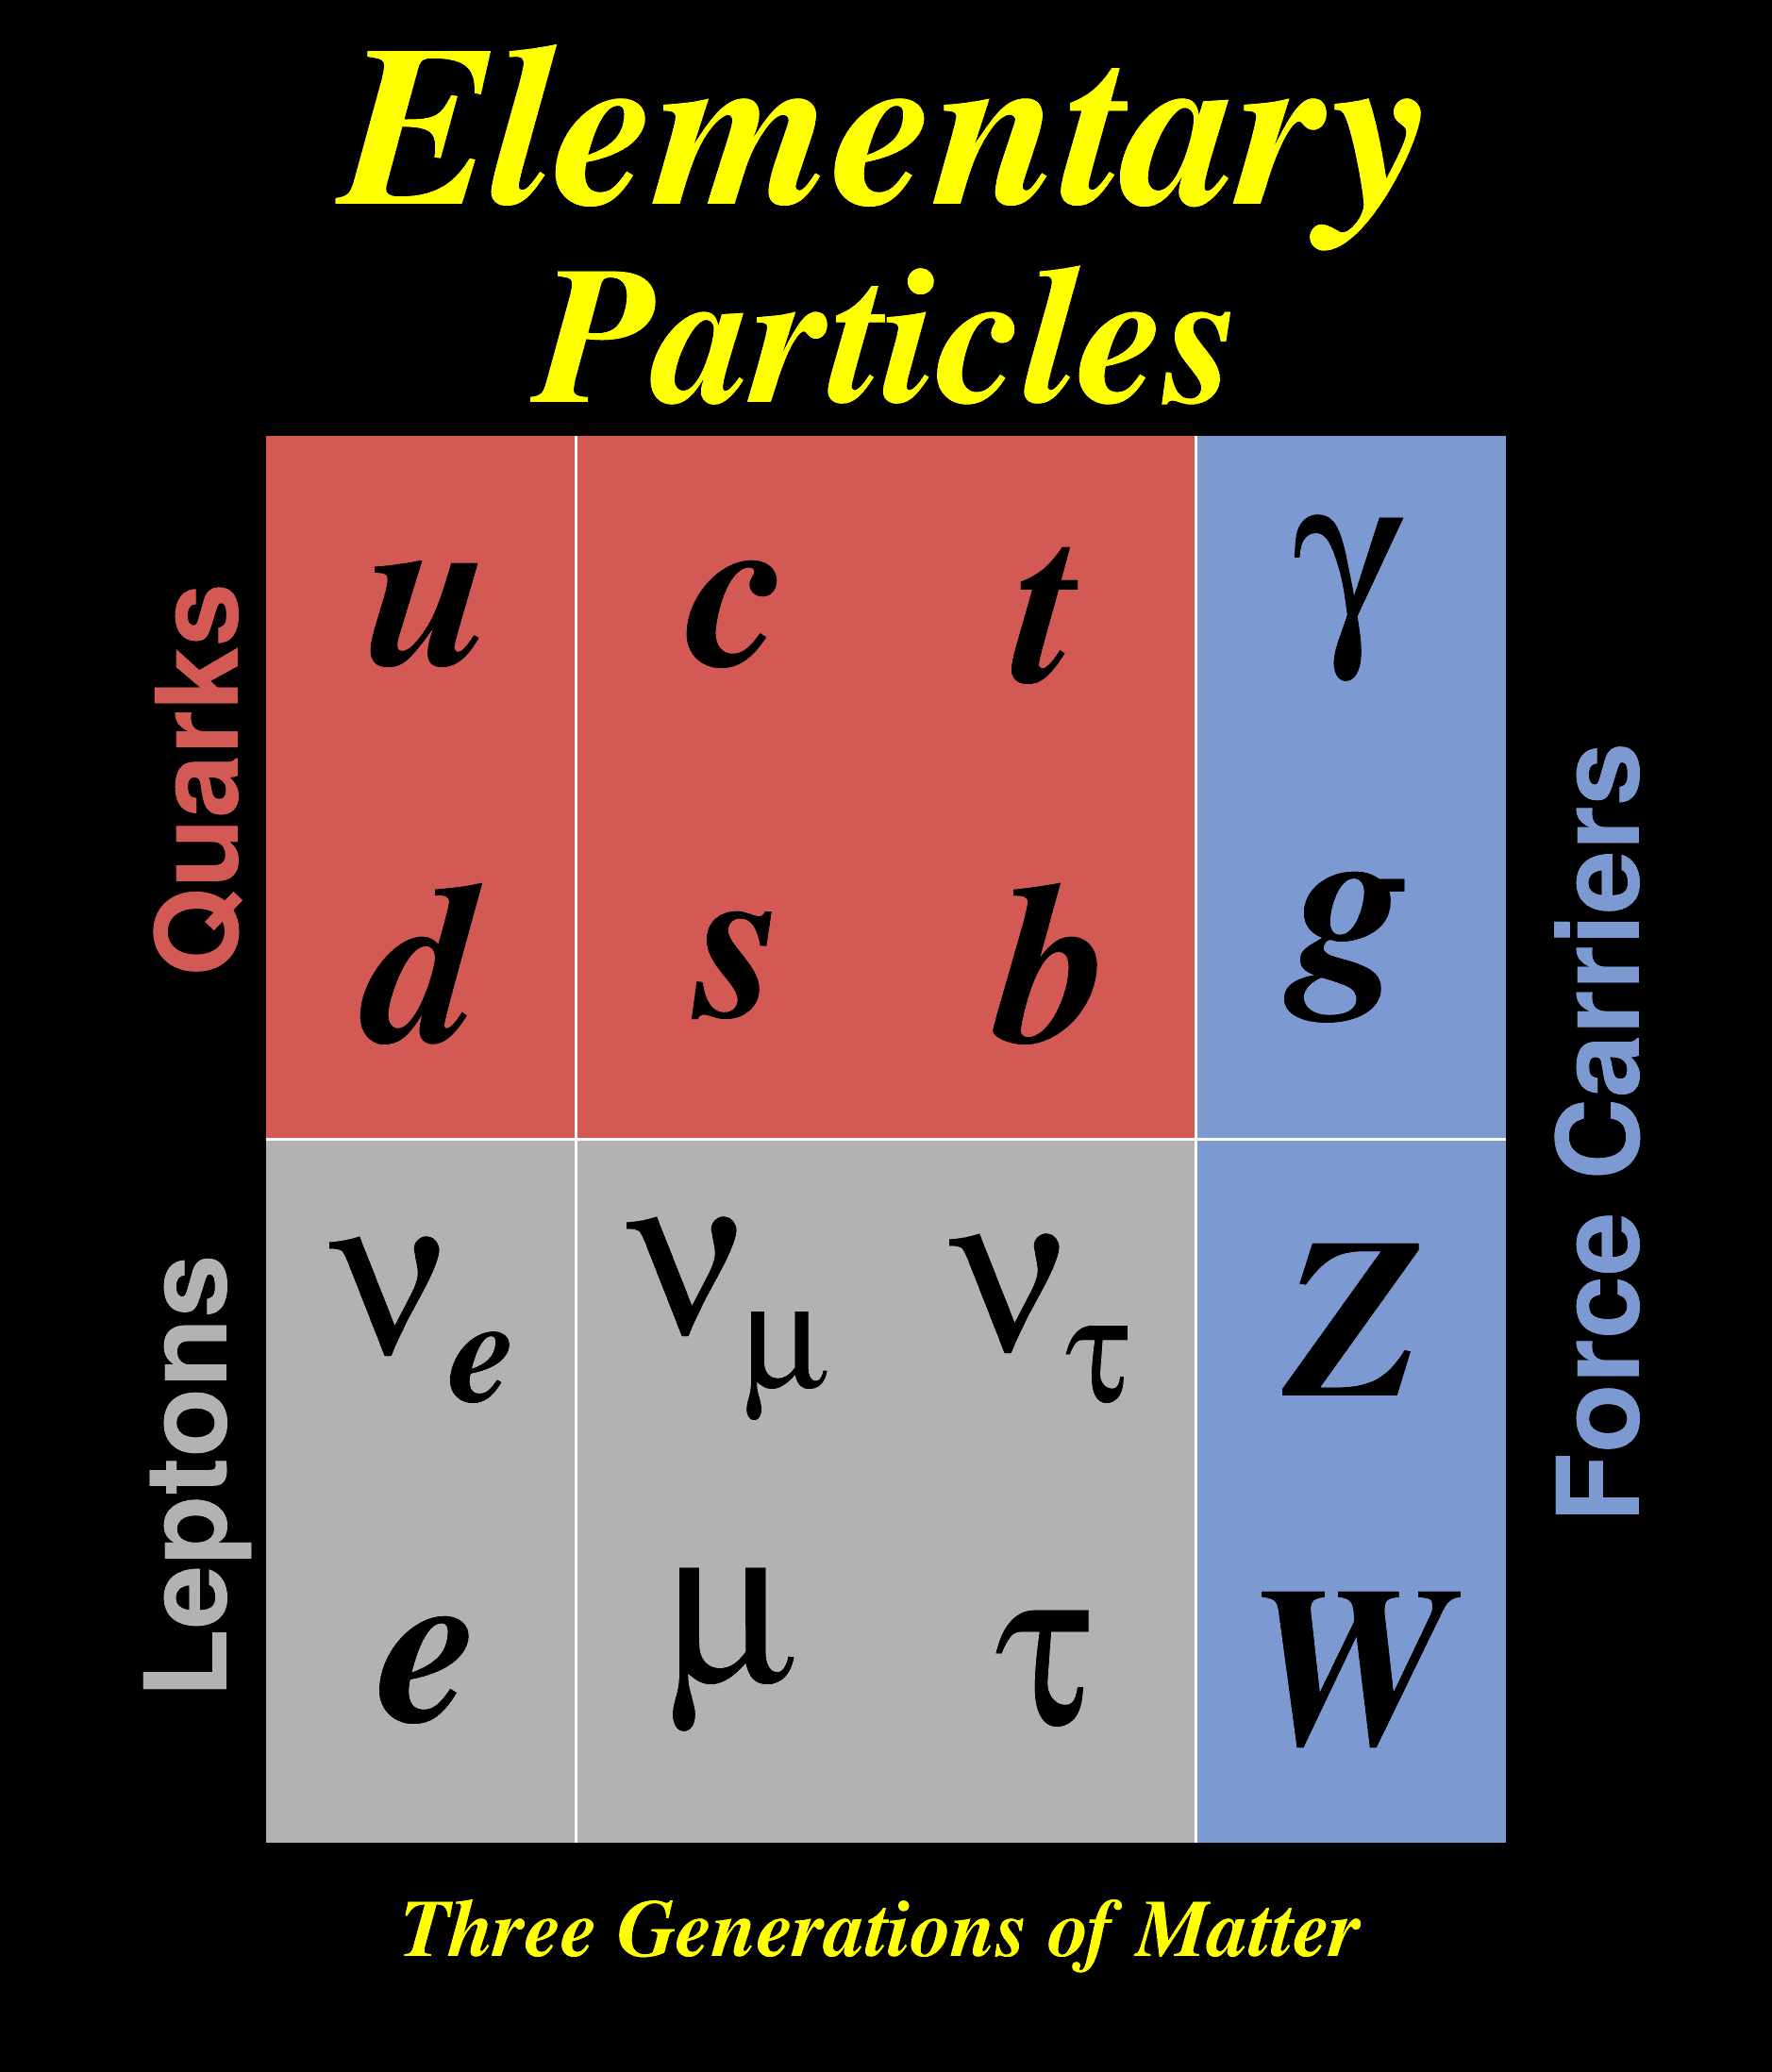 Example illustrating divided pads and Latex. Example illustrating divided pads and Latex. | |
| save_batch.C | |
| This macro demonstrates batch image mode of web canvas When enabled - several images converted into JSON before all together provided to headless browser to produce image files. | |
| saveall.C | |
| Creates many canvases and save as images or pdf. | |
| schroedinger_hydrogen.C | |
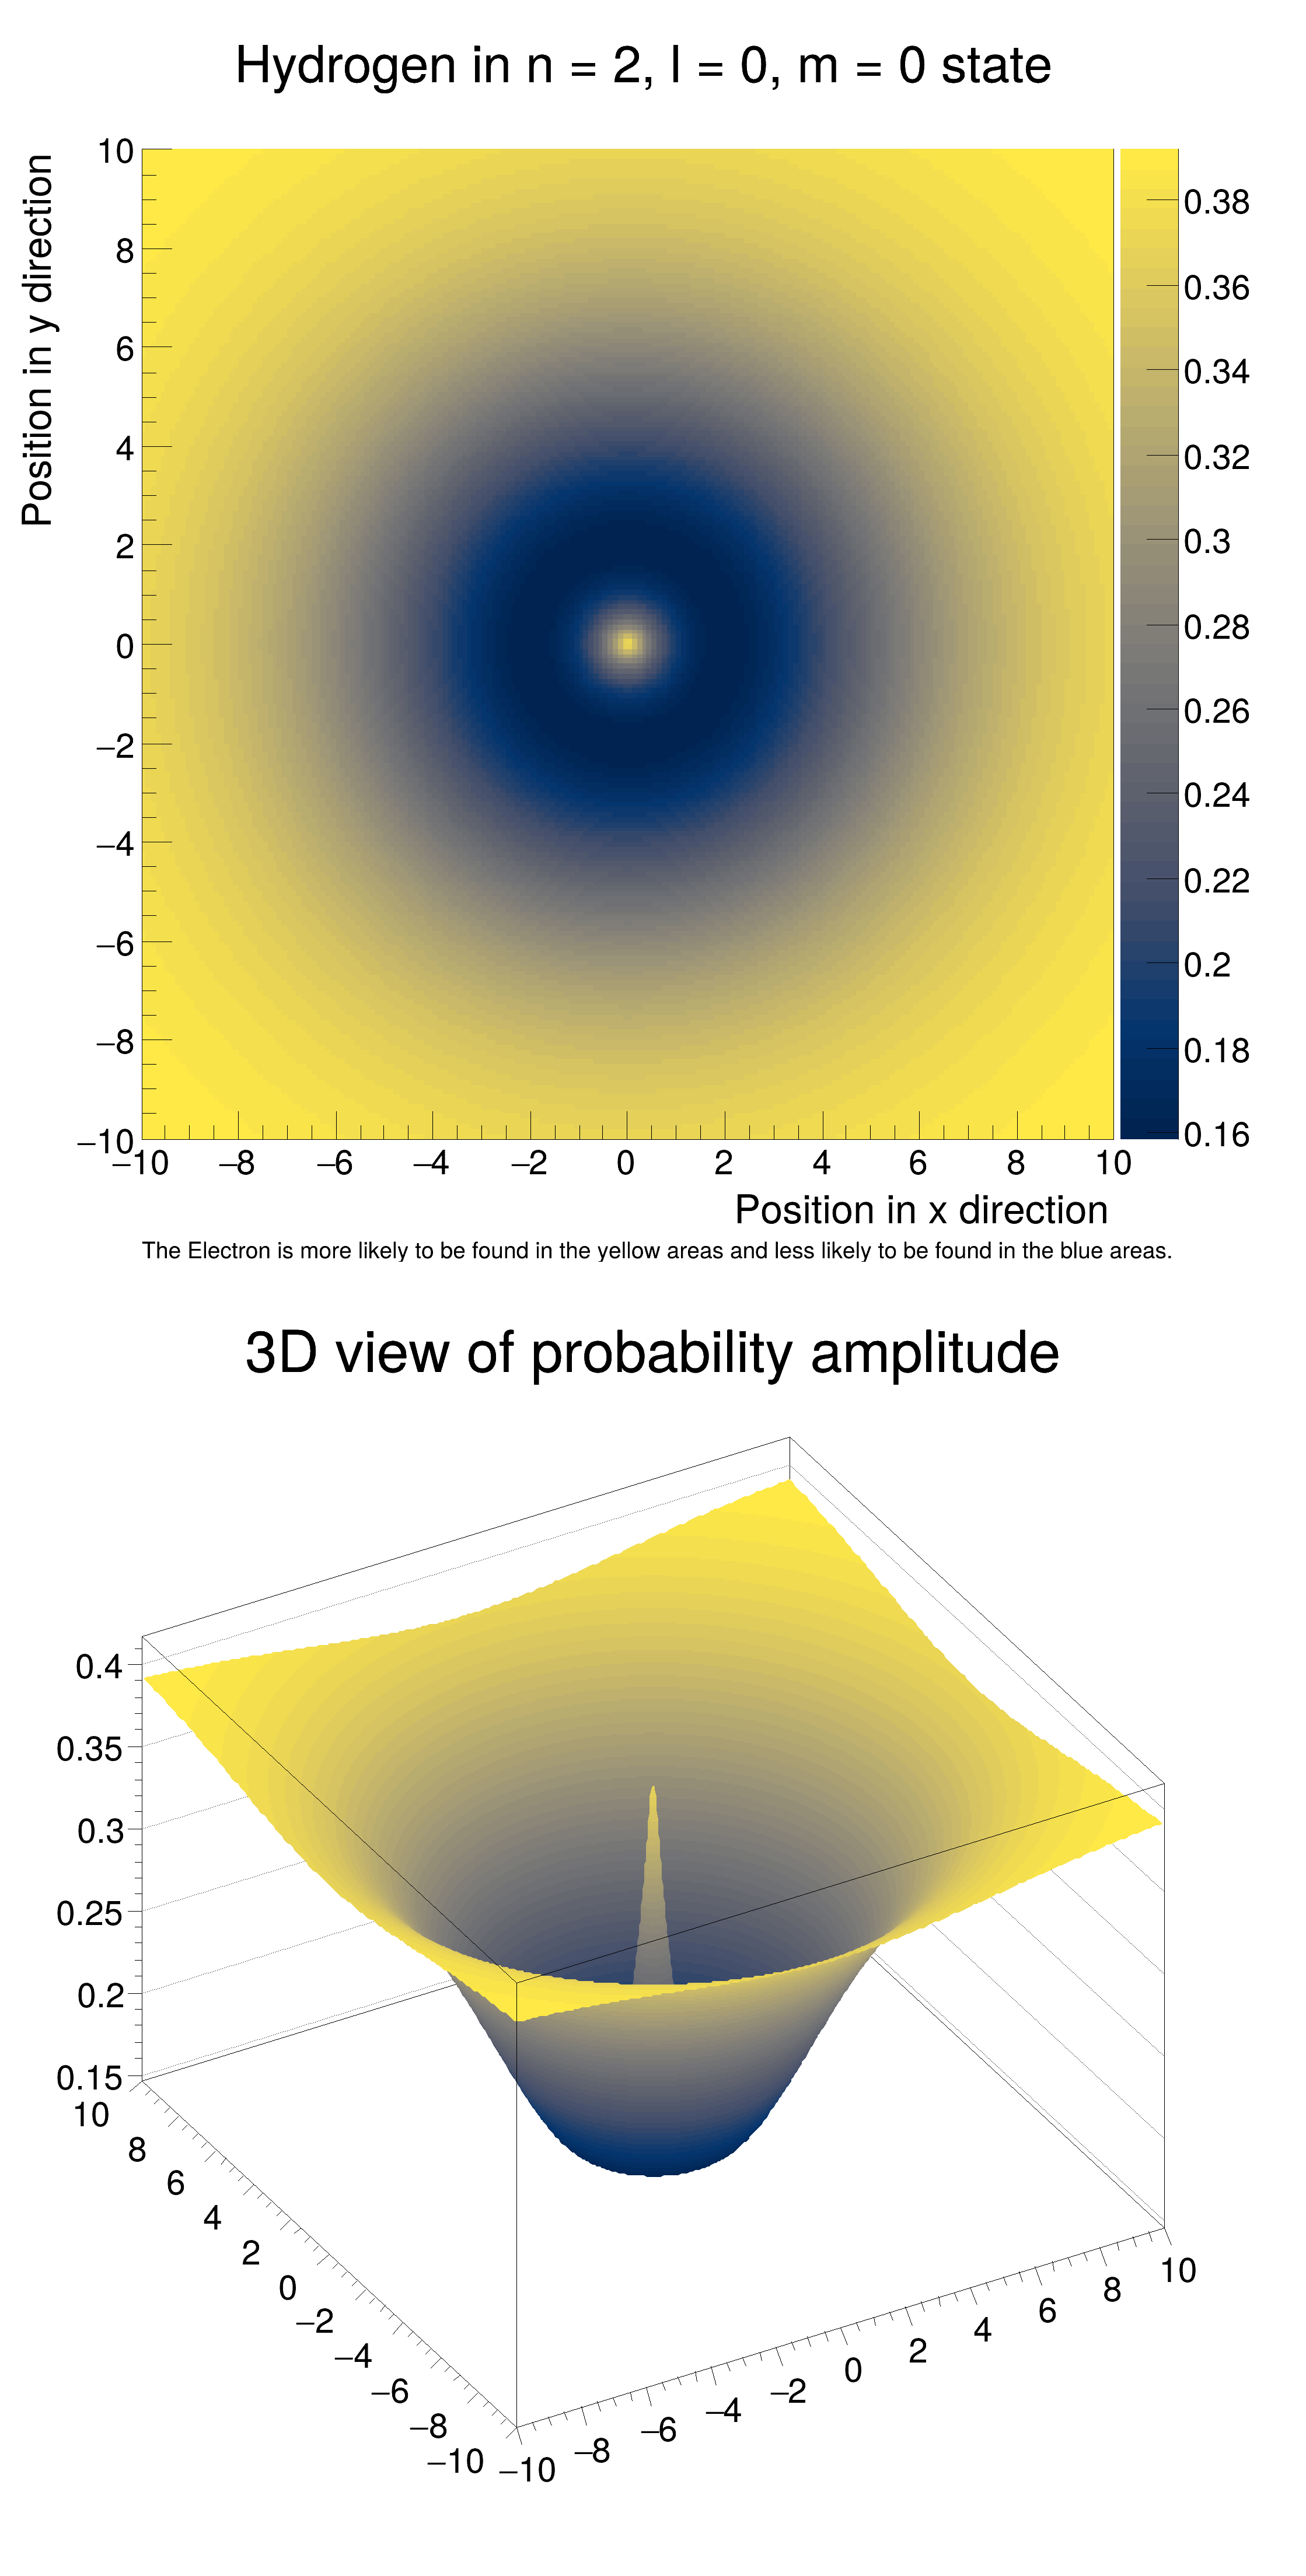 Plot the Amplitude of a Hydrogen Atom. Plot the Amplitude of a Hydrogen Atom. | |
| splines_test.C | |
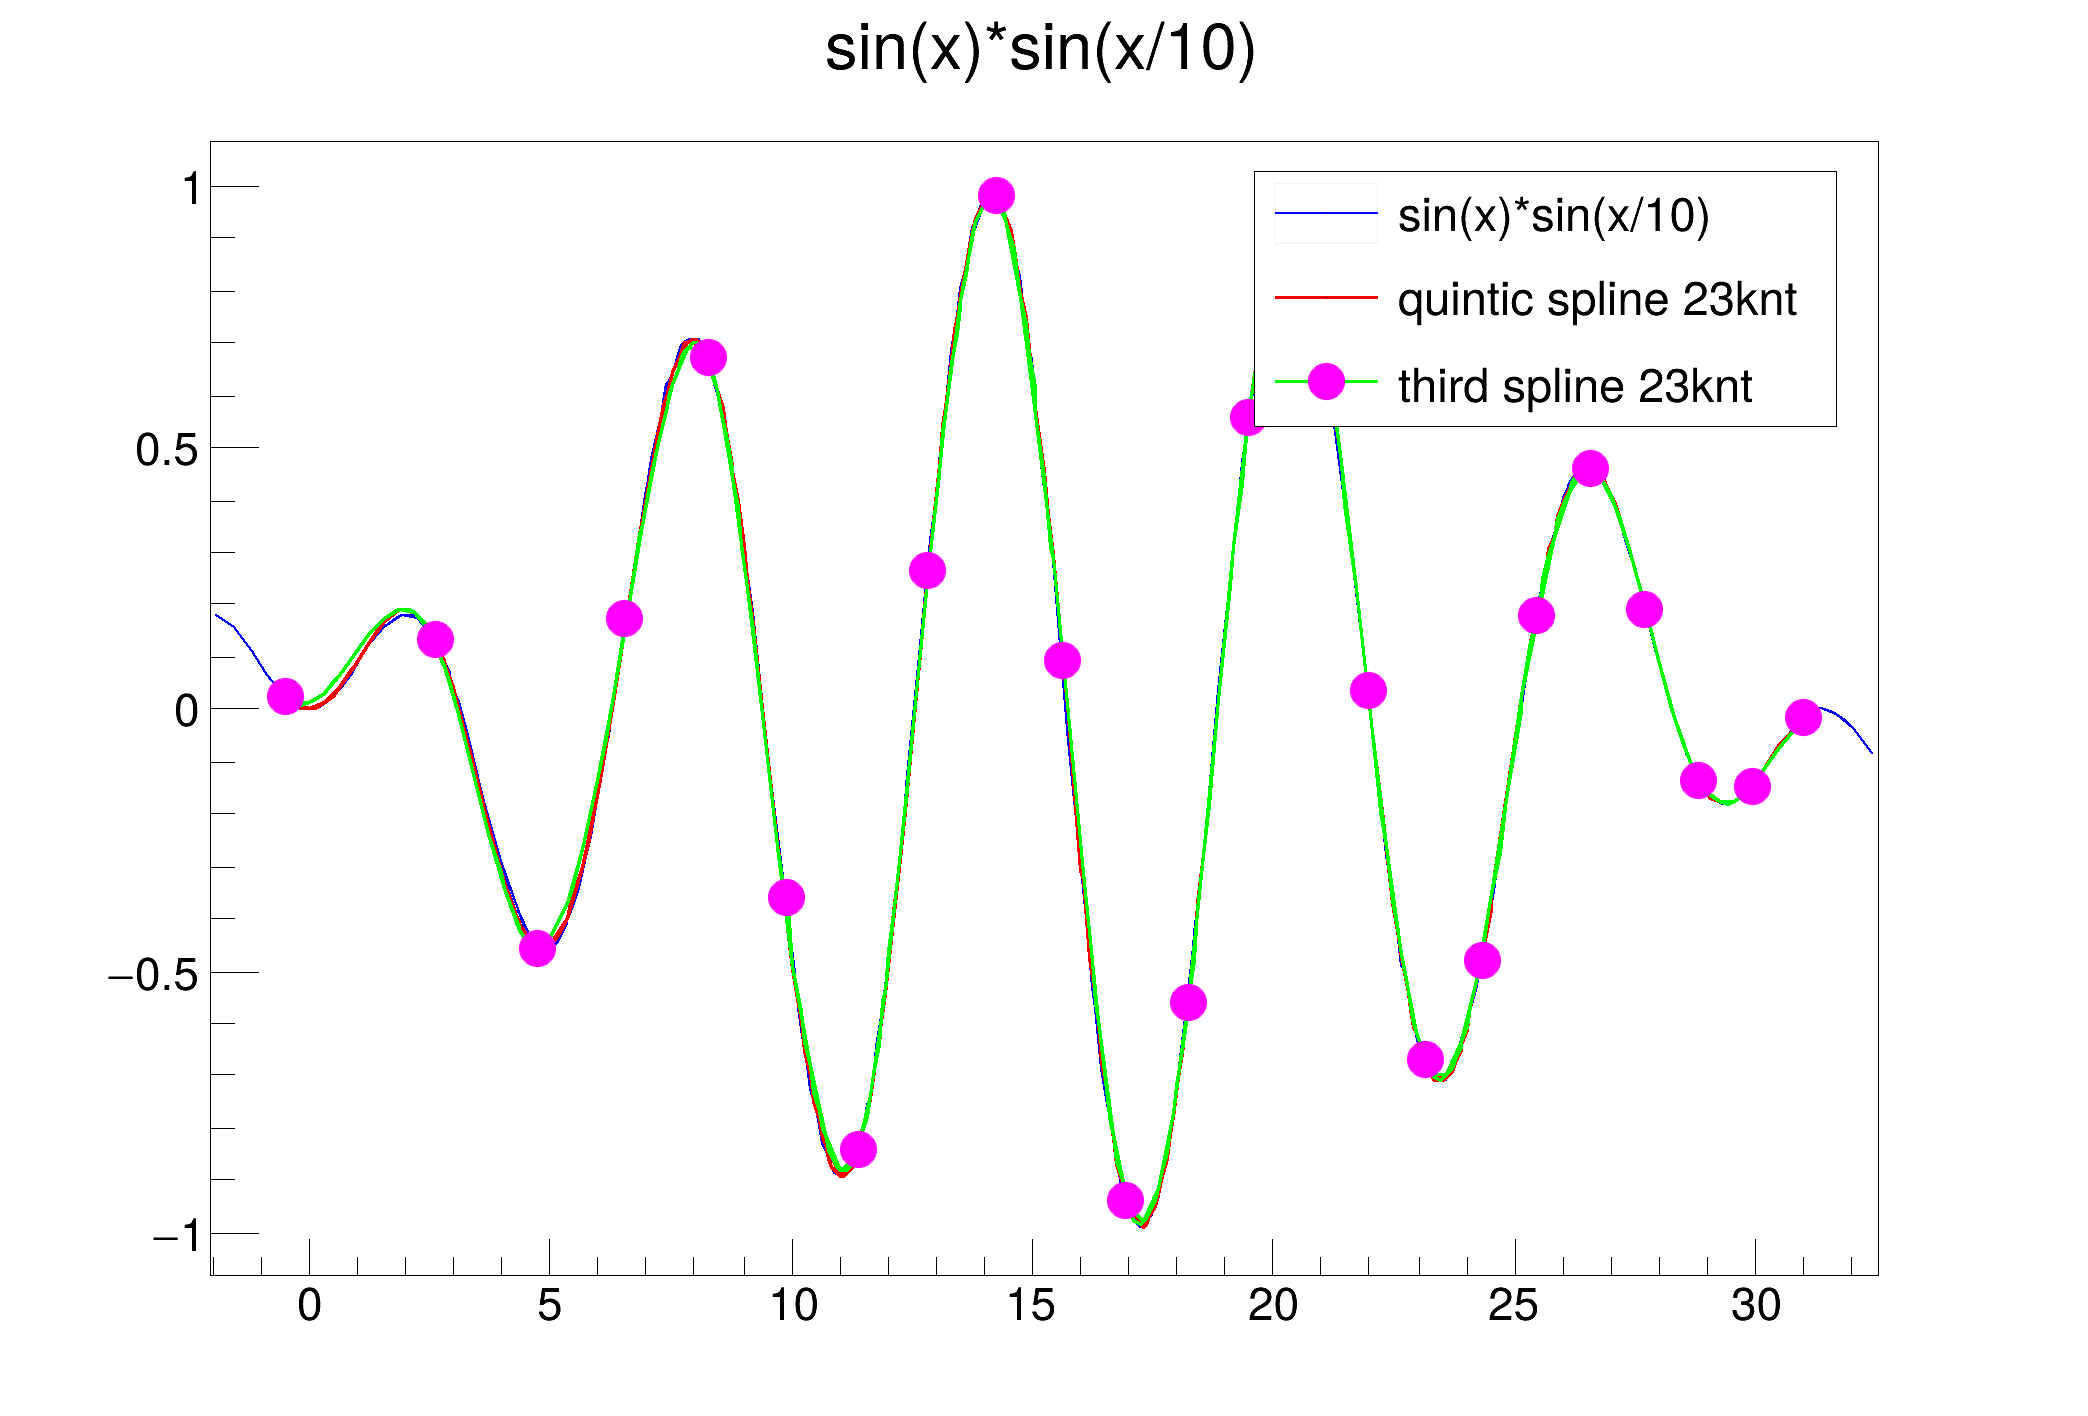 Examples of use of the spline classes. Examples of use of the spline classes. | |
| surfaces.C | |
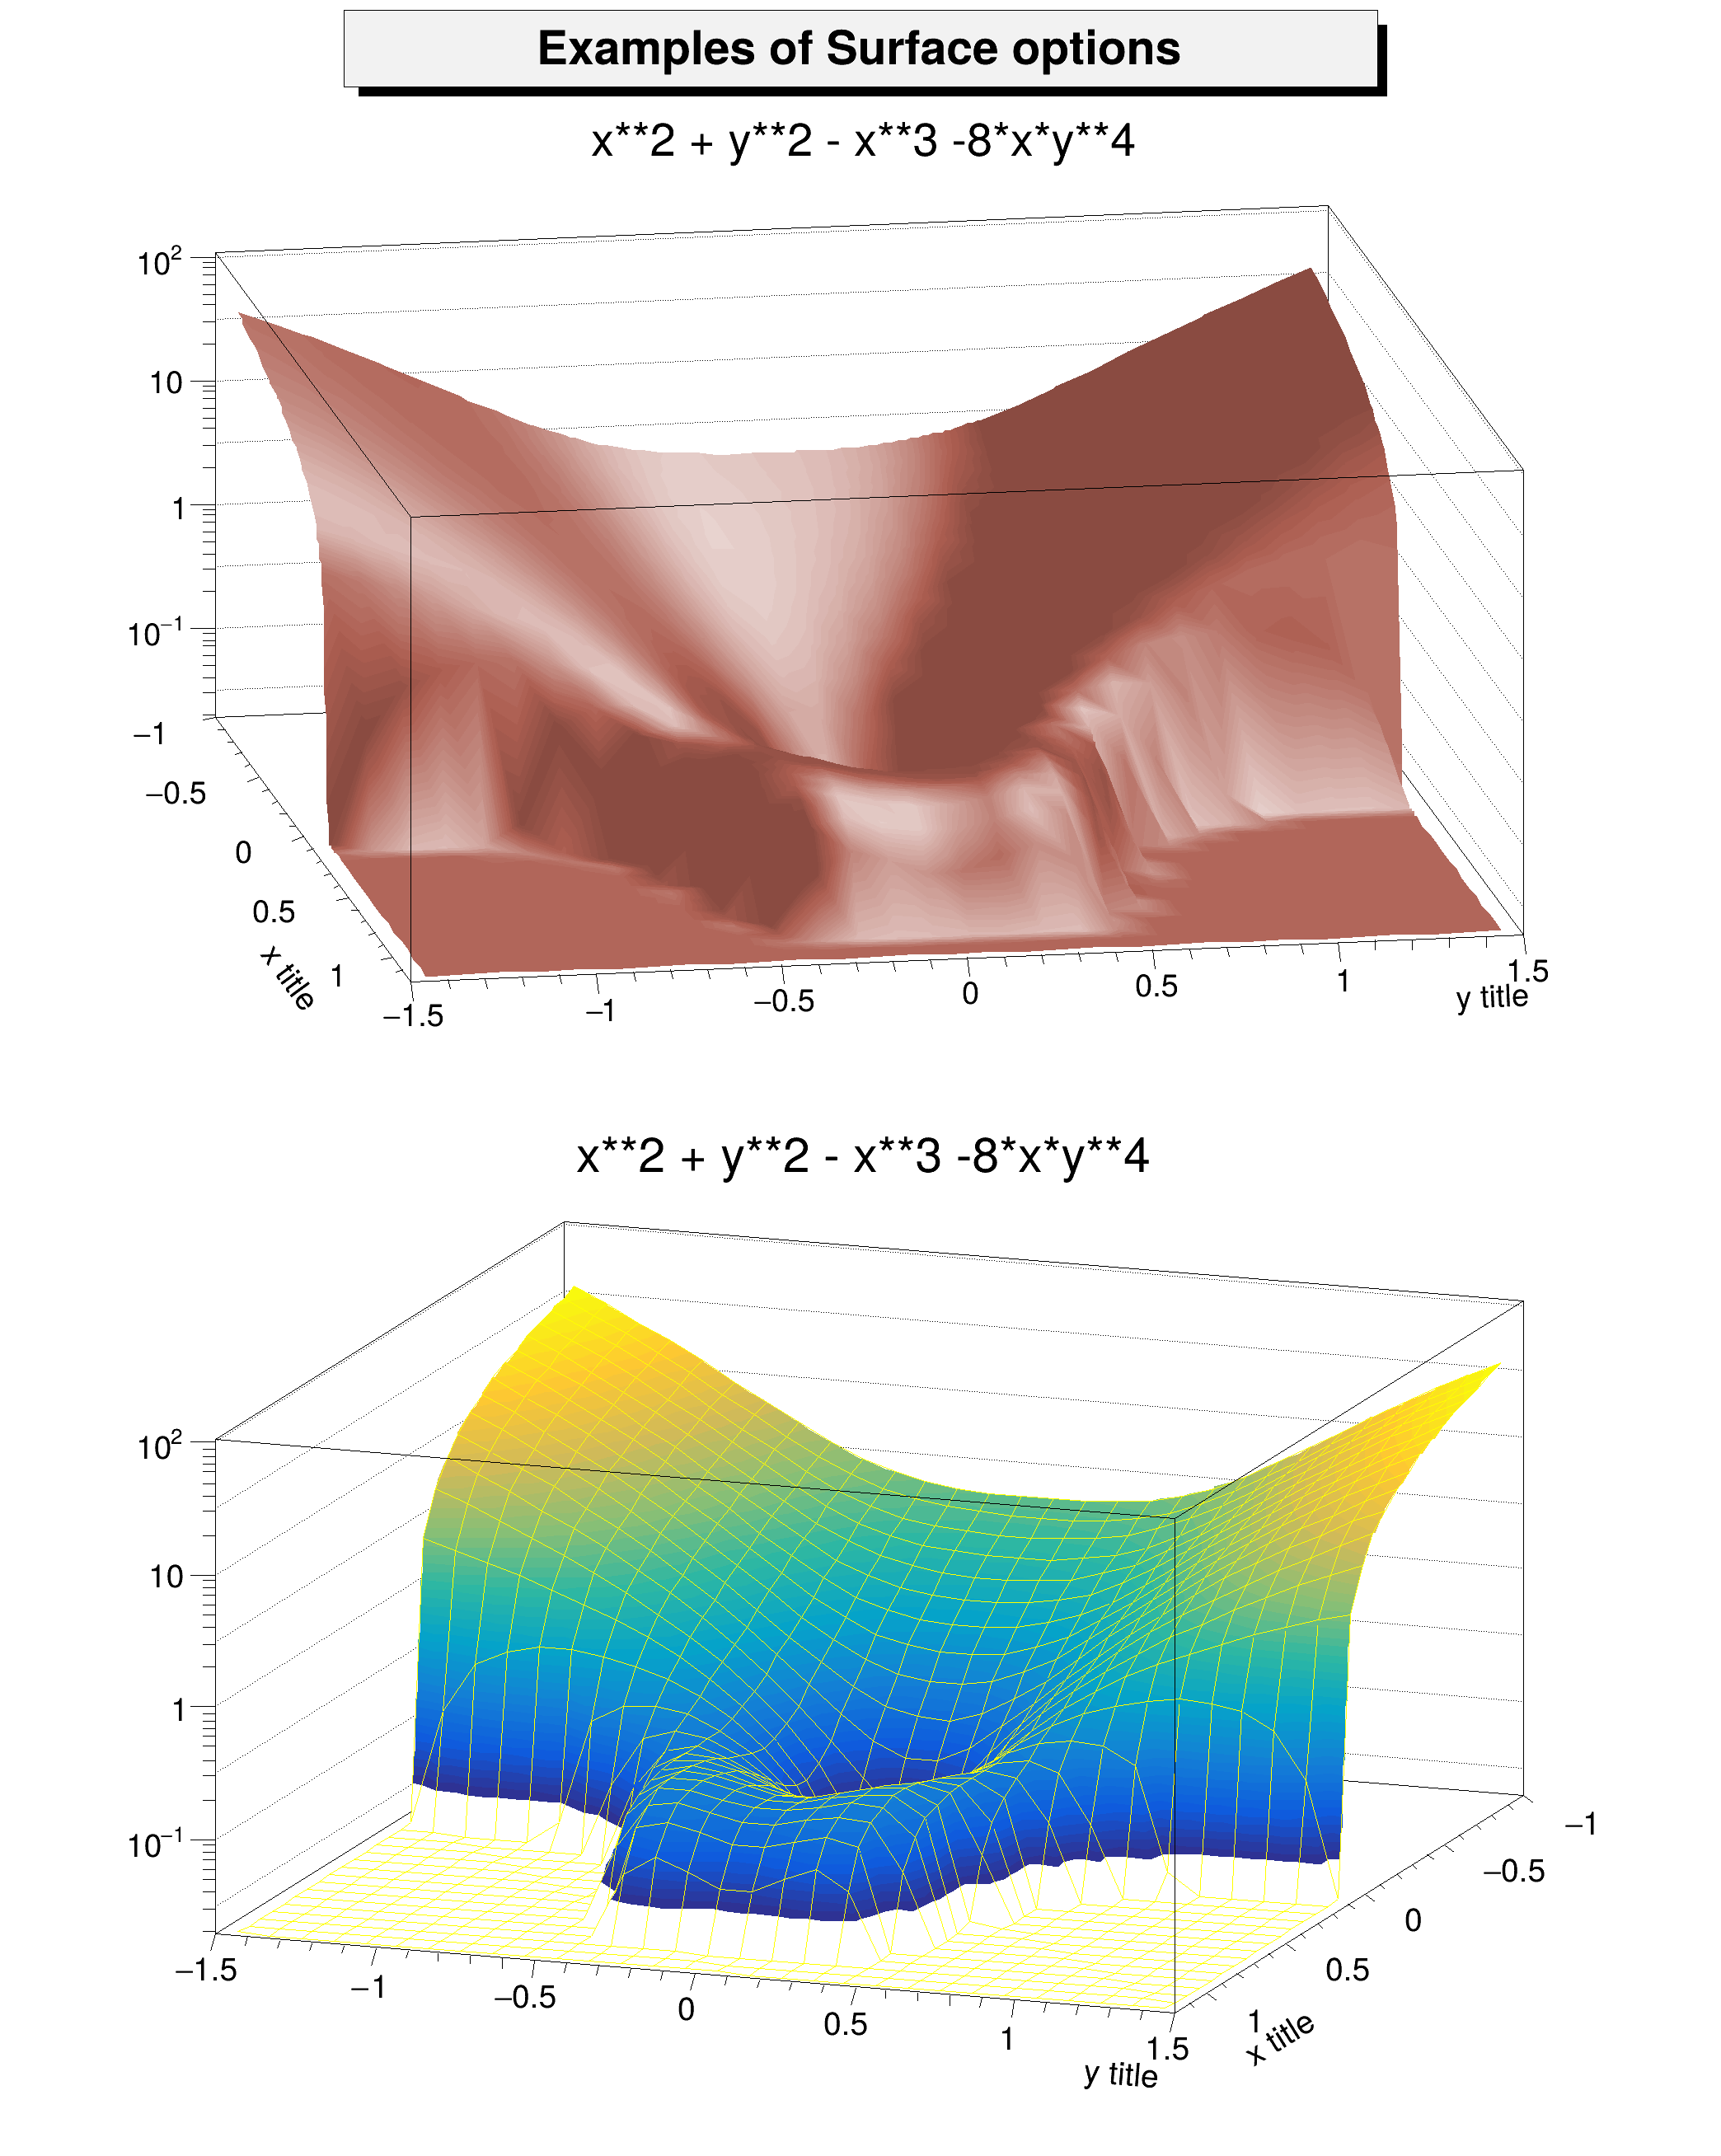 Draw 2-Dim functions. Draw 2-Dim functions. | |
| surfaces.py | |
| Surfaces example | |
| timeonaxis3.C | |
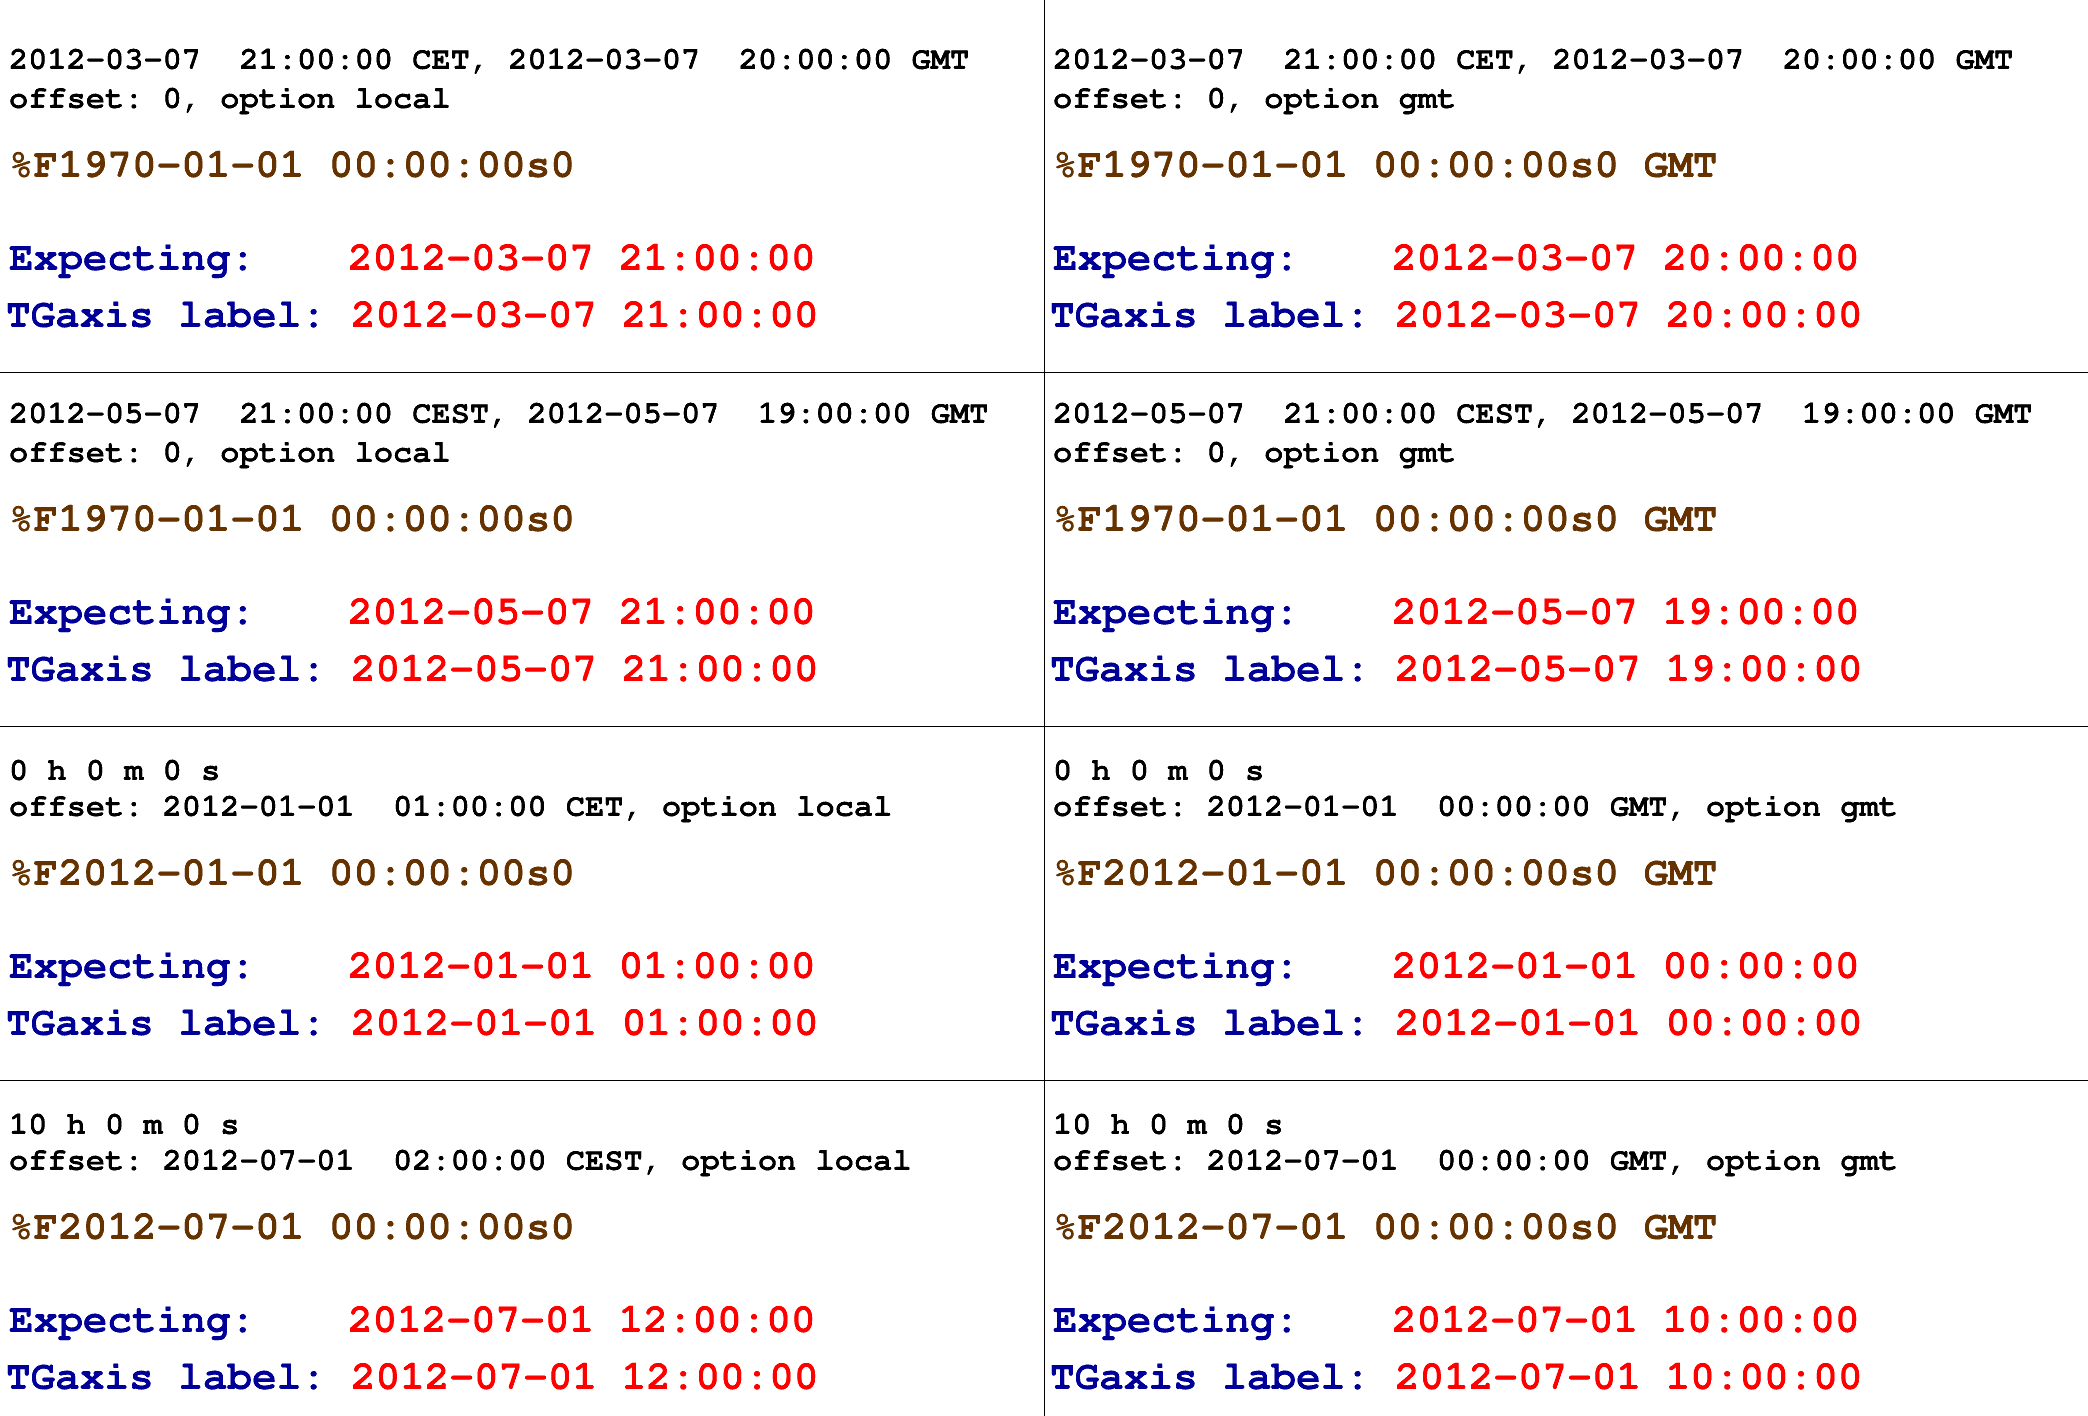 This example compares what the system time function gmtime and localtime give with what gives TGaxis. This example compares what the system time function gmtime and localtime give with what gives TGaxis. | |
| tmathtext.C | |
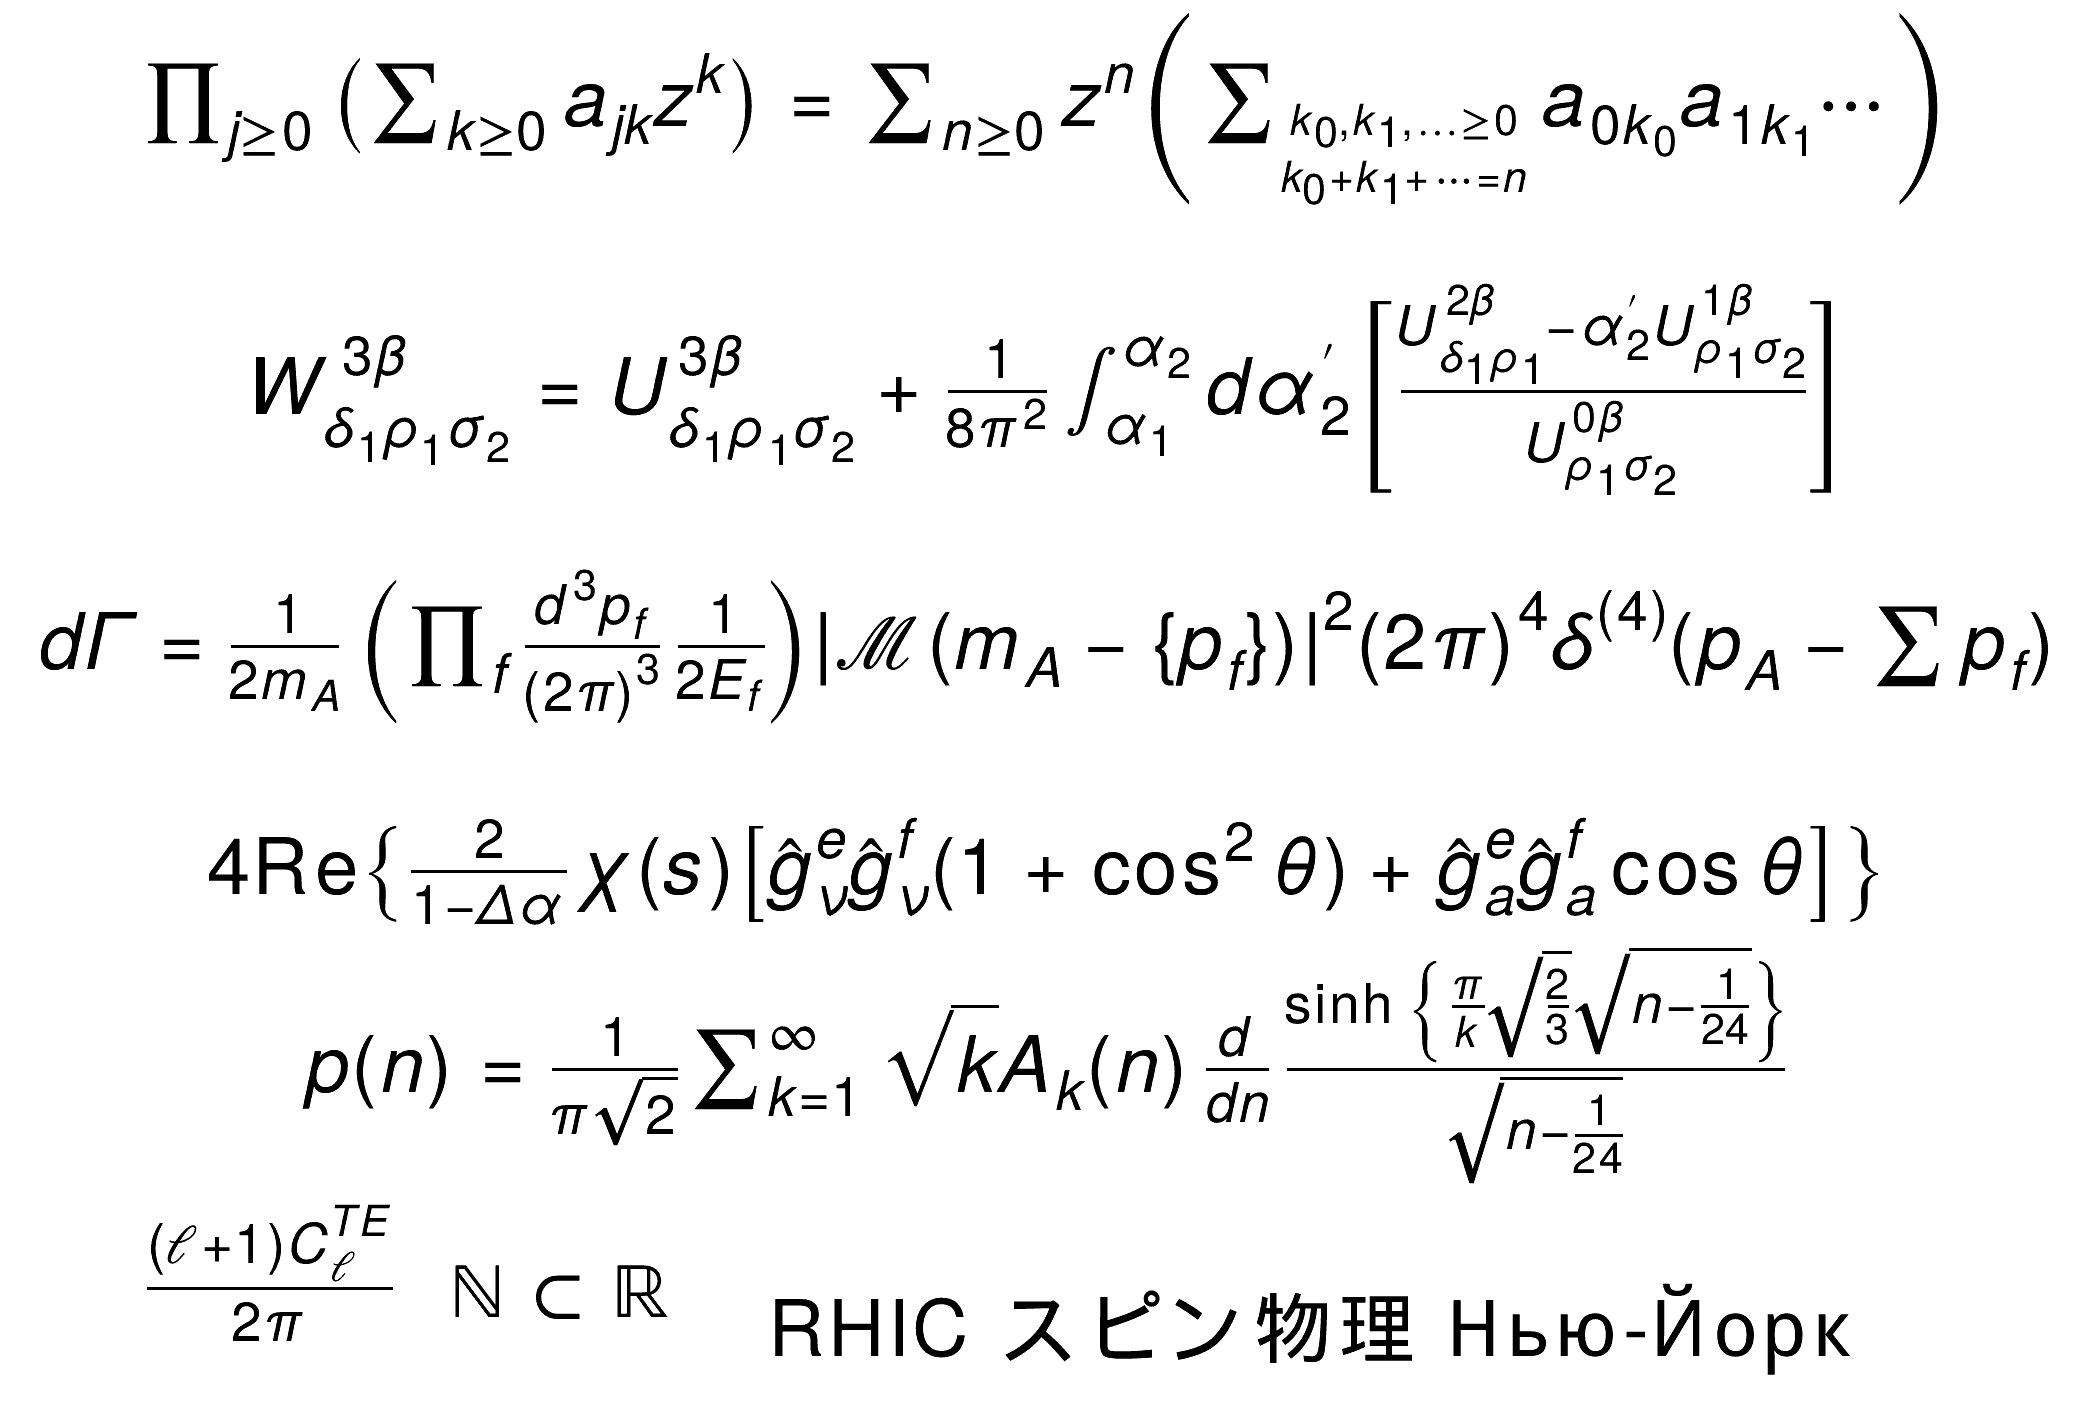 This macro draws various formula in a canvas. This macro draws various formula in a canvas. | |
| tmathtext2.C | |
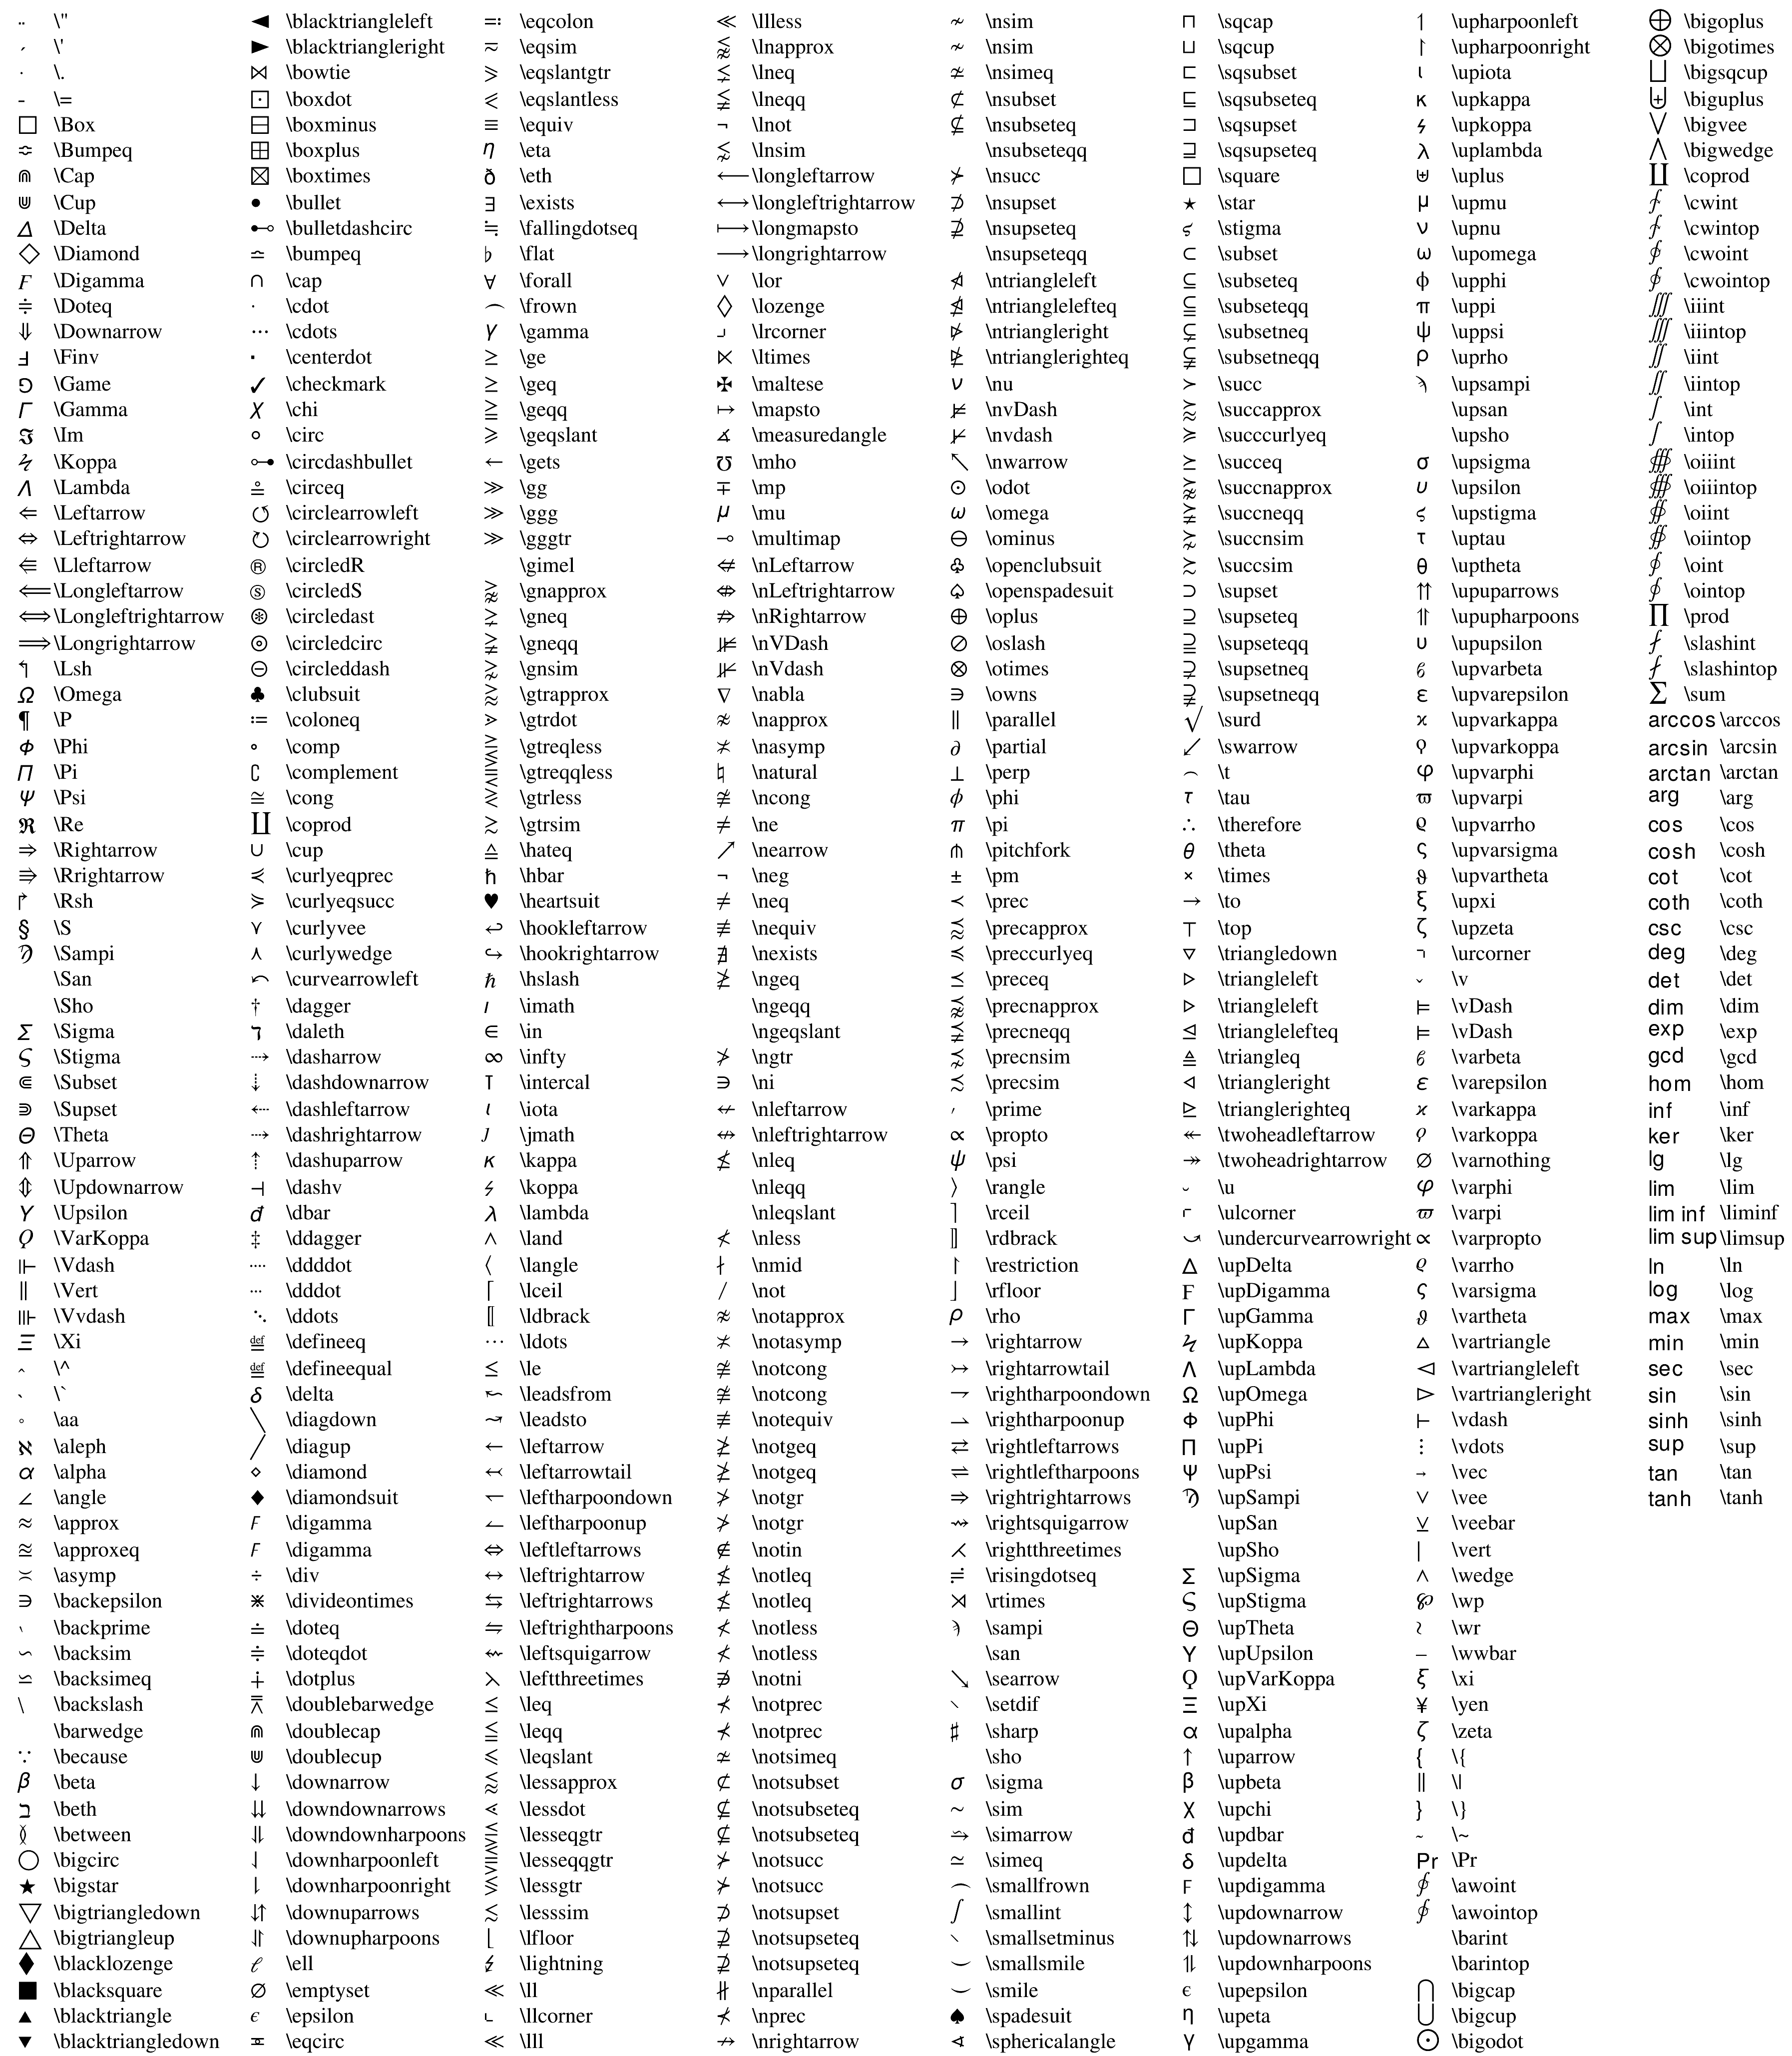 This macro draw all possible symbols provided by TMathtext. This macro draw all possible symbols provided by TMathtext. | |
| tornado.C | |
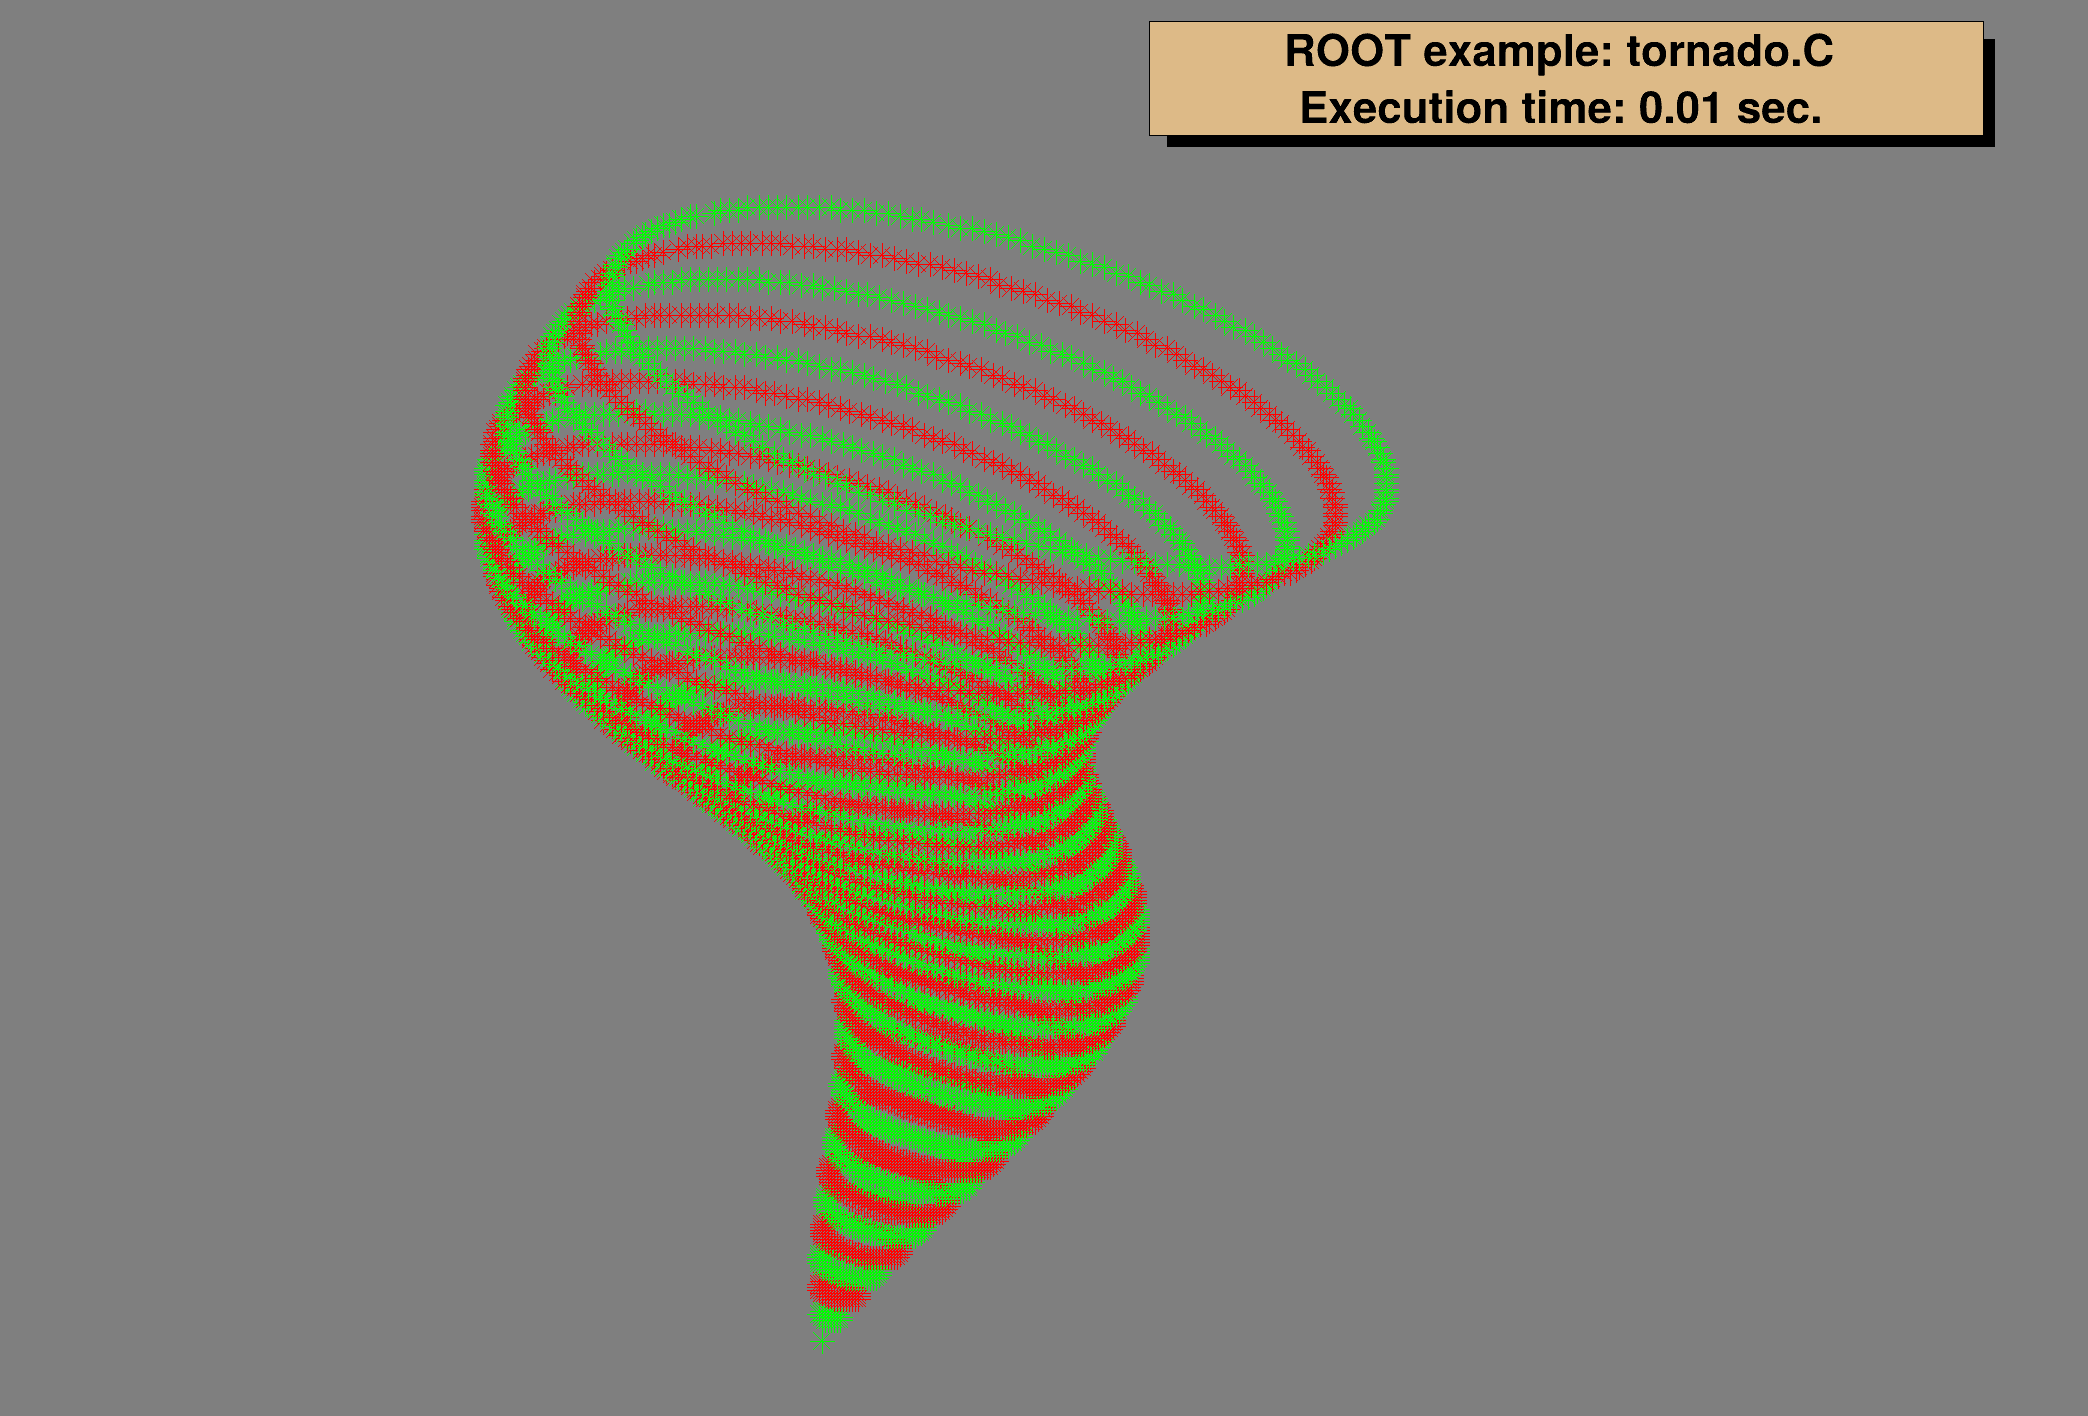 Show 3-d polymarker. Show 3-d polymarker. | |
| tornado.py | |
| Tornado example. | |
| transparency.C | |
| | |
| triangles.C | |
 Create small triangles at random positions on the canvas. Create small triangles at random positions on the canvas. | |
| xyplot.C | |
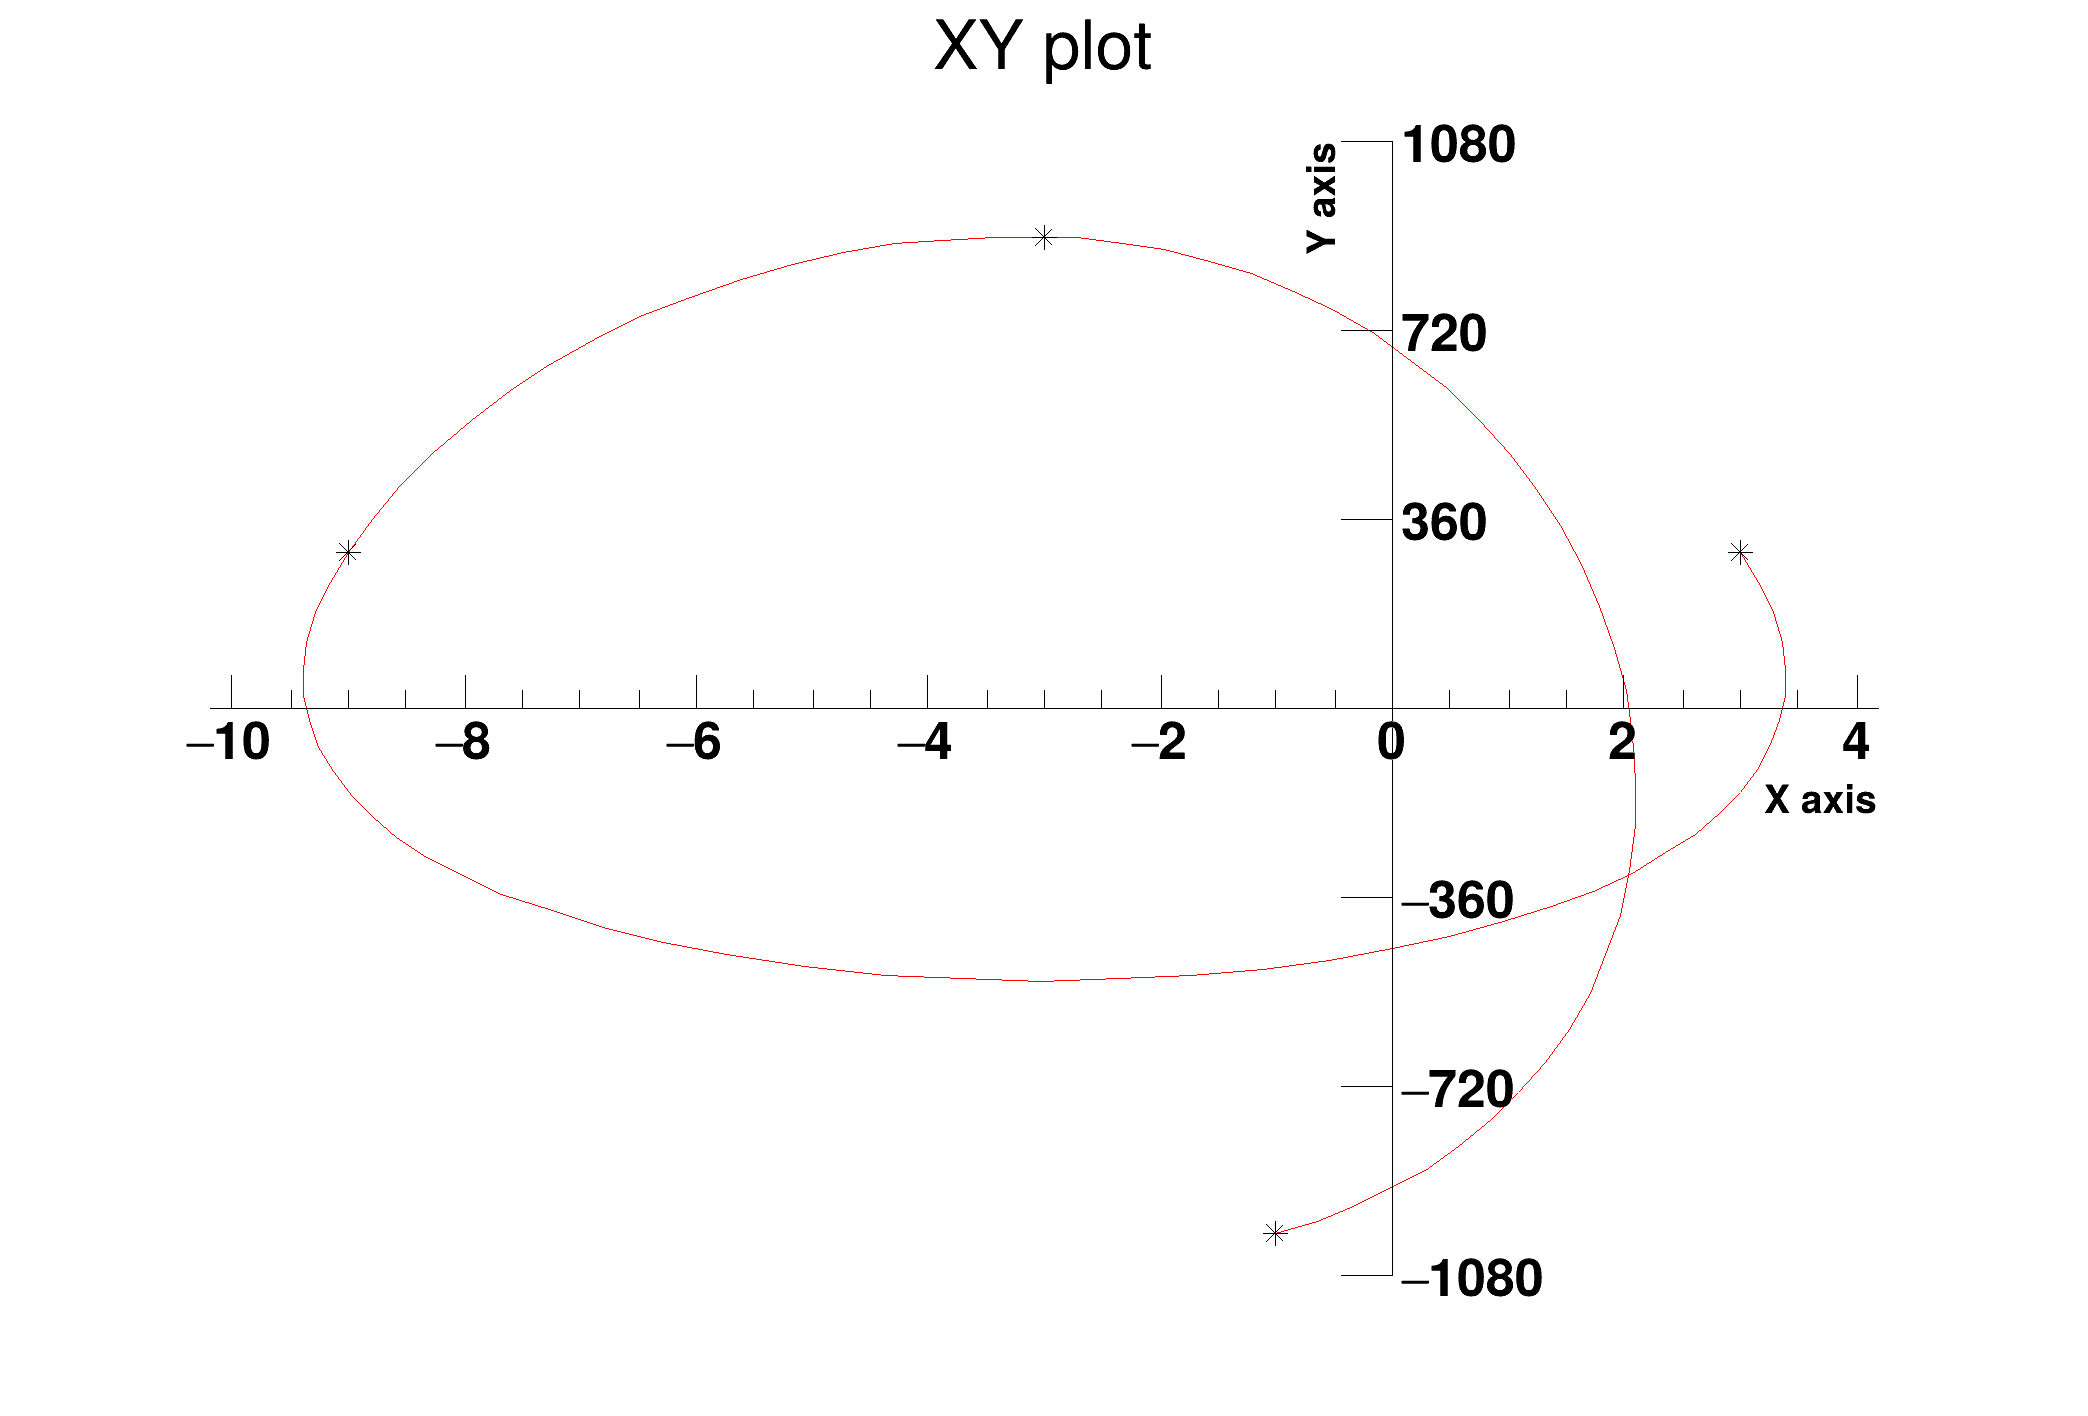 Example showing how to produce a plot with an orthogonal axis system centered at (0,0). Example showing how to produce a plot with an orthogonal axis system centered at (0,0). | |
