class TGraph2D: public TNamed, public TAttLine, public TAttFill, public TAttMarker


 A Graph2D is a graphics object made of three arrays X, Y and Z with the same
 number of points each.

 This class has different constructors:

 1) With an array's dimension and three arrays x, y, and z:

    TGraph2D *g = new TGraph2D(n, x, y, z);

    x, y, z arrays can be doubles, floats, or ints.

 2) With an array's dimension only:

    TGraph2D *g = new TGraph2D(n);

    The internal arrays are then filled with SetPoint. The following line
    fills the the internal arrays at the position "i" with the values x,y,z.

    g->SetPoint(i, x, y, z);

 3) Without parameters:

    TGraph2D *g = new TGraph2D();

    again SetPoint must be used to fill the internal arrays.

 4) From a file:

    TGraph2D *g = new TGraph2D("graph.dat");

    Arrays are read from the ASCII file "graph.dat" according to a specifies
    format. The format's default value is "%lg %lg %lg"

 Note that in any of these three cases, SetPoint can be used to change a data
 point or add a new one. If the data point index (i) is greater than the
 current size of the internal arrays, they are automatically extended.

 Specific drawing options can be used to paint a TGraph2D:
   "TRI"  : The Delaunay triangles are drawn using filled area.
            An hidden surface drawing technique is used. The surface is
            painted with the current fill area color. The edges of each
            triangles are painted with the current line color.
   "TRIW" : The Delaunay triangles are drawn as wire frame
   "TRI1" : The Delaunay triangles are painted with color levels. The edges
            of each triangles are painted with the current line color.
   "TRI2" : the Delaunay triangles are painted with color levels.
   "P"    : Draw a marker at each vertex
   "P0"   : Draw a circle at each vertex. Each circle background is white.

 A TGraph2D can be also drawn with ANY options valid to draw a 2D histogram.

 When a TGraph2D is drawn with one of the 2D histogram drawing option,
 a intermediate 2D histogram is filled using the Delaunay triangles
 technique to interpolate the data set.

 TGraph2D linearly interpolate a Z value for any (X,Y) point given some
 existing (X,Y,Z) points. The existing (X,Y,Z) points can be randomly
 scattered. The algorithm works by joining the existing points to make
 Delaunay triangles in (X,Y). These are then used to define flat planes
 in (X,Y,Z) over which to interpolate. The interpolated surface thus takes
 the form of tessellating triangles at various angles. Output can take the
 form of a 2D histogram or a vector. The triangles found can be drawn in 3D.

 This software cannot be guaranteed to work under all circumstances. They
 were originally written to work with a few hundred points in an XY space
 with similar X and Y ranges.

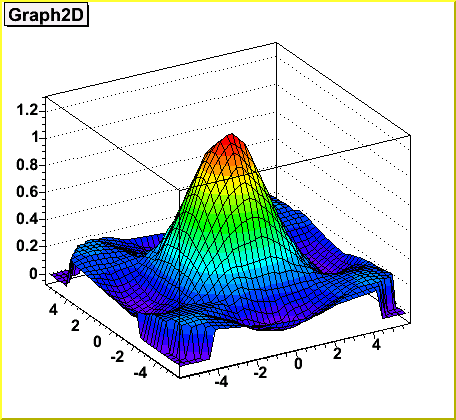
  The picture below has been generated by the following macro:

{
   TCanvas *c = new TCanvas("c","Graph2D example",0,0,700,600);
   Double_t x, y, z, P = 6.;
   Int_t np = 200;
   TGraph2D *dt = new TGraph2D();
   TRandom *r = new TRandom();
   for (Int_t N=0; N<np; N++) {
      x = 2*P*(r->Rndm(N))-P;
      y = 2*P*(r->Rndm(N))-P;
      z = (sin(x)/x)*(sin(y)/y)+0.2;
      dt->SetPoint(N,x,y,z);
   }
   gStyle->SetPalette(1);
   dt->Draw("surf1");
}

/* */
 A more complete example can be find in $ROOTSYS/tutorial/graph2dfit.C. It
 produces the following output:


/* */

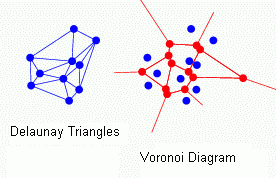
 Definition of Delaunay triangulation (After B. Delaunay):
 For a set S of points in the Euclidean plane, the unique triangulation DT(S)
 of S such that no point in S is inside the circumcircle of any triangle in
 DT(S). DT(S) is the dual of the Voronoi diagram of S.
 If n is the number of points in S, the Voronoi diagram of S is the partitioning
 of the plane containing S points into n convex polygons such that each polygon
 contains exactly one point and every point in a given polygon is closer to its
 central point than to any other. A Voronoi diagram is sometimes also known as
 a Dirichlet tessellation.

/*
This applet gives a nice practical view of Delaunay triangulation and Voronoi diagram. */

Function Members (Methods)

public:
TGraph2D()
TGraph2D(Int_t n)
TGraph2D(TH2* h2)
TGraph2D(const TGraph2D&)
TGraph2D(const char* filename, const char* format = "%lg %lg %lg", Option_t* option = "")
TGraph2D(Int_t n, Int_t* x, Int_t* y, Int_t* z)
TGraph2D(Int_t n, Float_t* x, Float_t* y, Float_t* z)
TGraph2D(Int_t n, Double_t* x, Double_t* y, Double_t* z)
TGraph2D(const char* name, const char* title, Int_t n, Double_t* x, Double_t* y, Double_t* z)
virtual~TGraph2D()
voidTObject::AbstractMethod(const char* method) const
virtual voidTObject::AppendPad(Option_t* option = "")
virtual voidTObject::Browse(TBrowser* b)
static TClass*Class()
virtual const char*TObject::ClassName() const
virtual voidClear(Option_t* option = "")
virtual TObject*TNamed::Clone(const char* newname = "") const
virtual Int_tTNamed::Compare(const TObject* obj) const
virtual voidTNamed::Copy(TObject& named) const
virtual voidTObject::Delete(Option_t* option = "")MENU
virtual voidDirectoryAutoAdd(TDirectory*)
Int_tTAttLine::DistancetoLine(Int_t px, Int_t py, Double_t xp1, Double_t yp1, Double_t xp2, Double_t yp2)
virtual Int_tDistancetoPrimitive(Int_t px, Int_t py)
virtual voidDraw(Option_t* option = "")
virtual voidTObject::DrawClass() constMENU
virtual TObject*TObject::DrawClone(Option_t* option = "") constMENU
virtual voidTObject::Dump() constMENU
virtual voidTObject::Error(const char* method, const char* msgfmt) const
virtual voidTObject::Execute(const char* method, const char* params, Int_t* error = 0)
virtual voidTObject::Execute(TMethod* method, TObjArray* params, Int_t* error = 0)
virtual voidExecuteEvent(Int_t event, Int_t px, Int_t py)
virtual voidTObject::Fatal(const char* method, const char* msgfmt) const
virtual voidTNamed::FillBuffer(char*& buffer)
virtual TObject*FindObject(const char* name) const
virtual TObject*FindObject(const TObject* obj) const
virtual Int_tFit(const char* formula, Option_t* option = "", Option_t* goption = "")MENU
virtual Int_tFit(TF2* f2, Option_t* option = "", Option_t* goption = "")MENU
TList*GetContourList(Double_t contour)
TDirectory*GetDirectory() const
virtual Option_t*TObject::GetDrawOption() const
static Long_tTObject::GetDtorOnly()
virtual Double_tGetErrorX(Int_t bin) const
virtual Double_tGetErrorY(Int_t bin) const
virtual Double_tGetErrorZ(Int_t bin) const
virtual Double_t*GetEX() const
virtual Double_t*GetEY() const
virtual Double_t*GetEZ() const
virtual Color_tTAttFill::GetFillColor() const
virtual Style_tTAttFill::GetFillStyle() const
TH2D*GetHistogram(Option_t* option = "")
virtual const char*TObject::GetIconName() const
virtual Color_tTAttLine::GetLineColor() const
virtual Style_tTAttLine::GetLineStyle() const
virtual Width_tTAttLine::GetLineWidth() const
TList*GetListOfFunctions() const
Double_tGetMargin() const
virtual Color_tTAttMarker::GetMarkerColor() const
virtual Size_tTAttMarker::GetMarkerSize() const
virtual Style_tTAttMarker::GetMarkerStyle() const
Int_tGetN() const
virtual const char*TNamed::GetName() const
Int_tGetNpx() const
Int_tGetNpy() const
virtual char*TObject::GetObjectInfo(Int_t px, Int_t py) const
static Bool_tTObject::GetObjectStat()
virtual Option_t*TObject::GetOption() const
virtual const char*TNamed::GetTitle() const
virtual UInt_tTObject::GetUniqueID() const
Double_t*GetX() const
TAxis*GetXaxis() const
Double_tGetXmax() const
Double_tGetXmin() const
Double_t*GetY() const
TAxis*GetYaxis() const
Double_tGetYmax() const
Double_tGetYmin() const
Double_t*GetZ() const
TAxis*GetZaxis() const
Double_tGetZmax() const
Double_tGetZmin() const
virtual Bool_tTObject::HandleTimer(TTimer* timer)
virtual ULong_tTNamed::Hash() const
virtual voidTObject::Info(const char* method, const char* msgfmt) const
virtual Bool_tTObject::InheritsFrom(const char* classname) const
virtual Bool_tTObject::InheritsFrom(const TClass* cl) const
virtual voidTObject::Inspect() constMENU
Double_tInterpolate(Double_t x, Double_t y)
voidTObject::InvertBit(UInt_t f)
virtual TClass*IsA() const
virtual Bool_tTObject::IsEqual(const TObject* obj) const
virtual Bool_tTObject::IsFolder() const
Bool_tTObject::IsOnHeap() const
virtual Bool_tTNamed::IsSortable() const
virtual Bool_tTAttFill::IsTransparent() const
Bool_tTObject::IsZombie() const
virtual voidTNamed::ls(Option_t* option = "") const
voidTObject::MayNotUse(const char* method) const
virtual voidTAttLine::Modify()
virtual Bool_tTObject::Notify()
static voidTObject::operator delete(void* ptr)
static voidTObject::operator delete(void* ptr, void* vp)
static voidTObject::operator delete[](void* ptr)
static voidTObject::operator delete[](void* ptr, void* vp)
void*TObject::operator new(size_t sz)
void*TObject::operator new(size_t sz, void* vp)
void*TObject::operator new[](size_t sz)
void*TObject::operator new[](size_t sz, void* vp)
TGraph2D&operator=(const TGraph2D&)
virtual voidPaint(Option_t* option = "")
virtual voidTObject::Pop()
virtual voidTNamed::Print(Option_t* option = "") const
TH1*Project(Option_t* option = "x") constMENU
virtual Int_tTObject::Read(const char* name)
virtual voidTObject::RecursiveRemove(TObject* obj)
Int_tRemovePoint(Int_t ipoint)MENU
virtual voidTAttFill::ResetAttFill(Option_t* option = "")
virtual voidTAttLine::ResetAttLine(Option_t* option = "")
virtual voidTAttMarker::ResetAttMarker(Option_t* toption = "")
voidTObject::ResetBit(UInt_t f)
virtual voidTObject::SaveAs(const char* filename = "", Option_t* option = "") constMENU
virtual voidTAttFill::SaveFillAttributes(ostream& out, const char* name, Int_t coldef = 1, Int_t stydef = 1001)
virtual voidTAttLine::SaveLineAttributes(ostream& out, const char* name, Int_t coldef = 1, Int_t stydef = 1, Int_t widdef = 1)
virtual voidTAttMarker::SaveMarkerAttributes(ostream& out, const char* name, Int_t coldef = 1, Int_t stydef = 1, Int_t sizdef = 1)
virtual voidSavePrimitive(ostream& out, Option_t* option = "")
virtual voidSet(Int_t n)
voidTObject::SetBit(UInt_t f)
voidTObject::SetBit(UInt_t f, Bool_t set)
virtual voidSetDirectory(TDirectory* dir)
virtual voidTObject::SetDrawOption(Option_t* option = "")MENU
static voidTObject::SetDtorOnly(void* obj)
virtual voidTAttFill::SetFillAttributes()MENU
virtual voidTAttFill::SetFillColor(Color_t fcolor)
virtual voidTAttFill::SetFillStyle(Style_t fstyle)
virtual voidSetHistogram(TH2* h)
virtual voidTAttLine::SetLineAttributes()MENU
virtual voidTAttLine::SetLineColor(Color_t lcolor)
virtual voidTAttLine::SetLineStyle(Style_t lstyle)
virtual voidTAttLine::SetLineWidth(Width_t lwidth)
voidSetMargin(Double_t m = 0.1)MENU
voidSetMarginBinsContent(Double_t z = 0.)MENU
virtual voidTAttMarker::SetMarkerAttributes()MENU
virtual voidTAttMarker::SetMarkerColor(Color_t tcolor = 1)
virtual voidTAttMarker::SetMarkerSize(Size_t msize = 1)
virtual voidTAttMarker::SetMarkerStyle(Style_t mstyle = 1)
voidSetMaximum(Double_t maximum = -1111)MENU
voidSetMaxIter(Int_t n = 100000)MENU
voidSetMinimum(Double_t minimum = -1111)MENU
virtual voidSetName(const char* name)MENU
virtual voidSetNameTitle(const char* name, const char* title)
voidSetNpx(Int_t npx = 40)MENU
voidSetNpy(Int_t npx = 40)MENU
static voidTObject::SetObjectStat(Bool_t stat)
voidSetPoint(Int_t point, Double_t x, Double_t y, Double_t z)MENU
virtual voidSetTitle(const char* title = "")MENU
virtual voidTObject::SetUniqueID(UInt_t uid)
virtual voidShowMembers(TMemberInspector& insp, char* parent)
virtual Int_tTNamed::Sizeof() const
virtual voidStreamer(TBuffer& b)
voidStreamerNVirtual(TBuffer& b)
virtual voidTObject::SysError(const char* method, const char* msgfmt) const
Bool_tTObject::TestBit(UInt_t f) const
Int_tTObject::TestBits(UInt_t f) const
virtual voidTObject::UseCurrentStyle()
virtual voidTObject::Warning(const char* method, const char* msgfmt) const
virtual Int_tTObject::Write(const char* name = 0, Int_t option = 0, Int_t bufsize = 0)
virtual Int_tTObject::Write(const char* name = 0, Int_t option = 0, Int_t bufsize = 0) const
protected:
voidBuild(Int_t n)
virtual voidTObject::DoError(int level, const char* location, const char* fmt, va_list va) const
voidTObject::MakeZombie()

Data Members

public:
enum TObject::EStatusBits { kCanDelete
kMustCleanup
kObjInCanvas
kIsReferenced
kHasUUID
kCannotPick
kNoContextMenu
kInvalidObject
};
enum TObject::[unnamed] { kIsOnHeap
kNotDeleted
kZombie
kBitMask
kSingleKey
kOverwrite
kWriteDelete
};
protected:
TDirectory*fDirectory!Pointer to directory holding this 2D graph
Color_tTAttFill::fFillColorfill area color
Style_tTAttFill::fFillStylefill area style
TList*fFunctionsPointer to list of functions (fits and user)
TH2D*fHistogram!2D histogram of z values linearly interpolated
Color_tTAttLine::fLineColorline color
Style_tTAttLine::fLineStyleline style
Width_tTAttLine::fLineWidthline width
Double_tfMarginExtra space (in %) around interpolated area for fHistogram
Color_tTAttMarker::fMarkerColorMarker color index
Size_tTAttMarker::fMarkerSizeMarker size
Style_tTAttMarker::fMarkerStyleMarker style
Int_tfMaxIterMaximum number of iterations to find Delaunay t>
Double_tfMaximumMaximum value for plotting along z
Double_tfMinimumMinimum value for plotting along z
TStringTNamed::fNameobject identifier
Int_tfNpointsNumber of points in the data set
Int_tfNpxNumber of bins along X in fHistogram
Int_tfNpyNumber of bins along Y in fHistogram
TVirtualHistPainter*fPainter!pointer to histogram painter
Int_tfSize!Real size of fX, fY and fZ
TStringTNamed::fTitleobject title
Double_t*fX[fNpoints]
Double_t*fY[fNpoints] Data set to be plotted
Double_t*fZ[fNpoints]
Double_tfZoutfHistogram bin height for points lying outside the interpolated area
private:
Bool_tfUserHistoTrue when SetHistogram has been called

Class Charts

Inheritance Inherited Members Includes Libraries
Class Charts

Function documentation

TGraph2D()
 Graph2D default constructor
TGraph2D(Int_t n, Int_t *x, Int_t *y, Int_t *z)
 Graph2D constructor with three vectors of ints as input.
TGraph2D(Int_t n, Float_t *x, Float_t *y, Float_t *z)
 Graph2D constructor with three vectors of floats as input.
TGraph2D(Int_t n, Double_t *x, Double_t *y, Double_t *z)
 Graph2D constructor with three vectors of doubles as input.
TGraph2D(TH2 *h2)
 Graph2D constructor with a TH2 (h2) as input.
 Only the h2's bins within the X and Y axis ranges are used.
TGraph2D(const char* name, const char* title, Int_t n, Double_t* x, Double_t* y, Double_t* z)
 Graph2D constructor with name, title and three vectors of doubles as input.
 name   : name of 2D graph (avoid blanks)
 title  : 2D graph title
          if title is of the form "stringt;stringx;stringy;stringz"
          the 2D graph title is set to stringt, the x axis title to stringy,
          the y axis title to stringy,etc
TGraph2D(Int_t n)
 Graph2D constructor. The arrays fX, fY and fZ should be filled via
 calls to SetPoint
TGraph2D(const char* filename, const char* format = "%lg %lg %lg", Option_t* option = "")
 Graph2D constructor reading input from filename
 filename is assumed to contain at least three columns of numbers
TGraph2D(const TGraph2D &g)
 Graph2D copy constructor.
~TGraph2D()
 TGraph2D destructor.
TGraph2D& operator=(const TGraph2D& )
 Graph2D operator "="
void Build(Int_t n)
 Creates the 2D graph basic data structure
void Clear(Option_t* option = "")
 Free all memory allocated by this object.
void DirectoryAutoAdd(TDirectory* )
 Perform the automatic addition of the graph to the given directory

 Note this function is called in place when the semantic requires
 this object to be added to a directory (I.e. when being read from
 a TKey or being Cloned)

Int_t DistancetoPrimitive(Int_t px, Int_t py)
 Computes distance from point px,py to a graph
void Draw(Option_t* option = "")
 Specific drawing options can be used to paint a TGraph2D:

   "TRI"  : The Delaunay triangles are drawn using filled area.
            An hidden surface drawing technique is used. The surface is
            painted with the current fill area color. The edges of each
            triangles are painted with the current line color.
   "TRIW" : The Delaunay triangles are drawn as wire frame
   "TRI1" : The Delaunay triangles are painted with color levels. The edges
            of each triangles are painted with the current line color.
   "TRI2" : the Delaunay triangles are painted with color levels.
   "P"    : Draw a marker at each vertex
   "P0"   : Draw a circle at each vertex. Each circle background is white.
   "PCOL" : Draw a marker at each vertex. The color of each marker is
            defined according to its Z position.
   "CONT" : Draw contours
   "LINE" : Draw a 3D polyline

 A TGraph2D can be also drawn with ANY options valid to draw a 2D histogram.

 When a TGraph2D is drawn with one of the 2D histogram drawing option,
 a intermediate 2D histogram is filled using the Delaunay triangles
 technique to interpolate the data set.
void ExecuteEvent(Int_t event, Int_t px, Int_t py)
 Executes action corresponding to one event
TObject * FindObject(const char *name)
 search object named name in the list of functions
TObject * FindObject(const TObject *obj)
 search object obj in the list of functions
Int_t Fit(const char *fname, Option_t *option, Option_t *)
 Fits this graph with function with name fname
 Predefined functions such as gaus, expo and poln are automatically
 created by ROOT.
 fname can also be a formula, accepted by the linear fitter (linear parts divided
 by "++" sign), for example "x++sin(y)" for fitting "[0]*x+[1]*sin(y)"
Int_t Fit(TF2 *f2, Option_t *option, Option_t *)
 Fits this 2D graph with function f2

  f2 is an already predefined function created by TF2.
  Predefined functions such as gaus, expo and poln are automatically
  created by ROOT.

  The list of fit options is given in parameter option.
     option = "W" Set all weights to 1; ignore error bars
            = "U" Use a User specified fitting algorithm (via SetFCN)
            = "Q" Quiet mode (minimum printing)
            = "V" Verbose mode (default is between Q and V)
            = "R" Use the Range specified in the function range
            = "N" Do not store the graphics function, do not draw
            = "0" Do not plot the result of the fit. By default the fitted function
                  is drawn unless the option"N" above is specified.
            = "+" Add this new fitted function to the list of fitted functions
                  (by default, any previous function is deleted)
            = "C" In case of linear fitting, not calculate the chisquare
                  (saves time)
            = "ROB" In case of linear fitting, compute the LTS regression
                     coefficients (robust(resistant) regression), using
                     the default fraction of good points
              "ROB=0.x" - compute the LTS regression coefficients, using
                           0.x as a fraction of good points

  In order to use the Range option, one must first create a function
  with the expression to be fitted. For example, if your graph2d
  has a defined range between -4 and 4 and you want to fit a gaussian
  only in the interval 1 to 3, you can do:
       TF2 *f2 = new TF2("f2","gaus",1,3);
       graph2d->Fit("f2","R");


  Setting initial conditions

  Parameters must be initialized before invoking the Fit function.
  The setting of the parameter initial values is automatic for the
  predefined functions : poln, expo, gaus. One can however disable
  this automatic computation by specifying the option "B".
  You can specify boundary limits for some or all parameters via
       f2->SetParLimits(p_number, parmin, parmax);
  if parmin>=parmax, the parameter is fixed
  Note that you are not forced to fix the limits for all parameters.
  For example, if you fit a function with 6 parameters, you can do:
    func->SetParameters(0,3.1,1.e-6,0.1,-8,100);
    func->SetParLimits(4,-10,-4);
    func->SetParLimits(5, 1,1);
  With this setup, parameters 0->3 can vary freely
  Parameter 4 has boundaries [-10,-4] with initial value -8
  Parameter 5 is fixed to 100.

  Fit range

  The fit range can be specified in two ways:
    - specify rxmax > rxmin (default is rxmin=rxmax=0)
    - specify the option "R". In this case, the function will be taken
      instead of the full graph range.

  Changing the fitting function

  By default the fitting function Graph2DFitChisquare is used.
  To specify a User defined fitting function, specify option "U" and
  call the following functions:
    TVirtualFitter::Fitter(mygraph)->SetFCN(MyFittingFunction)
  where MyFittingFunction is of type:
  extern void MyFittingFunction(Int_t &npar, Double_t *gin, Double_t &f, Double_t *u, Int_t flag);

  Associated functions

  One or more object (typically a TF2*) can be added to the list
  of functions (fFunctions) associated to each graph.
  When TGraph::Fit is invoked, the fitted function is added to this list.
  Given a graph gr, one can retrieve an associated function
  with:  TF2 *myfunc = gr->GetFunction("myfunc");

  Access to the fit results

  If the graph is made persistent, the list of
  associated functions is also persistent. Given a pointer (see above)
  to an associated function myfunc, one can retrieve the function/fit
  parameters with calls such as:
    Double_t chi2 = myfunc->GetChisquare();
    Double_t par0 = myfunc->GetParameter(0); //value of 1st parameter
    Double_t err0 = myfunc->GetParError(0);  //error on first parameter

  Fit Statistics

  You can change the statistics box to display the fit parameters with
  the TStyle::SetOptFit(mode) method. This mode has four digits.
  mode = pcev  (default = 0111)
    v = 1;  print name/values of parameters
    e = 1;  print errors (if e=1, v must be 1)
    c = 1;  print Chisquare/Number of degress of freedom
    p = 1;  print Probability

  For example: gStyle->SetOptFit(1011);
  prints the fit probability, parameter names/values, and errors.
  You can change the position of the statistics box with these lines
  (where g is a pointer to the TGraph):

  Root > TPaveStats *st = (TPaveStats*)g->GetListOfFunctions()->FindObject("stats")
  Root > st->SetX1NDC(newx1); //new x start position
  Root > st->SetX2NDC(newx2); //new x end position
TAxis * GetXaxis()
 Get x axis of the graph.
TAxis * GetYaxis()
 Get y axis of the graph.
TAxis * GetZaxis()
 Get z axis of the graph.
TList * GetContourList(Double_t contour)
 Returns the X and Y graphs building a contour. A contour level may
 consist in several parts not connected to each other. This function
 returns them in a graphs' list.
Double_t GetErrorX(Int_t bin) const
 This function is called by Graph2DFitChisquare.
 It always returns a negative value. Real implementation in TGraph2DErrors
Double_t GetErrorY(Int_t bin) const
 This function is called by Graph2DFitChisquare.
 It always returns a negative value. Real implementation in TGraph2DErrors
Double_t GetErrorZ(Int_t bin) const
 This function is called by Graph2DFitChisquare.
 It always returns a negative value. Real implementation in TGraph2DErrors
TH2D * GetHistogram(Option_t* option = "")
 By default returns a pointer to the Delaunay histogram. If fHistogram
 doesn't exist, books the 2D histogram fHistogram with a margin around
 the hull. Calls TGraphDelaunay::Interpolate at each bin centre to build up
 an interpolated 2D histogram.
 If the "empty" option is selected, returns an empty histogram booked with
 the limits of fX, fY and fZ. This option is used when the data set is
 drawn with markers only. In that particular case there is no need to
 find the Delaunay triangles.
Double_t GetXmax()
 Returns the X maximum
Double_t GetXmin()
 Returns the X minimum
Double_t GetYmax()
 Returns the Y maximum
Double_t GetYmin()
 Returns the Y minimum
Double_t GetZmax()
 Returns the Z maximum
Double_t GetZmin()
 Returns the Z minimum
Double_t Interpolate(Double_t x, Double_t y)
 Finds the z value at the position (x,y) thanks to
 the Delaunay interpolation.
void Paint(Option_t* option = "")
 Paints this 2D graph with its current attributes
TH1 * Project(Option_t* option = "x") const
 Projects a 2-d graph into 1 or 2-d histograms depending on the
 option parameter
 option may contain a combination of the characters x,y,z
 option = "x" return the x projection into a TH1D histogram
 option = "y" return the y projection into a TH1D histogram
 option = "xy" return the x versus y projection into a TH2D histogram
 option = "yx" return the y versus x projection into a TH2D histogram
Int_t RemovePoint(Int_t ipoint)
 Deletes point number ipoint
void SavePrimitive(ostream& out, Option_t* option = "")
 Saves primitive as a C++ statement(s) on output stream out
void Set(Int_t n)
 Set number of points in the 2D graph.
 Existing coordinates are preserved.
 New coordinates above fNpoints are preset to 0.
void SetDirectory(TDirectory* dir)
 By default when an 2D graph is created, it is added to the list
 of 2D graph objects in the current directory in memory.
 Remove reference to this 2D graph from current directory and add
 reference to new directory dir. dir can be 0 in which case the
 2D graph does not belong to any directory.
void SetHistogram(TH2* h)
 Sets the histogram to be filled
void SetMargin(Double_t m = 0.1)
 Sets the extra space (in %) around interpolated area for the 2D histogram
void SetMarginBinsContent(Double_t z = 0.)
 Sets the histogram bin height for points lying outside the TGraphDelaunay
 convex hull ie: the bins in the margin.
void SetMaximum(Double_t maximum = -1111)
 Set maximum.
void SetMinimum(Double_t minimum = -1111)
 Set minimum.
void SetName(const char* name)
 Changes the name of this 2D graph
void SetNameTitle(const char* name, const char* title)
 Change the name and title of this 2D graph

void SetNpx(Int_t npx = 40)
 Sets the number of bins along X used to draw the function
void SetNpy(Int_t npx = 40)
 Sets the number of bins along Y used to draw the function
void SetPoint(Int_t point, Double_t x, Double_t y, Double_t z)
 Sets point number n.
 If n is greater than the current size, the arrays are automatically
 extended.
void SetTitle(const char* title = "")
 Sets graph title
void Streamer(TBuffer& b)
 Stream a class object
TDirectory * GetDirectory()
{return fDirectory;}
Int_t GetNpx()
{return fNpx;}
Int_t GetNpy()
{return fNpy;}
TList * GetListOfFunctions()
{ return fFunctions; }
Double_t GetMargin()
{return fMargin;}
Int_t GetN()
{return fNpoints;}
Double_t * GetX()
{return fX;}
Double_t * GetY()
{return fY;}
Double_t * GetZ()
{return fZ;}
Double_t * GetEX()
{return 0;}
Double_t * GetEY()
{return 0;}
Double_t * GetEZ()
{return 0;}
void SetMaxIter(Int_t n = 100000)
{fMaxIter = n;}

Author: Olivier Couet
Last change: root/hist:$Id: TGraph2D.h,v 1.00
Last generated: 2008-06-25 08:46
Copyright (C) 1995-2000, Rene Brun and Fons Rademakers. *

This page has been automatically generated. If you have any comments or suggestions about the page layout send a mail to ROOT support, or contact the developers with any questions or problems regarding ROOT.