void markerwarning()
{
const int Nph = 14;
double np_ph[Nph] = {353.4,300.2,254.3,215.2,181.0,151.3,125.2,102.7,
83.3, 66.7, 52.5, 40.2, 30.2, 22.0};
double nc_ph[Nph] = {3.890,3.734,3.592,3.453,3.342,3.247,3.151,3.047,
2.965,2.858,2.701,2.599,2.486,2.328};
double npe_ph[Nph] = {10.068,9.004,8.086,7.304,6.620,6.026,5.504,5.054,
4.666,4.334,4.050,3.804,3.604,3.440};
double nce_ph[Nph] = {0.235,0.217,0.210,0.206,0.213,0.223,0.239,0.260,
0.283,0.318,0.356,0.405,0.465,0.545};
const int Nbr = 6;
double np_br[Nbr] = {357.0,306.0,239.0,168.0,114.0, 73.0};
double nc_br[Nbr] = {3.501,3.275,3.155,3.060,3.053,3.014};
double npe_br[Nbr] = {8.000,11.000,10.000,9.000,9.000,8.000};
double nce_br[Nbr] = {0.318,0.311,0.306,0.319,0.370,0.429};
TGraphErrors *phUP = new TGraphErrors(Nph,np_ph,nc_ph,npe_ph,nce_ph);
TGraphErrors *phDN = new TGraphErrors(Nph,np_ph,nc_ph,npe_ph,nce_ph);
TGraphErrors *brUP = new TGraphErrors(Nbr,np_br,nc_br,npe_br,nce_br);
TGraphErrors *brDN = new TGraphErrors(Nbr,np_br,nc_br,npe_br,nce_br);
float Top_margin = 0.;
float Left_margin = 0.025;
float Right_margin = 0.005;
float maxPlotPart = 395;
float Marker_Size = 1.3;
int Marker_Style = 8;
float Et_200_Min = 0.71;
float Et_200_Max = 3.80;
float Et_130_Min = 1.21;
float Et_130_Max = 3.29;
float Nc_200_Min = 1.31;
float Nc_200_Max = 4.30;
float Nc_130_Min = 1.51;
float Nc_130_Max = 3.89;
TCanvas *canvasNc = new TCanvas("canvasNc", "Multiplicity",630,10,600,500);
gStyle->SetOptStat(0);
canvasNc->SetFillColor(10);
canvasNc->SetBorderSize(0);
TPad *padNcUP = new TPad("padNcUP","200 GeV",0.07,0.60,1.,1.00);
padNcUP->Draw();
padNcUP->cd();
padNcUP->SetFillColor(10);
padNcUP->SetFrameFillColor(10);
padNcUP->SetBorderSize(0);
padNcUP->SetLeftMargin(Left_margin);
padNcUP->SetRightMargin(Right_margin);
padNcUP->SetTopMargin(Top_margin+0.005);
padNcUP->SetBottomMargin(0.00);
TH1F* frameNcUP = new TH1F("frameNcUP","",100,0,maxPlotPart);
frameNcUP->GetYaxis()->SetLabelOffset(0.005);
frameNcUP->GetYaxis()->SetLabelSize(0.10);
frameNcUP->SetMinimum(Nc_200_Min);
frameNcUP->SetMaximum(Nc_200_Max);
frameNcUP->SetNdivisions(505,"Y");
frameNcUP->SetNdivisions(505,"X");
frameNcUP->Draw();
brUP->SetMarkerStyle(22);
brUP->SetMarkerSize (2.0);
brUP->Draw("P");
phDN->SetMarkerStyle(23);
phDN->SetMarkerSize (2);
phDN->Draw("P");
canvasNc->cd();
TPad *padNcDN = new TPad("padNcDN","130 GeV",0.07,0.02,1.,0.60);
padNcDN->Draw();
padNcDN->cd();
padNcDN->SetFillColor(10);
padNcDN->SetFrameFillColor(10);
padNcDN->SetBorderSize(0);
padNcDN->SetLeftMargin(Left_margin);
padNcDN->SetRightMargin(Right_margin);
padNcDN->SetTopMargin(Top_margin+0.005);
padNcDN->SetBottomMargin(0.30);
TH1F* frameNcDN = new TH1F("frameNcDN","",100,0,maxPlotPart);
frameNcDN->GetYaxis()->SetLabelOffset(0.005);
frameNcDN->GetYaxis()->SetLabelSize(0.07);
frameNcDN->GetXaxis()->SetLabelOffset(0.005);
frameNcDN->GetXaxis()->SetLabelSize(0.07);
frameNcDN->SetMinimum(Nc_200_Min);
frameNcDN->SetMaximum(Nc_200_Max);
frameNcDN->SetNdivisions(505,"Y");
frameNcDN->SetNdivisions(505,"X");
frameNcDN->Draw();
brDN->SetMarkerStyle(23);
brDN->SetMarkerSize (2.0);
brDN->Draw("P");
phUP->SetMarkerStyle(22);
phUP->SetMarkerSize (2);
phUP->Draw("P");
TLatex t1;
t1.SetTextFont(12); t1.SetTextSize(0.0525);
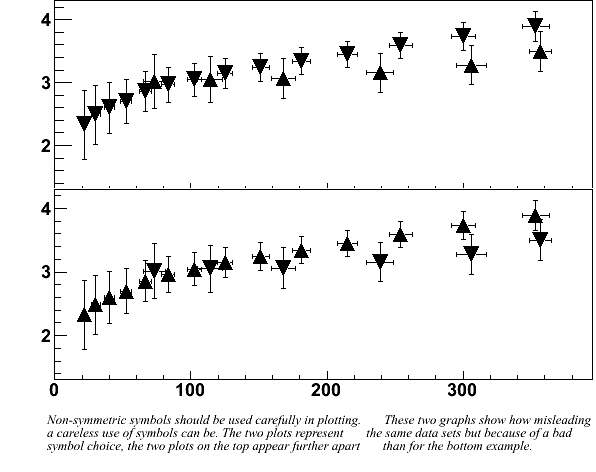
t1.DrawLatex(-5,0.6,"Non-symmetric symbols should be used carefully in plotting. \
These two graphs show how misleading");
t1.DrawLatex(-5,0.4,"a careless use of symbols can be. The two plots represent \
the same data sets but because of a bad");
t1.DrawLatex(-5,0.2,"symbol choice, the two plots on the top appear further apart \
than for the bottom example.");
canvasNc->cd();
}
|
|