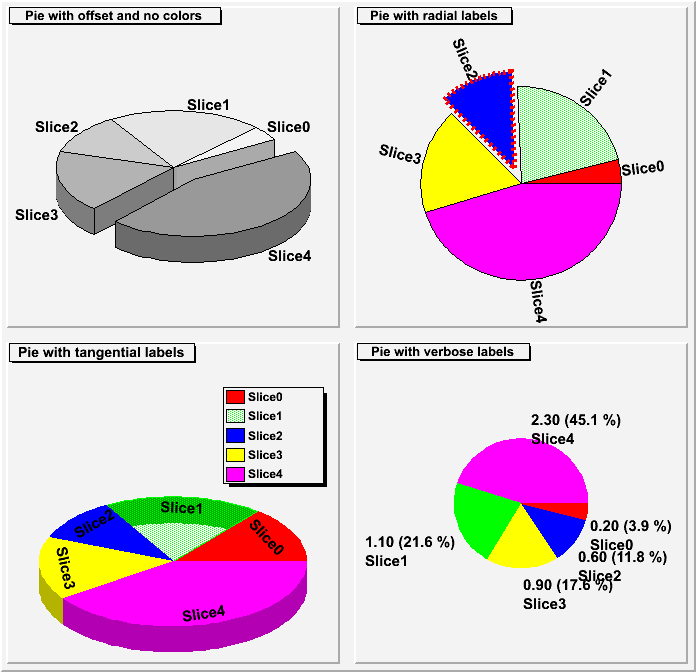
void piechart()
{
Float_t vals[] = {.2,1.1,.6,.9,2.3};
Int_t colors[] = {2,3,4,5,6};
Int_t nvals = sizeof(vals)/sizeof(vals[0]);
TCanvas *cpie = new TCanvas("cpie","TPie test",700,700);
cpie->Divide(2,2);
TPie *pie1 = new TPie("pie1",
"Pie with offset and no colors",nvals,vals);
TPie *pie2 = new TPie("pie2",
"Pie with radial labels",nvals,vals,colors);
TPie *pie3 = new TPie("pie3",
"Pie with tangential labels",nvals,vals,colors);
TPie *pie4 = new TPie("pie4",
"Pie with verbose labels",nvals,vals,colors);
cpie->cd(1);
pie1->SetAngularOffset(30.);
pie1->SetEntryRadiusOffset( 4, 0.1);
pie1->SetRadius(.35);
pie1->Draw("3d");
cpie->cd(2);
pie2->SetEntryRadiusOffset(2,.05);
pie2->SetEntryLineColor(2,2);
pie2->SetEntryLineWidth(2,5);
pie2->SetEntryLineStyle(2,2);
pie2->SetEntryFillStyle(1,3030);
pie2->SetCircle(.5,.45,.3);
pie2->Draw("r");
cpie->cd(3);
pie3->SetY(.32);
pie3->GetSlice(0)->SetValue(.8);
pie3->GetSlice(1)->SetFillStyle(3031);
pie3->SetLabelsOffset(-.1);
pie3->Draw("3d t nol");
TLegend *pieleg = pie3->MakeLegend();
pieleg->SetY1(.56); pieleg->SetY2(.86);
cpie->cd(4);
pie4->SetRadius(.2);
pie4->SetLabelsOffset(.01);
pie4->SetLabelFormat("#splitline{%val (%perc)}{%txt}");
pie4->Draw("nol <");
}
|
|
