The actual heart of the demo is only about 10 lines long.
The ProfileLikelihoodCalculator is based on Wilks's theorem and the asymptotic properties of the profile likelihood ratio (eg. that it is chi-square distributed for the true value).
[#1] INFO:InputArguments -- The deprecated RooFit::CloneData(1) option passed to createNLL() is ignored.
[#1] INFO:Minimization -- p.d.f. provides expected number of events, including extended term in likelihood.
[#1] INFO:Minimization -- Including the following constraint terms in minimization: (alpha_syst2Constraint,alpha_syst3Constraint,gamma_stat_channel1_bin_0_constraint,gamma_stat_channel1_bin_1_constraint)
[#1] INFO:Minimization -- The following global observables have been defined and their values are taken from the model: (nominalLumi,nom_alpha_syst1,nom_alpha_syst2,nom_alpha_syst3,nom_gamma_stat_channel1_bin_0,nom_gamma_stat_channel1_bin_1)
[#1] INFO:Fitting -- RooAbsPdf::fitTo(simPdf) fixing normalization set for coefficient determination to observables in data
[#1] INFO:Fitting -- using generic CPU library compiled with no vectorizations
[#1] INFO:Fitting -- Creation of NLL object took 7.53627 ms
[#0] PROGRESS:Minimization -- ProfileLikelihoodCalcultor::DoGLobalFit - find MLE
[#1] INFO:Fitting -- RooAddition::defaultErrorLevel(nll_simPdf_obsData) Summation contains a RooNLLVar, using its error level
[#0] PROGRESS:Minimization -- ProfileLikelihoodCalcultor::DoMinimizeNLL - using Minuit2 / with strategy 1
[#1] INFO:Minimization -- [fitFCN] No discrete parameters, performing continuous minimization only
[#1] INFO:Minimization --
RooFitResult: minimized FCN value: 15.5775, estimated distance to minimum: 9.97882e-09
covariance matrix quality: Full, accurate covariance matrix
Status : MINIMIZE=0
Floating Parameter FinalValue +/- Error
-------------------- --------------------------
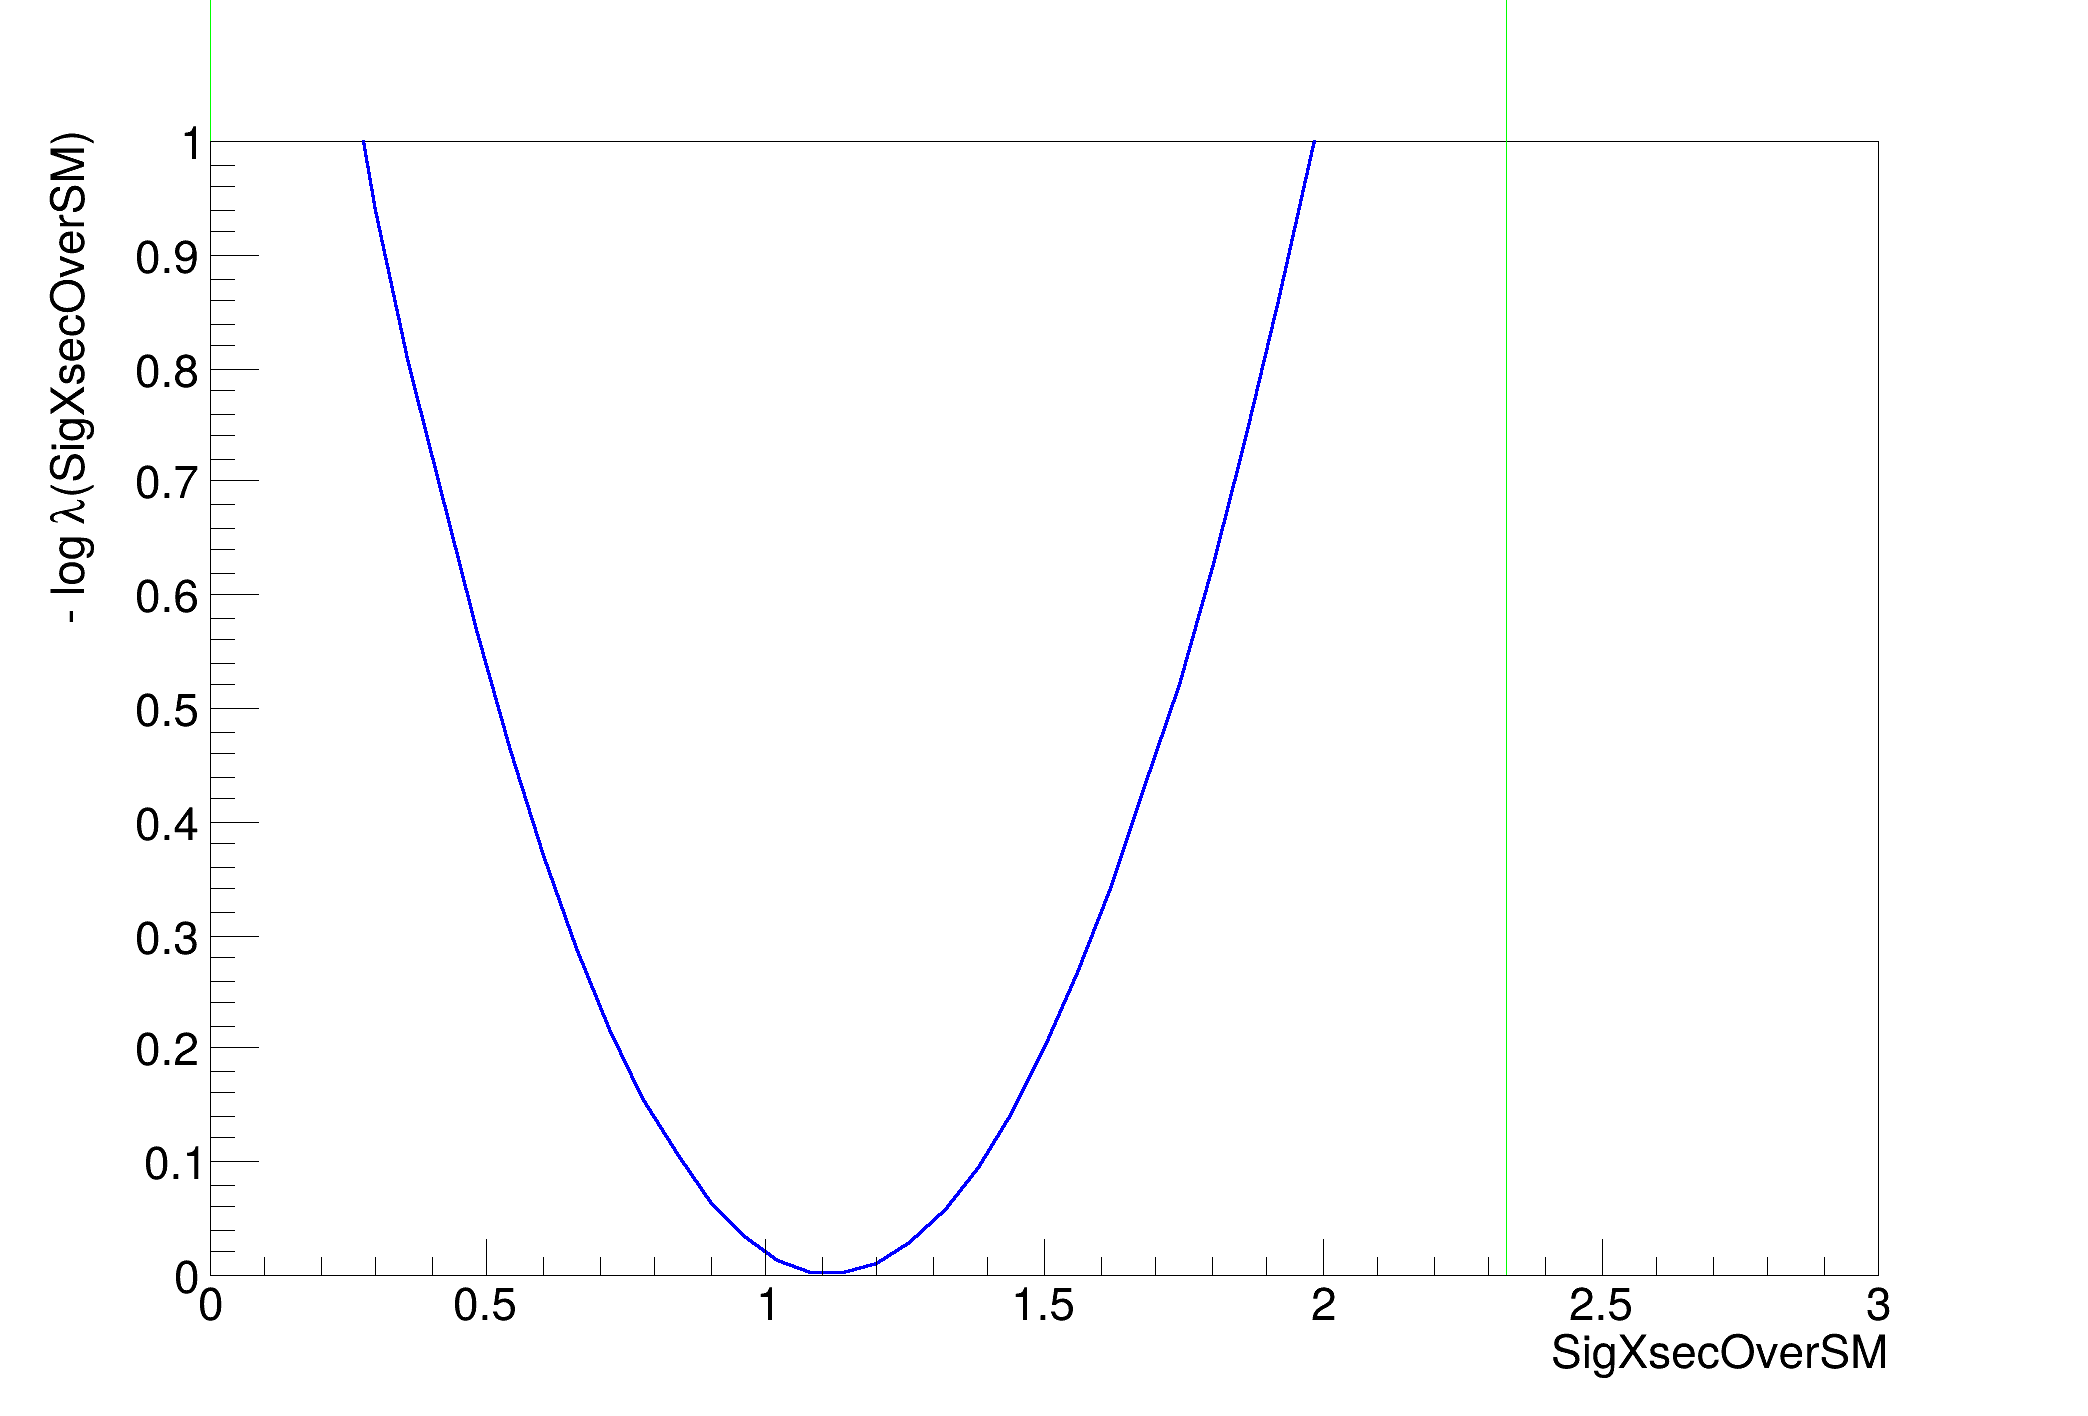
SigXsecOverSM 1.1153e+00 +/- 5.87e-01
alpha_syst2 -8.9073e-03 +/- 9.83e-01
alpha_syst3 1.7876e-02 +/- 9.48e-01
gamma_stat_channel1_bin_0 9.9955e-01 +/- 4.93e-02
gamma_stat_channel1_bin_1 1.0036e+00 +/- 8.01e-02
>>>> RESULT : 95.0% interval on SigXsecOverSM is : [0.0, 2.327436450197799]
making a plot of the profile likelihood function ....(if it is taking a lot of time use less points or the TF1 drawing option)
[#1] INFO:Minimization -- RooProfileLL::evaluate(RooEvaluatorWrapper_Profile[SigXsecOverSM]) Creating instance of MINUIT
[#1] INFO:Fitting -- RooAddition::defaultErrorLevel(nll_simPdf_obsData) Summation contains a RooNLLVar, using its error level
[#1] INFO:Minimization -- RooProfileLL::evaluate(RooEvaluatorWrapper_Profile[SigXsecOverSM]) determining minimum likelihood for current configurations w.r.t all observable
[#1] INFO:Minimization -- [fitFCN] No discrete parameters, performing continuous minimization only
[#1] INFO:Minimization -- RooProfileLL::evaluate(RooEvaluatorWrapper_Profile[SigXsecOverSM]) minimum found at (SigXsecOverSM=1.11588)
.[#1] INFO:Minimization -- [fitFCN] No discrete parameters, performing continuous minimization only
[#1] INFO:Minimization -- RooProfileLL::evaluate(RooEvaluatorWrapper_Profile[SigXsecOverSM]) Creating instance of MINUIT
[#1] INFO:Fitting -- RooAddition::defaultErrorLevel(nll_simPdf_obsData) Summation contains a RooNLLVar, using its error level
[#1] INFO:Minimization -- RooProfileLL::evaluate(RooEvaluatorWrapper_Profile[SigXsecOverSM]) determining minimum likelihood for current configurations w.r.t all observable
[#1] INFO:Minimization -- [fitFCN] No discrete parameters, performing continuous minimization only
[#0] ERROR:InputArguments -- RooArgSet::checkForDup: ERROR argument with name SigXsecOverSM is already in this set
[#1] INFO:Minimization -- RooProfileLL::evaluate(RooEvaluatorWrapper_Profile[SigXsecOverSM]) minimum found at (SigXsecOverSM=1.11549)
.[#1] INFO:Minimization -- [fitFCN] No discrete parameters, performing continuous minimization only
.[#1] INFO:Minimization -- [fitFCN] No discrete parameters, performing continuous minimization only
.[#1] INFO:Minimization -- [fitFCN] No discrete parameters, performing continuous minimization only
.[#1] INFO:Minimization -- [fitFCN] No discrete parameters, performing continuous minimization only
.[#1] INFO:Minimization -- [fitFCN] No discrete parameters, performing continuous minimization only
.[#1] INFO:Minimization -- [fitFCN] No discrete parameters, performing continuous minimization only
.[#1] INFO:Minimization -- [fitFCN] No discrete parameters, performing continuous minimization only
.[#1] INFO:Minimization -- [fitFCN] No discrete parameters, performing continuous minimization only
.[#1] INFO:Minimization -- [fitFCN] No discrete parameters, performing continuous minimization only
.[#1] INFO:Minimization -- [fitFCN] No discrete parameters, performing continuous minimization only
.[#1] INFO:Minimization -- [fitFCN] No discrete parameters, performing continuous minimization only
.[#1] INFO:Minimization -- [fitFCN] No discrete parameters, performing continuous minimization only
.[#1] INFO:Minimization -- [fitFCN] No discrete parameters, performing continuous minimization only
.[#1] INFO:Minimization -- [fitFCN] No discrete parameters, performing continuous minimization only
.[#1] INFO:Minimization -- [fitFCN] No discrete parameters, performing continuous minimization only
.[#1] INFO:Minimization -- [fitFCN] No discrete parameters, performing continuous minimization only
.[#1] INFO:Minimization -- [fitFCN] No discrete parameters, performing continuous minimization only
.[#1] INFO:Minimization -- [fitFCN] No discrete parameters, performing continuous minimization only
.[#1] INFO:Minimization -- [fitFCN] No discrete parameters, performing continuous minimization only
.[#1] INFO:Minimization -- [fitFCN] No discrete parameters, performing continuous minimization only
.[#1] INFO:Minimization -- [fitFCN] No discrete parameters, performing continuous minimization only
.[#1] INFO:Minimization -- [fitFCN] No discrete parameters, performing continuous minimization only
.[#1] INFO:Minimization -- [fitFCN] No discrete parameters, performing continuous minimization only
.[#1] INFO:Minimization -- [fitFCN] No discrete parameters, performing continuous minimization only
.[#1] INFO:Minimization -- [fitFCN] No discrete parameters, performing continuous minimization only
.[#1] INFO:Minimization -- [fitFCN] No discrete parameters, performing continuous minimization only
.[#1] INFO:Minimization -- [fitFCN] No discrete parameters, performing continuous minimization only
.[#1] INFO:Minimization -- [fitFCN] No discrete parameters, performing continuous minimization only
.[#1] INFO:Minimization -- [fitFCN] No discrete parameters, performing continuous minimization only
.[#1] INFO:Minimization -- [fitFCN] No discrete parameters, performing continuous minimization only
.[#1] INFO:Minimization -- [fitFCN] No discrete parameters, performing continuous minimization only
.[#1] INFO:Minimization -- [fitFCN] No discrete parameters, performing continuous minimization only
.[#1] INFO:Minimization -- [fitFCN] No discrete parameters, performing continuous minimization only
.[#1] INFO:Minimization -- [fitFCN] No discrete parameters, performing continuous minimization only
.[#1] INFO:Minimization -- [fitFCN] No discrete parameters, performing continuous minimization only
.[#1] INFO:Minimization -- [fitFCN] No discrete parameters, performing continuous minimization only
.[#1] INFO:Minimization -- [fitFCN] No discrete parameters, performing continuous minimization only
.[#1] INFO:Minimization -- [fitFCN] No discrete parameters, performing continuous minimization only
.[#1] INFO:Minimization -- [fitFCN] No discrete parameters, performing continuous minimization only
.[#1] INFO:Minimization -- [fitFCN] No discrete parameters, performing continuous minimization only
.[#1] INFO:Minimization -- [fitFCN] No discrete parameters, performing continuous minimization only
.[#1] INFO:Minimization -- [fitFCN] No discrete parameters, performing continuous minimization only
.[#1] INFO:Minimization -- [fitFCN] No discrete parameters, performing continuous minimization only
.[#1] INFO:Minimization -- [fitFCN] No discrete parameters, performing continuous minimization only
.[#1] INFO:Minimization -- [fitFCN] No discrete parameters, performing continuous minimization only
.[#1] INFO:Minimization -- [fitFCN] No discrete parameters, performing continuous minimization only
.[#1] INFO:Minimization -- [fitFCN] No discrete parameters, performing continuous minimization only
.[#1] INFO:Minimization -- [fitFCN] No discrete parameters, performing continuous minimization only
.[#1] INFO:Minimization -- [fitFCN] No discrete parameters, performing continuous minimization only
.[#1] INFO:Minimization -- [fitFCN] No discrete parameters, performing continuous minimization only
.[#1] INFO:Minimization -- [fitFCN] No discrete parameters, performing continuous minimization only
.[#1] INFO:Minimization -- [fitFCN] No discrete parameters, performing continuous minimization only
.[#1] INFO:Minimization -- [fitFCN] No discrete parameters, performing continuous minimization only
.[#1] INFO:Minimization -- [fitFCN] No discrete parameters, performing continuous minimization only
.[#1] INFO:Minimization -- [fitFCN] No discrete parameters, performing continuous minimization only
.[#1] INFO:Minimization -- [fitFCN] No discrete parameters, performing continuous minimization only
.[#1] INFO:Minimization -- [fitFCN] No discrete parameters, performing continuous minimization only
.[#1] INFO:Minimization -- [fitFCN] No discrete parameters, performing continuous minimization only
.[#1] INFO:Minimization -- [fitFCN] No discrete parameters, performing continuous minimization only
.[#1] INFO:Minimization -- [fitFCN] No discrete parameters, performing continuous minimization only
.[#1] INFO:Minimization -- [fitFCN] No discrete parameters, performing continuous minimization only
.[#1] INFO:Minimization -- [fitFCN] No discrete parameters, performing continuous minimization only
.[#1] INFO:Minimization -- [fitFCN] No discrete parameters, performing continuous minimization only
.[#1] INFO:Minimization -- [fitFCN] No discrete parameters, performing continuous minimization only
.[#1] INFO:Minimization -- [fitFCN] No discrete parameters, performing continuous minimization only
.[#1] INFO:Minimization -- [fitFCN] No discrete parameters, performing continuous minimization only
.[#1] INFO:Minimization -- [fitFCN] No discrete parameters, performing continuous minimization only
.[#1] INFO:Minimization -- [fitFCN] No discrete parameters, performing continuous minimization only
.[#1] INFO:Minimization -- [fitFCN] No discrete parameters, performing continuous minimization only
.[#1] INFO:Minimization -- [fitFCN] No discrete parameters, performing continuous minimization only
.[#1] INFO:Minimization -- [fitFCN] No discrete parameters, performing continuous minimization only
.[#1] INFO:Minimization -- [fitFCN] No discrete parameters, performing continuous minimization only
.[#1] INFO:Minimization -- [fitFCN] No discrete parameters, performing continuous minimization only
.[#1] INFO:Minimization -- [fitFCN] No discrete parameters, performing continuous minimization only
.[#1] INFO:Minimization -- [fitFCN] No discrete parameters, performing continuous minimization only
.[#1] INFO:Minimization -- [fitFCN] No discrete parameters, performing continuous minimization only
.[#1] INFO:Minimization -- [fitFCN] No discrete parameters, performing continuous minimization only
.[#1] INFO:Minimization -- [fitFCN] No discrete parameters, performing continuous minimization only
.[#1] INFO:Minimization -- [fitFCN] No discrete parameters, performing continuous minimization only
.[#1] INFO:Minimization -- [fitFCN] No discrete parameters, performing continuous minimization only
.[#1] INFO:Minimization -- [fitFCN] No discrete parameters, performing continuous minimization only
.[#1] INFO:Minimization -- [fitFCN] No discrete parameters, performing continuous minimization only
.[#1] INFO:Minimization -- [fitFCN] No discrete parameters, performing continuous minimization only
.[#1] INFO:Minimization -- [fitFCN] No discrete parameters, performing continuous minimization only
.[#1] INFO:Minimization -- [fitFCN] No discrete parameters, performing continuous minimization only
.[#1] INFO:Minimization -- [fitFCN] No discrete parameters, performing continuous minimization only
.[#1] INFO:Minimization -- [fitFCN] No discrete parameters, performing continuous minimization only
.[#1] INFO:Minimization -- [fitFCN] No discrete parameters, performing continuous minimization only
.[#1] INFO:Minimization -- [fitFCN] No discrete parameters, performing continuous minimization only
.[#1] INFO:Minimization -- [fitFCN] No discrete parameters, performing continuous minimization only
.[#1] INFO:Minimization -- [fitFCN] No discrete parameters, performing continuous minimization only
.[#1] INFO:Minimization -- [fitFCN] No discrete parameters, performing continuous minimization only
.[#1] INFO:Minimization -- [fitFCN] No discrete parameters, performing continuous minimization only
.[#1] INFO:Minimization -- [fitFCN] No discrete parameters, performing continuous minimization only
.[#1] INFO:Minimization -- [fitFCN] No discrete parameters, performing continuous minimization only
.[#1] INFO:Minimization -- [fitFCN] No discrete parameters, performing continuous minimization only
.[#1] INFO:Minimization -- [fitFCN] No discrete parameters, performing continuous minimization only
.[#1] INFO:Minimization -- [fitFCN] No discrete parameters, performing continuous minimization only
.[#1] INFO:Minimization -- [fitFCN] No discrete parameters, performing continuous minimization only
.[#1] INFO:Minimization -- [fitFCN] No discrete parameters, performing continuous minimization only
.[#1] INFO:Minimization -- [fitFCN] No discrete parameters, performing continuous minimization only
.[#1] INFO:Minimization -- [fitFCN] No discrete parameters, performing continuous minimization only