If you fit a non-extended pdf in two ranges, e.g. pdf.fitTo(data,Range="Range1,Range2"), it will fit the shapes in the two selected ranges and also take into account the relative predicted yields in those ranges.
This is useful for example to represent a full-range fit, but with a blinded signal region inside it.
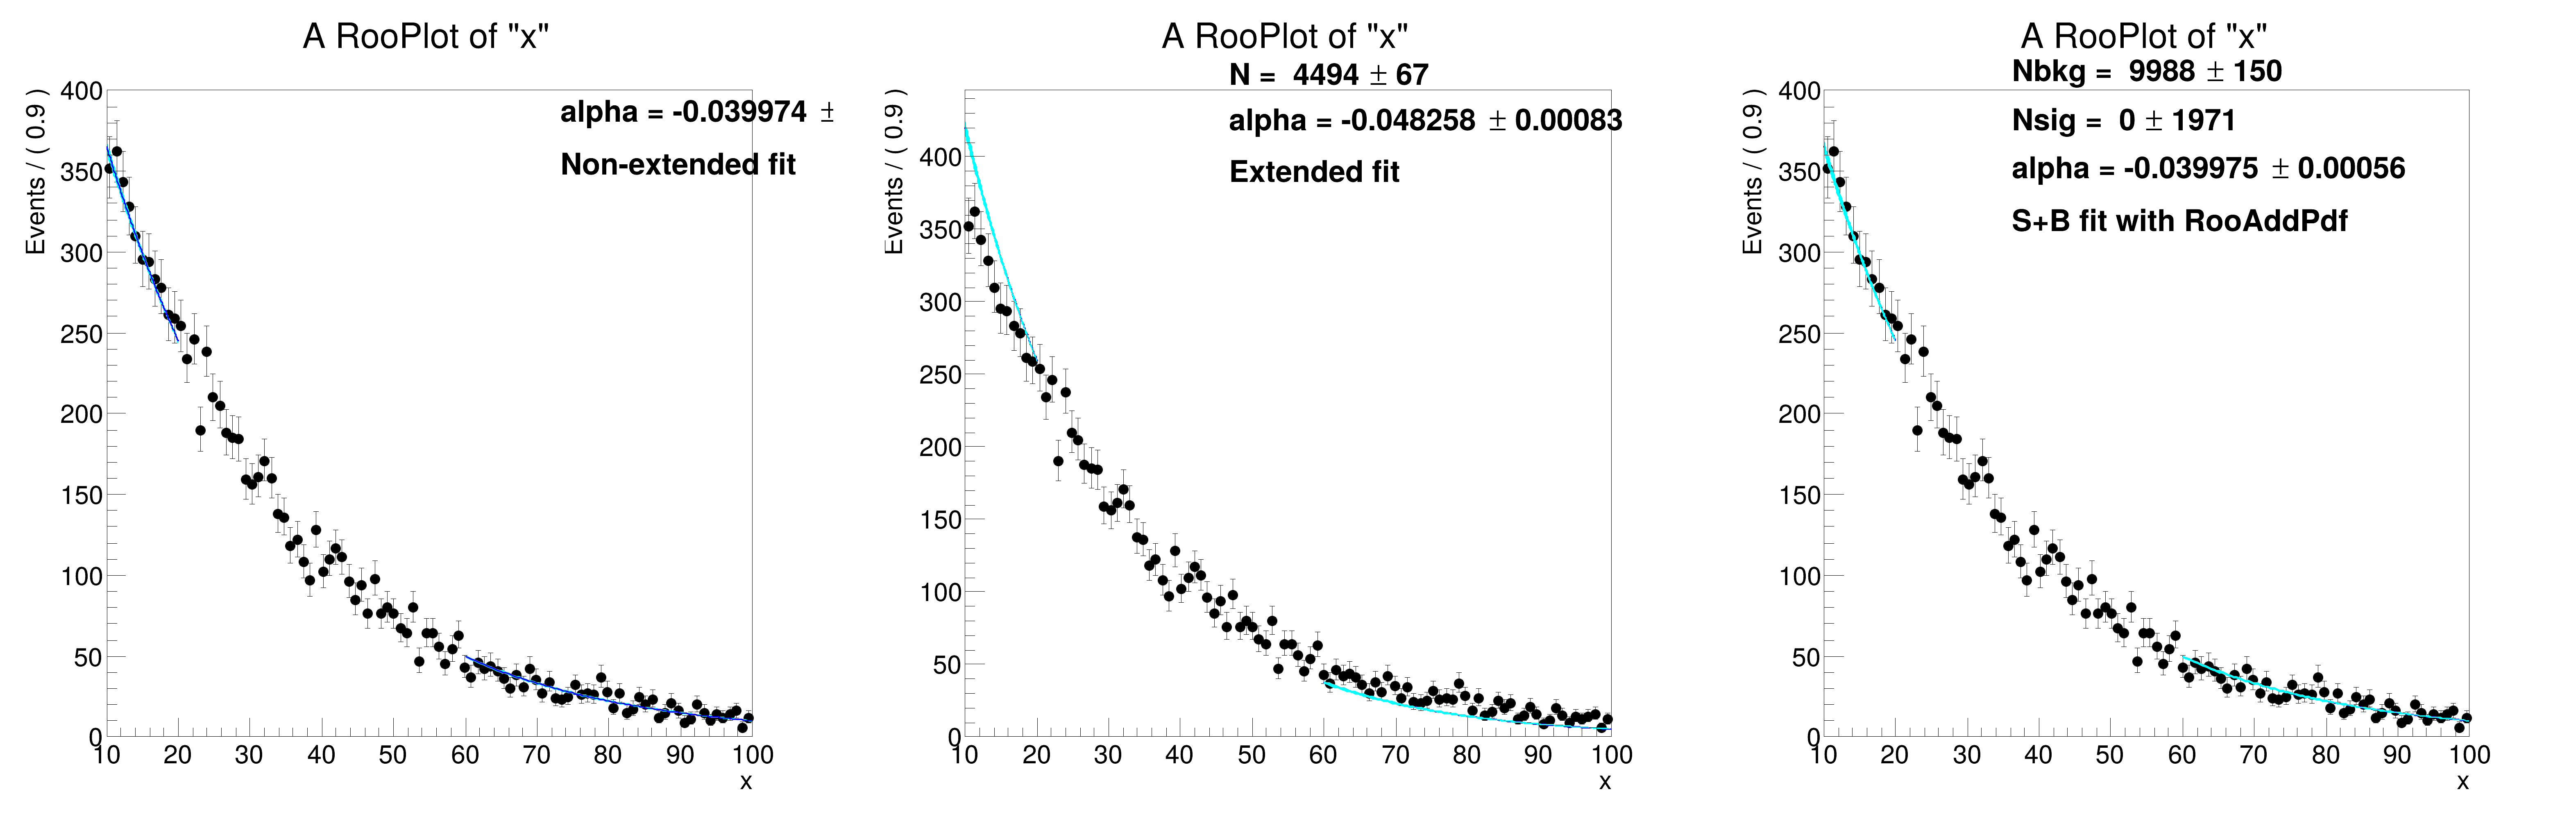
If your pdf is extended, i.e. measuring both the distribution in the observable as well as the event count in the fitted region, some intervention is needed to make fits in ranges work in a way that corresponds to intuition.
If an extended fit is performed in a sub-range, the observed yield is only that of the subrange, hence the expected event count will converge to a number that is smaller than what's visible in a plot. In such cases, it is often preferred to interpret the extended term with respect to the full range that's plotted, i.e., apply a correction to the extended likelihood term in such a way that the interpretation of the expected event count remains that of the full range. This can be done by applying a correcion factor (equal to the fraction of the pdf that is contained in the fitted range) in the Poisson term that represents the extended likelihood term.
If both regions correct their interpretation such that N_expected refers to the full range, it is interpreted easily, and consistent in both regions.
[#1] INFO:Eval -- RooRealVar::setRange(x) new range named 'LEFT' created with bounds [10,20]
[#1] INFO:Eval -- RooRealVar::setRange(x) new range named 'RIGHT' created with bounds [60,100]
[#1] INFO:Eval -- RooRealVar::setRange(x) new range named 'FULL' created with bounds [10,100]
[#1] INFO:Minimization -- p.d.f. provides expected number of events, including extended term in likelihood.
[#1] INFO:Eval -- RooRealVar::setRange(x) new range named 'fit_nll_extmodel_modelData' created with bounds [10,20]
[#1] INFO:Fitting -- RooAbsPdf::fitTo(extmodel) fixing normalization set for coefficient determination to observables in data
[#1] INFO:Fitting -- using generic CPU library compiled with no vectorizations
[#1] INFO:Fitting -- Creation of NLL object took 1.1143 ms
[#1] INFO:Fitting -- RooAddition::defaultErrorLevel(nll_extmodel_modelData) Summation contains a RooNLLVar, using its error level
[#1] INFO:Minimization -- [fitFCN] No discrete parameters, performing continuous minimization only
RooRealVar::N = 3395.66 +/- 58.2751 L(0 - 20000)
[#1] INFO:Eval -- RooRealVar::setRange(x) new range named 'fit_nll_model_modelData_LEFT' created with bounds [10,20]
[#1] INFO:Eval -- RooRealVar::setRange(x) new range named 'fit_nll_model_modelData_RIGHT' created with bounds [60,100]
[#1] INFO:Fitting -- RooAbsPdf::fitTo(model_over_model_Int[x|LEFT,RIGHT]) fixing normalization set for coefficient determination to observables in data
[#1] INFO:Fitting -- Creation of NLL object took 700.214 μs
[#1] INFO:Fitting -- RooAddition::defaultErrorLevel(nll_model_over_model_Int[x|LEFT,RIGHT]_modelData) Summation contains a RooNLLVar, using its error level
[#1] INFO:Minimization -- [fitFCN] No discrete parameters, performing continuous minimization only
RooFitResult: minimized FCN value: 14265.9, estimated distance to minimum: 1.48012e-07
covariance matrix quality: Full, accurate covariance matrix
Status : MINIMIZE=0 HESSE=0
Floating Parameter FinalValue +/- Error
-------------------- --------------------------
alpha -3.9974e-02 +/- 5.60e-04
[#1] INFO:Plotting -- RooAbsPdf::plotOn(model) p.d.f was fitted in a subrange and no explicit Range() and NormRange() was specified. Plotting / normalising in fit range. To override, do one of the following
- Clear the automatic fit range attribute: <pdf>.removeStringAttribute("fitrange");
- Explicitly specify the plotting range: Range("<rangeName>").
- Explicitly specify where to compute the normalisation: NormRange("<rangeName>").
The default (full) range can be denoted with Range("") / NormRange("").
[#1] INFO:Plotting -- RooAbsPdf::plotOn(model) only plotting range 'fit_nll_model_modelData_LEFT,fit_nll_model_modelData_RIGHT'
[#1] INFO:Plotting -- RooAbsPdf::plotOn(model) p.d.f. curve is normalized using explicit choice of ranges 'fit_nll_model_modelData_LEFT,fit_nll_model_modelData_RIGHT'
[#0] WARNING:InputArguments -- RooAbsReal::plotOn(model) WARNING: argument NormRange is duplicated
[#0] WARNING:InputArguments -- RooAbsPdf::plotOn(model) WARNING: argument NormRange is duplicated
[#1] INFO:Plotting -- RooAbsPdf::plotOn(model) only plotting range 'fit_nll_model_modelData_LEFT'
[#1] INFO:Plotting -- RooAbsPdf::plotOn(model) p.d.f. curve is normalized using explicit choice of ranges 'fit_nll_model_modelData_LEFT,fit_nll_model_modelData_RIGHT'
[#0] WARNING:InputArguments -- RooAbsReal::plotOn(model) WARNING: argument NormRange is duplicated
[#0] WARNING:InputArguments -- RooAbsReal::plotOn(model) WARNING: argument CurveNameSuffix is duplicated
[#0] WARNING:InputArguments -- RooAbsPdf::plotOn(model) WARNING: argument NormRange is duplicated
[#0] WARNING:InputArguments -- RooAbsReal::plotOn(model) WARNING: argument NormRange is duplicated
[#0] WARNING:InputArguments -- RooAbsPdf::plotOn(model) WARNING: argument NormRange is duplicated
[#1] INFO:Plotting -- RooAbsPdf::plotOn(model) only plotting range 'fit_nll_model_modelData_RIGHT'
[#1] INFO:Plotting -- RooAbsPdf::plotOn(model) p.d.f. curve is normalized using explicit choice of ranges 'fit_nll_model_modelData_LEFT,fit_nll_model_modelData_RIGHT'
[#0] WARNING:InputArguments -- RooAbsReal::plotOn(model) WARNING: argument NormRange is duplicated
[#0] WARNING:InputArguments -- RooAbsReal::plotOn(model) WARNING: argument CurveNameSuffix is duplicated
[#0] WARNING:InputArguments -- RooAbsPdf::plotOn(model) WARNING: argument NormRange is duplicated
[#1] INFO:Plotting -- RooAbsPdf::plotOn(model) p.d.f was fitted in a subrange and no explicit Range() and NormRange() was specified. Plotting / normalising in fit range. To override, do one of the following
- Clear the automatic fit range attribute: <pdf>.removeStringAttribute("fitrange");
- Explicitly specify the plotting range: Range("<rangeName>").
- Explicitly specify where to compute the normalisation: NormRange("<rangeName>").
The default (full) range can be denoted with Range("") / NormRange("").
[#1] INFO:Plotting -- RooAbsPdf::plotOn(model) only plotting range 'fit_nll_model_modelData_LEFT,fit_nll_model_modelData_RIGHT'
[#1] INFO:Plotting -- RooAbsPdf::plotOn(model) p.d.f. curve is normalized using explicit choice of ranges 'fit_nll_model_modelData_LEFT,fit_nll_model_modelData_RIGHT'
[#0] WARNING:InputArguments -- RooAbsReal::plotOn(model) WARNING: argument NormRange is duplicated
[#0] WARNING:InputArguments -- RooAbsReal::plotOn(model) WARNING: argument NormRange is duplicated
[#1] INFO:Minimization -- p.d.f. provides expected number of events, including extended term in likelihood.
[#1] INFO:Eval -- RooRealVar::setRange(x) new range named 'fit_nll_extmodel_modelData_LEFT' created with bounds [10,20]
[#1] INFO:Eval -- RooRealVar::setRange(x) new range named 'fit_nll_extmodel_modelData_RIGHT' created with bounds [60,100]
[#1] INFO:Fitting -- RooAbsPdf::fitTo(extmodel) fixing normalization set for coefficient determination to observables in data
[#1] INFO:Fitting -- Creation of NLL object took 557.502 μs
[#1] INFO:Fitting -- RooAddition::defaultErrorLevel(nll_extmodel_modelData) Summation contains a RooNLLVar, using its error level
[#1] INFO:Minimization -- [fitFCN] No discrete parameters, performing continuous minimization only
RooFitResult: minimized FCN value: -15500.6, estimated distance to minimum: 0.000427967
covariance matrix quality: Full, accurate covariance matrix
Status : MINIMIZE=0 HESSE=0
Floating Parameter FinalValue +/- Error
-------------------- --------------------------
N 4.4939e+03 +/- 6.70e+01
alpha -4.8258e-02 +/- 8.32e-04
[#1] INFO:Plotting -- RooAbsPdf::plotOn(extmodel) p.d.f was fitted in a subrange and no explicit Range() and NormRange() was specified. Plotting / normalising in fit range. To override, do one of the following
- Clear the automatic fit range attribute: <pdf>.removeStringAttribute("fitrange");
- Explicitly specify the plotting range: Range("<rangeName>").
- Explicitly specify where to compute the normalisation: NormRange("<rangeName>").
The default (full) range can be denoted with Range("") / NormRange("").
[#1] INFO:Plotting -- RooAbsPdf::plotOn(extmodel) only plotting range 'fit_nll_extmodel_modelData_LEFT,fit_nll_extmodel_modelData_RIGHT'
[#1] INFO:Plotting -- RooAbsPdf::plotOn(extmodel) p.d.f. curve is normalized using explicit choice of ranges 'fit_nll_extmodel_modelData_LEFT,fit_nll_extmodel_modelData_RIGHT'
[#0] WARNING:InputArguments -- RooAbsReal::plotOn(extmodel) WARNING: argument NormRange is duplicated
[#0] WARNING:InputArguments -- RooAbsReal::plotOn(extmodel) WARNING: argument NormRange is duplicated
[#1] INFO:Plotting -- RooAbsPdf::plotOn(extmodel) p.d.f was fitted in a subrange and no explicit Range() and NormRange() was specified. Plotting / normalising in fit range. To override, do one of the following
- Clear the automatic fit range attribute: <pdf>.removeStringAttribute("fitrange");
- Explicitly specify the plotting range: Range("<rangeName>").
- Explicitly specify where to compute the normalisation: NormRange("<rangeName>").
The default (full) range can be denoted with Range("") / NormRange("").
[#1] INFO:Plotting -- RooAbsPdf::plotOn(extmodel) only plotting range 'fit_nll_extmodel_modelData_LEFT,fit_nll_extmodel_modelData_RIGHT'
[#1] INFO:Plotting -- RooAbsPdf::plotOn(extmodel) p.d.f. curve is normalized using explicit choice of ranges 'fit_nll_extmodel_modelData_LEFT,fit_nll_extmodel_modelData_RIGHT'
[#0] WARNING:InputArguments -- RooAbsReal::plotOn(extmodel) WARNING: argument NormRange is duplicated
[#0] WARNING:InputArguments -- RooAbsPdf::plotOn(extmodel) WARNING: argument NormRange is duplicated
[#1] INFO:Plotting -- RooAbsPdf::plotOn(extmodel) only plotting range 'fit_nll_extmodel_modelData_LEFT'
[#1] INFO:Plotting -- RooAbsPdf::plotOn(extmodel) p.d.f. curve is normalized using explicit choice of ranges 'fit_nll_extmodel_modelData_LEFT,fit_nll_extmodel_modelData_RIGHT'
[#0] WARNING:InputArguments -- RooAbsReal::plotOn(extmodel) WARNING: argument NormRange is duplicated
[#0] WARNING:InputArguments -- RooAbsReal::plotOn(extmodel) WARNING: argument CurveNameSuffix is duplicated
[#0] WARNING:InputArguments -- RooAbsPdf::plotOn(extmodel) WARNING: argument NormRange is duplicated
[#0] WARNING:InputArguments -- RooAbsReal::plotOn(extmodel) WARNING: argument NormRange is duplicated
[#0] WARNING:InputArguments -- RooAbsPdf::plotOn(extmodel) WARNING: argument NormRange is duplicated
[#1] INFO:Plotting -- RooAbsPdf::plotOn(extmodel) only plotting range 'fit_nll_extmodel_modelData_RIGHT'
[#1] INFO:Plotting -- RooAbsPdf::plotOn(extmodel) p.d.f. curve is normalized using explicit choice of ranges 'fit_nll_extmodel_modelData_LEFT,fit_nll_extmodel_modelData_RIGHT'
[#0] WARNING:InputArguments -- RooAbsReal::plotOn(extmodel) WARNING: argument NormRange is duplicated
[#0] WARNING:InputArguments -- RooAbsReal::plotOn(extmodel) WARNING: argument CurveNameSuffix is duplicated
[#0] WARNING:InputArguments -- RooAbsPdf::plotOn(extmodel) WARNING: argument NormRange is duplicated
[#0] WARNING:InputArguments -- The parameter 'width' with range [-inf, inf] of the RooGaussian 'sig' exceeds the safe range of (0, inf). Advise to limit its range.
[#1] INFO:Minimization -- p.d.f. provides expected number of events, including extended term in likelihood.
[#1] INFO:Eval -- RooRealVar::setRange(x) new range named 'fit_nll_modelsum_modelData_LEFT' created with bounds [10,20]
[#1] INFO:Eval -- RooRealVar::setRange(x) new range named 'fit_nll_modelsum_modelData_RIGHT' created with bounds [60,100]
[#1] INFO:Fitting -- RooAbsPdf::fitTo(modelsum) fixing normalization set for coefficient determination to observables in data
[#1] INFO:Fitting -- Creation of NLL object took 7.20645 ms
[#1] INFO:Fitting -- RooAddition::defaultErrorLevel(nll_modelsum_modelData) Summation contains a RooNLLVar, using its error level
[#1] INFO:Minimization -- [fitFCN] No discrete parameters, performing continuous minimization only
RooFitResult: minimized FCN value: -19036.9, estimated distance to minimum: 0.000236673
covariance matrix quality: Full, accurate covariance matrix
Status : MINIMIZE=0 HESSE=0
Floating Parameter FinalValue +/- Error
-------------------- --------------------------
Nbkg 9.9901e+03 +/- 1.50e+02
Nsig 7.3668e-01 +/- 1.98e+03
alpha -3.9965e-02 +/- 5.60e-04
[#1] INFO:Plotting -- RooAbsPdf::plotOn(modelsum) p.d.f was fitted in a subrange and no explicit Range() and NormRange() was specified. Plotting / normalising in fit range. To override, do one of the following
- Clear the automatic fit range attribute: <pdf>.removeStringAttribute("fitrange");
- Explicitly specify the plotting range: Range("<rangeName>").
- Explicitly specify where to compute the normalisation: NormRange("<rangeName>").
The default (full) range can be denoted with Range("") / NormRange("").
[#1] INFO:Plotting -- RooAbsPdf::plotOn(modelsum) only plotting range 'fit_nll_modelsum_modelData_LEFT,fit_nll_modelsum_modelData_RIGHT'
[#1] INFO:Plotting -- RooAbsPdf::plotOn(modelsum) p.d.f. curve is normalized using explicit choice of ranges 'fit_nll_modelsum_modelData_LEFT,fit_nll_modelsum_modelData_RIGHT'
[#0] WARNING:InputArguments -- RooAbsReal::plotOn(modelsum) WARNING: argument NormRange is duplicated
[#0] WARNING:InputArguments -- RooAbsReal::plotOn(modelsum) WARNING: argument NormRange is duplicated
[#1] INFO:Plotting -- RooAbsPdf::plotOn(modelsum) p.d.f was fitted in a subrange and no explicit Range() and NormRange() was specified. Plotting / normalising in fit range. To override, do one of the following
- Clear the automatic fit range attribute: <pdf>.removeStringAttribute("fitrange");
- Explicitly specify the plotting range: Range("<rangeName>").
- Explicitly specify where to compute the normalisation: NormRange("<rangeName>").
The default (full) range can be denoted with Range("") / NormRange("").
[#1] INFO:Plotting -- RooAbsPdf::plotOn(modelsum) only plotting range 'fit_nll_modelsum_modelData_LEFT,fit_nll_modelsum_modelData_RIGHT'
[#1] INFO:Plotting -- RooAbsPdf::plotOn(modelsum) p.d.f. curve is normalized using explicit choice of ranges 'fit_nll_modelsum_modelData_LEFT,fit_nll_modelsum_modelData_RIGHT'
[#0] WARNING:InputArguments -- RooAbsReal::plotOn(modelsum) WARNING: argument NormRange is duplicated
[#0] WARNING:InputArguments -- RooAbsPdf::plotOn(modelsum) WARNING: argument NormRange is duplicated
[#1] INFO:Plotting -- RooAbsPdf::plotOn(modelsum) only plotting range 'fit_nll_modelsum_modelData_LEFT'
[#1] INFO:Plotting -- RooAbsPdf::plotOn(modelsum) p.d.f. curve is normalized using explicit choice of ranges 'fit_nll_modelsum_modelData_LEFT,fit_nll_modelsum_modelData_RIGHT'
[#0] WARNING:InputArguments -- RooAbsReal::plotOn(modelsum) WARNING: argument NormRange is duplicated
[#0] WARNING:InputArguments -- RooAbsReal::plotOn(modelsum) WARNING: argument CurveNameSuffix is duplicated
[#0] WARNING:Plotting -- RooAbsReal::plotOn(modelsum): the 1-sigma error band for the parameter "Nsig" is invalid because the variations (-614.151, 615.625) are outside the defined range [0, 2000]!
The variations will be clipped inside the range. This might or might not be acceptable in your usecase.
[#0] WARNING:InputArguments -- RooAbsPdf::plotOn(modelsum) WARNING: argument NormRange is duplicated
[#1] INFO:Plotting -- RooAbsPdf::plotOn(modelsum) only plotting range 'fit_nll_modelsum_modelData_LEFT'
[#1] INFO:Plotting -- RooAbsPdf::plotOn(modelsum) p.d.f. curve is normalized using explicit choice of ranges 'fit_nll_modelsum_modelData_LEFT,fit_nll_modelsum_modelData_RIGHT'
[#0] WARNING:InputArguments -- RooAbsReal::plotOn(modelsum) WARNING: argument NormRange is duplicated
[#0] WARNING:InputArguments -- RooAbsReal::plotOn(modelsum) WARNING: argument CurveNameSuffix is duplicated
[#0] WARNING:InputArguments -- RooAbsPdf::plotOn(modelsum) WARNING: argument NormRange is duplicated
[#0] WARNING:InputArguments -- RooAbsReal::plotOn(modelsum) WARNING: argument NormRange is duplicated
[#0] WARNING:InputArguments -- RooAbsPdf::plotOn(modelsum) WARNING: argument NormRange is duplicated
[#1] INFO:Plotting -- RooAbsPdf::plotOn(modelsum) only plotting range 'fit_nll_modelsum_modelData_RIGHT'
[#1] INFO:Plotting -- RooAbsPdf::plotOn(modelsum) p.d.f. curve is normalized using explicit choice of ranges 'fit_nll_modelsum_modelData_LEFT,fit_nll_modelsum_modelData_RIGHT'
[#0] WARNING:InputArguments -- RooAbsReal::plotOn(modelsum) WARNING: argument NormRange is duplicated
[#0] WARNING:InputArguments -- RooAbsReal::plotOn(modelsum) WARNING: argument CurveNameSuffix is duplicated
[#0] WARNING:InputArguments -- RooAbsPdf::plotOn(modelsum) WARNING: argument NormRange is duplicated
[#1] INFO:Plotting -- RooAbsPdf::plotOn(modelsum) only plotting range 'fit_nll_modelsum_modelData_RIGHT'
[#1] INFO:Plotting -- RooAbsPdf::plotOn(modelsum) p.d.f. curve is normalized using explicit choice of ranges 'fit_nll_modelsum_modelData_LEFT,fit_nll_modelsum_modelData_RIGHT'
[#0] WARNING:InputArguments -- RooAbsReal::plotOn(modelsum) WARNING: argument NormRange is duplicated
[#0] WARNING:InputArguments -- RooAbsReal::plotOn(modelsum) WARNING: argument CurveNameSuffix is duplicated
[#0] WARNING:Plotting -- RooAbsReal::plotOn(modelsum): the 1-sigma error band for the parameter "Nsig" is invalid because the variations (-614.151, 615.625) are outside the defined range [0, 2000]!
The variations will be clipped inside the range. This might or might not be acceptable in your usecase.
[#0] WARNING:InputArguments -- RooAbsPdf::plotOn(modelsum) WARNING: argument NormRange is duplicated
[#1] INFO:Plotting -- RooAbsPdf::plotOn(modelsum) only plotting range 'fit_nll_modelsum_modelData_RIGHT'
[#1] INFO:Plotting -- RooAbsPdf::plotOn(modelsum) p.d.f. curve is normalized using explicit choice of ranges 'fit_nll_modelsum_modelData_LEFT,fit_nll_modelsum_modelData_RIGHT'
[#0] WARNING:InputArguments -- RooAbsReal::plotOn(modelsum) WARNING: argument NormRange is duplicated
[#0] WARNING:InputArguments -- RooAbsReal::plotOn(modelsum) WARNING: argument CurveNameSuffix is duplicated
[#0] WARNING:InputArguments -- RooAbsPdf::plotOn(modelsum) WARNING: argument NormRange is duplicated