Multidimensional models: projecting pdf and data slices in discrete observables
import ROOT
mixState =
ROOT.RooCategory(
"mixState",
"B0/B0bar mixing state", {
"mixed": -1,
"unmixed": 1})
tagFlav =
ROOT.RooCategory(
"tagFlav",
"Flavour of the tagged B0", {
"B0": 1,
"B0bar": -1})
dw =
ROOT.RooRealVar(
"dw",
"Flavor Mistag rate difference between B0 and B0bar", 0.01)
bmix_gm1 =
ROOT.RooBMixDecay(
"bmix",
"decay", dt, mixState, tagFlav, tau, dm, w, dw, gm1, type=
"DoubleSided")
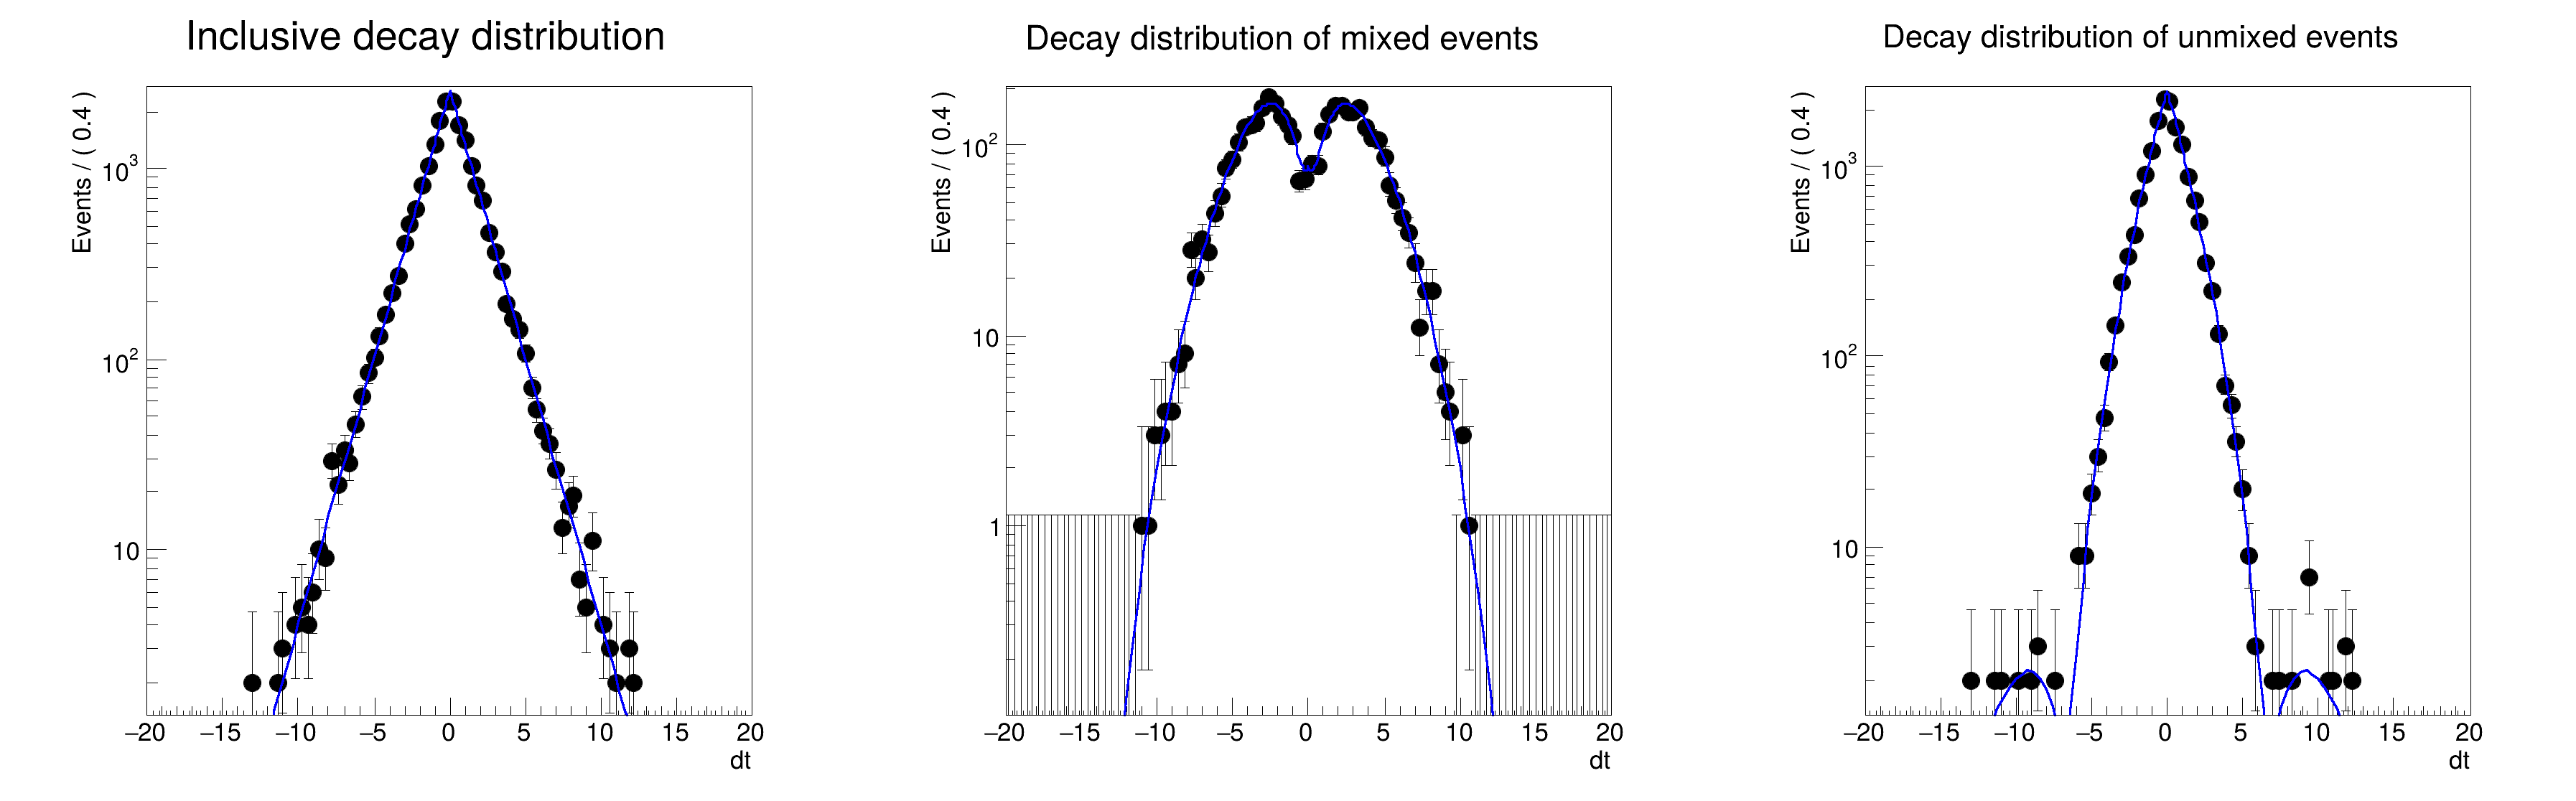
frame =
dt.frame(Title=
"Inclusive decay distribution")
frame2 =
dt.frame(Title=
"Decay distribution of mixed events")
frame3 =
dt.frame(Title=
"Decay distribution of unmixed events")
c =
ROOT.TCanvas(
"rf310_sliceplot",
"rf310_sliceplot", 1200, 400)
ROOT::Detail::TRangeCast< T, true > TRangeDynCast
TRangeDynCast is an adapter class that allows the typed iteration through a TCollection.
[#1] INFO:Plotting -- RooAbsReal::plotOn(bmix) plot on dt integrates over variables (tagFlav,mixState)
[#1] INFO:Plotting -- RooTreeData::plotOn: plotting 3787 events out of 20000 total events
[#1] INFO:Plotting -- RooAbsReal::plotOn(bmix) plot on dt represents a slice in (mixState)
[#1] INFO:Plotting -- RooAbsReal::plotOn(bmix) plot on dt integrates over variables (tagFlav)
[#1] INFO:Plotting -- RooTreeData::plotOn: plotting 16213 events out of 20000 total events
[#1] INFO:Plotting -- RooAbsReal::plotOn(bmix) plot on dt represents a slice in (mixState)
[#1] INFO:Plotting -- RooAbsReal::plotOn(bmix) plot on dt integrates over variables (tagFlav)
- Date
- February 2018
- Authors
- Clemens Lange, Wouter Verkerke (C++ version)
Definition in file rf310_sliceplot.py.