This tutorial shows an example of a combination of two searches using number counting with background uncertainty.
[#0] WARNING:ObjectHandling -- NumberCountingPdfFactory: changed value of tau_0 to 100.01 to be consistent with background and its uncertainty. Also stored these values of tau into workspace with name . tau_0ExpectedNumberCountingData if you test with a different dataset, you should adjust tau appropriately.
[#0] WARNING:ObjectHandling -- NumberCountingPdfFactory: changed value of tau_1 to 100.01 to be consistent with background and its uncertainty. Also stored these values of tau into workspace with name . tau_1ExpectedNumberCountingData if you test with a different dataset, you should adjust tau appropriately.
[#1] INFO:InputArguments -- The deprecated RooFit::CloneData(1) option passed to createNLL() is ignored.
[#1] INFO:Fitting -- RooAbsPdf::fitTo(TopLevelPdf) fixing normalization set for coefficient determination to observables in data
[#1] INFO:Fitting -- using generic CPU library compiled with no vectorizations
[#1] INFO:Fitting -- Creation of NLL object took 8.8057 ms
[#0] PROGRESS:Minimization -- ProfileLikelihoodCalcultor::DoGLobalFit - find MLE
[#1] INFO:Fitting -- RooAddition::defaultErrorLevel(nll_TopLevelPdf_ExpectedNumberCountingData) Summation contains a RooNLLVar, using its error level
[#0] PROGRESS:Minimization -- ProfileLikelihoodCalcultor::DoMinimizeNLL - using Minuit2 / with strategy 1
[#1] INFO:Minimization -- [fitFCN] No discrete parameters, performing continuous minimization only
[#1] INFO:Minimization --
RooFitResult: minimized FCN value: 17.6316, estimated distance to minimum: 4.66835e-14
covariance matrix quality: Full, accurate covariance matrix
Status : MINIMIZE=0
Floating Parameter FinalValue +/- Error
-------------------- --------------------------
b_0 1.0000e+02 +/- 9.99e-01
b_1 1.0000e+02 +/- 9.96e-01
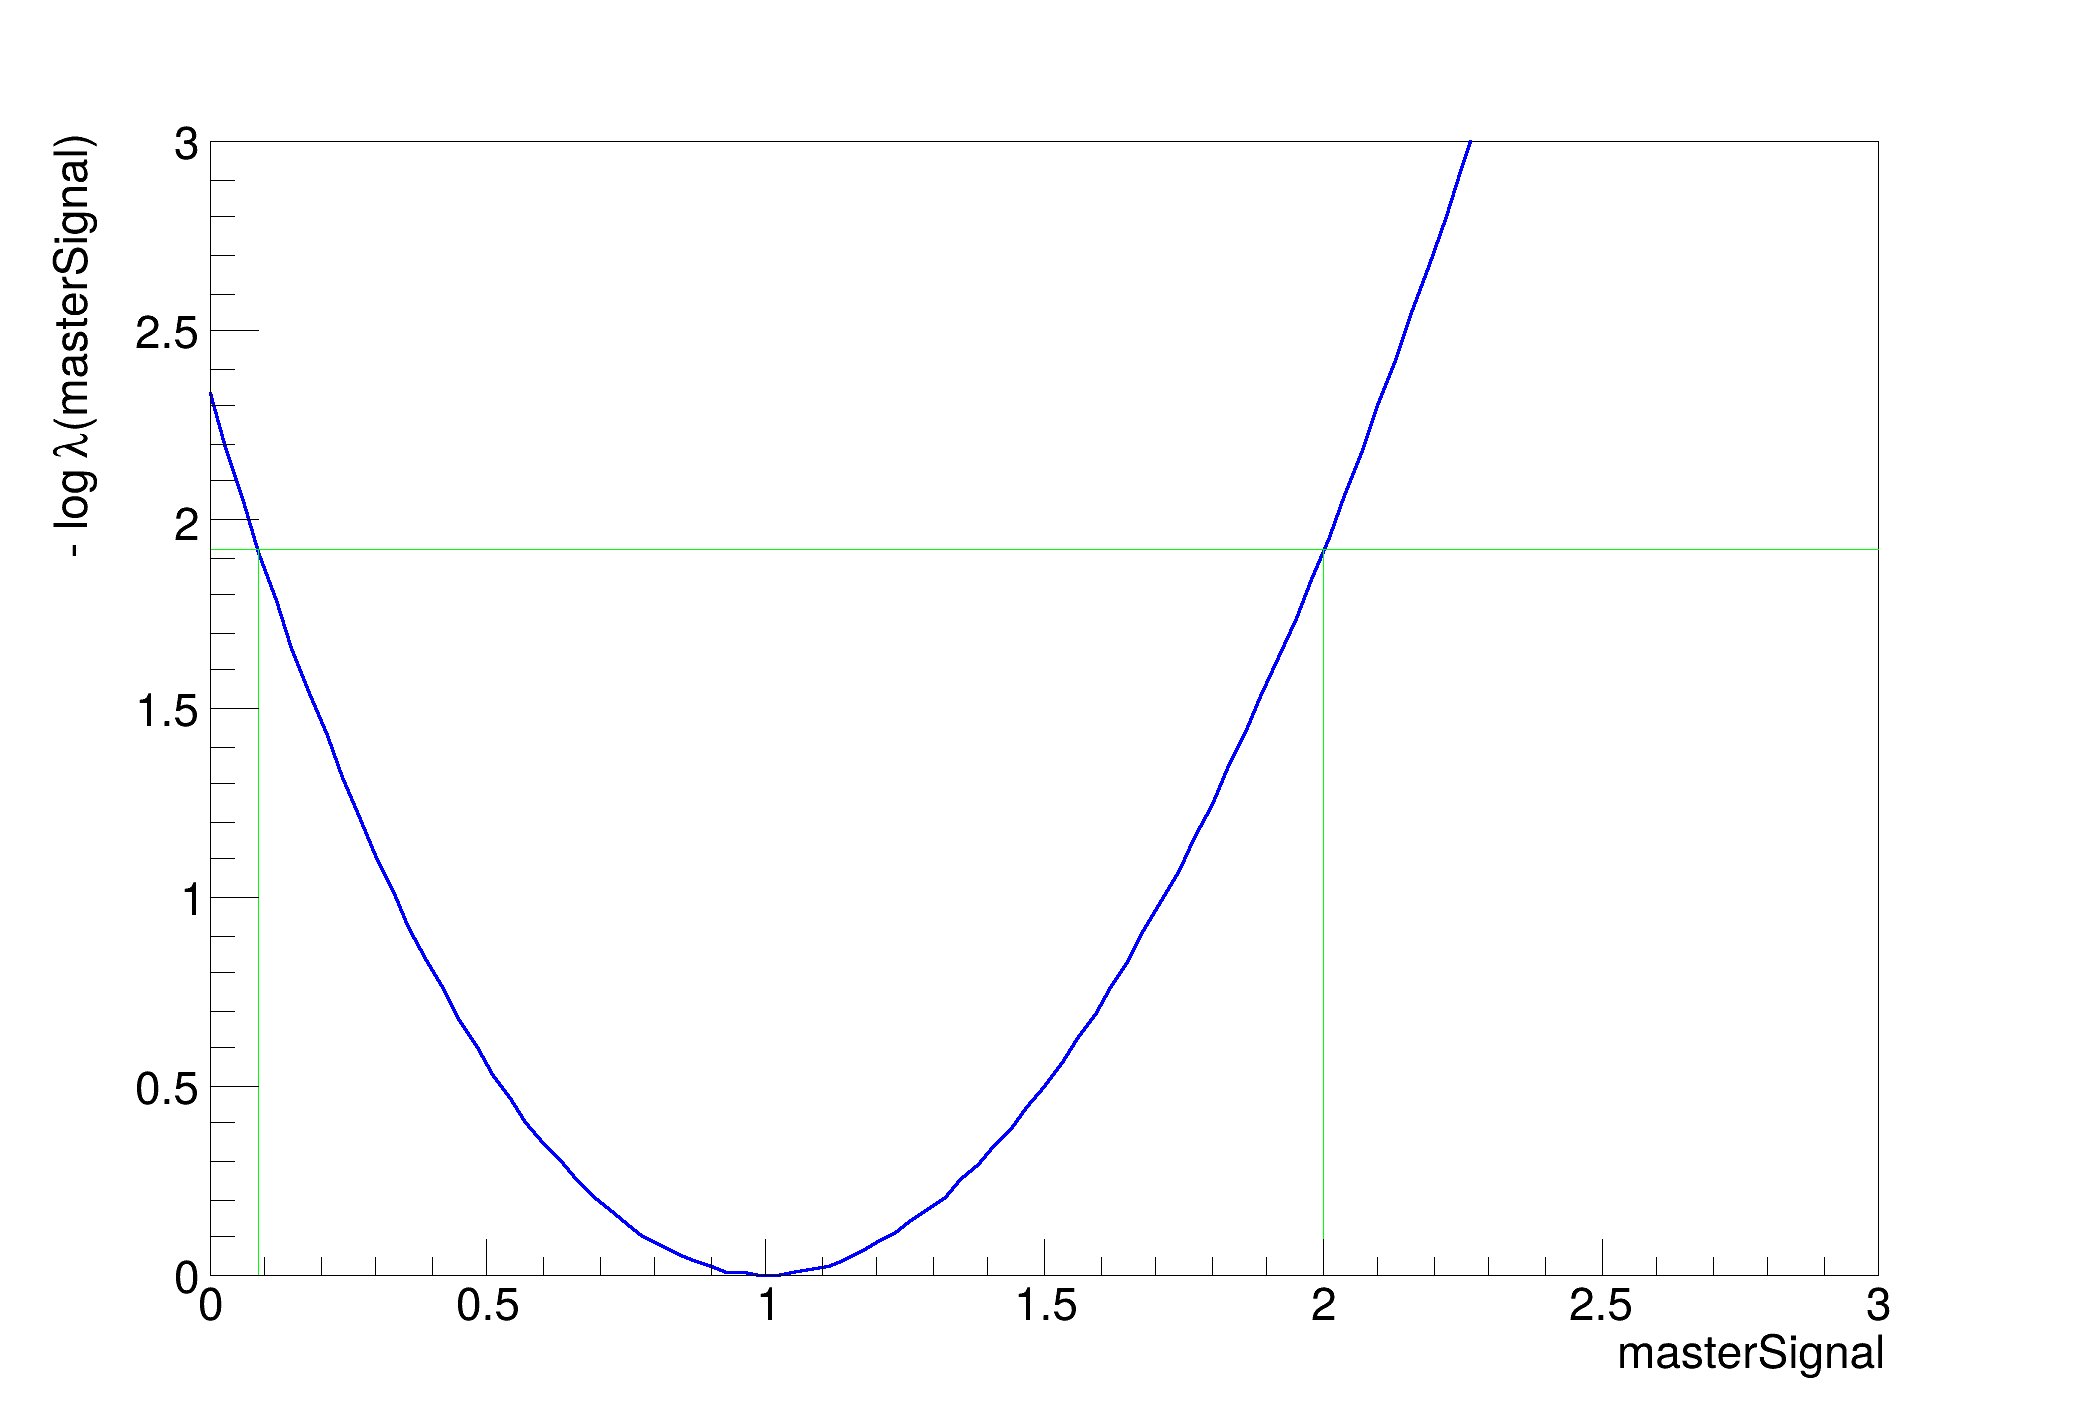
masterSignal 1.0000e+00 +/- 4.78e-01
[#0] PROGRESS:Minimization -- ProfileLikelihoodCalcultor::GetHypoTest - do conditional fit
[#1] INFO:Fitting -- RooAddition::defaultErrorLevel(nll_TopLevelPdf_ExpectedNumberCountingData) Summation contains a RooNLLVar, using its error level
[#0] PROGRESS:Minimization -- ProfileLikelihoodCalcultor::DoMinimizeNLL - using Minuit2 / with strategy 1
[#1] INFO:Minimization -- [fitFCN] No discrete parameters, performing continuous minimization only
[#1] INFO:Minimization --
RooFitResult: minimized FCN value: 19.9696, estimated distance to minimum: 7.34075e-08
covariance matrix quality: Full, accurate covariance matrix
Status : MINIMIZE=0
Floating Parameter FinalValue +/- Error
-------------------- --------------------------
b_0 1.0020e+02 +/- 9.96e-01
b_1 1.0010e+02 +/- 9.95e-01
-------------------------------------------------
The p-value for the null is 0.015294
Corresponding to a significance of 2.16239
-------------------------------------------------
[#1] INFO:InputArguments -- The deprecated RooFit::CloneData(1) option passed to createNLL() is ignored.
[#1] INFO:Fitting -- RooAbsPdf::fitTo(TopLevelPdf) fixing normalization set for coefficient determination to observables in data
[#1] INFO:Fitting -- Creation of NLL object took 314.75 μs
[#0] PROGRESS:Minimization -- ProfileLikelihoodCalcultor::DoGLobalFit - find MLE
[#1] INFO:Fitting -- RooAddition::defaultErrorLevel(nll_TopLevelPdf_ExpectedNumberCountingData) Summation contains a RooNLLVar, using its error level
[#0] PROGRESS:Minimization -- ProfileLikelihoodCalcultor::DoMinimizeNLL - using Minuit2 / with strategy 1
[#1] INFO:Minimization -- [fitFCN] No discrete parameters, performing continuous minimization only
[#1] INFO:Minimization --
RooFitResult: minimized FCN value: 17.6316, estimated distance to minimum: 2.31451e-07
covariance matrix quality: Full, accurate covariance matrix
Status : MINIMIZE=0
Floating Parameter FinalValue +/- Error
-------------------- --------------------------
b_0 1.0000e+02 +/- 9.99e-01
b_1 1.0000e+02 +/- 9.96e-01
masterSignal 9.9967e-01 +/- 4.78e-01
[#1] INFO:Minimization -- RooProfileLL::evaluate(RooEvaluatorWrapper_Profile[masterSignal]) Creating instance of MINUIT
[#1] INFO:Fitting -- RooAddition::defaultErrorLevel(nll_TopLevelPdf_ExpectedNumberCountingData) Summation contains a RooNLLVar, using its error level
[#1] INFO:Minimization -- RooProfileLL::evaluate(RooEvaluatorWrapper_Profile[masterSignal]) determining minimum likelihood for current configurations w.r.t all observable
[#1] INFO:Minimization -- [fitFCN] No discrete parameters, performing continuous minimization only
[#1] INFO:Minimization -- RooProfileLL::evaluate(RooEvaluatorWrapper_Profile[masterSignal]) minimum found at (masterSignal=1.00388)
.[#1] INFO:Minimization -- [fitFCN] No discrete parameters, performing continuous minimization only
[#1] INFO:Minimization -- RooProfileLL::evaluate(RooEvaluatorWrapper_Profile[masterSignal]) Creating instance of MINUIT
[#1] INFO:Fitting -- RooAddition::defaultErrorLevel(nll_TopLevelPdf_ExpectedNumberCountingData) Summation contains a RooNLLVar, using its error level
[#1] INFO:Minimization -- RooProfileLL::evaluate(RooEvaluatorWrapper_Profile[masterSignal]) determining minimum likelihood for current configurations w.r.t all observable
[#1] INFO:Minimization -- [fitFCN] No discrete parameters, performing continuous minimization only
[#0] ERROR:InputArguments -- RooArgSet::checkForDup: ERROR argument with name masterSignal is already in this set
[#1] INFO:Minimization -- RooProfileLL::evaluate(RooEvaluatorWrapper_Profile[masterSignal]) minimum found at (masterSignal=1.00732)
.[#1] INFO:Minimization -- [fitFCN] No discrete parameters, performing continuous minimization only
.[#1] INFO:Minimization -- [fitFCN] No discrete parameters, performing continuous minimization only
.[#1] INFO:Minimization -- [fitFCN] No discrete parameters, performing continuous minimization only
.[#1] INFO:Minimization -- [fitFCN] No discrete parameters, performing continuous minimization only
.[#1] INFO:Minimization -- [fitFCN] No discrete parameters, performing continuous minimization only
.[#1] INFO:Minimization -- [fitFCN] No discrete parameters, performing continuous minimization only
.[#1] INFO:Minimization -- [fitFCN] No discrete parameters, performing continuous minimization only
.[#1] INFO:Minimization -- [fitFCN] No discrete parameters, performing continuous minimization only
.[#1] INFO:Minimization -- [fitFCN] No discrete parameters, performing continuous minimization only
.[#1] INFO:Minimization -- [fitFCN] No discrete parameters, performing continuous minimization only
.[#1] INFO:Minimization -- [fitFCN] No discrete parameters, performing continuous minimization only
.[#1] INFO:Minimization -- [fitFCN] No discrete parameters, performing continuous minimization only
.[#1] INFO:Minimization -- [fitFCN] No discrete parameters, performing continuous minimization only
.[#1] INFO:Minimization -- [fitFCN] No discrete parameters, performing continuous minimization only
.[#1] INFO:Minimization -- [fitFCN] No discrete parameters, performing continuous minimization only
.[#1] INFO:Minimization -- [fitFCN] No discrete parameters, performing continuous minimization only
.[#1] INFO:Minimization -- [fitFCN] No discrete parameters, performing continuous minimization only
.[#1] INFO:Minimization -- [fitFCN] No discrete parameters, performing continuous minimization only
.[#1] INFO:Minimization -- [fitFCN] No discrete parameters, performing continuous minimization only
.[#1] INFO:Minimization -- [fitFCN] No discrete parameters, performing continuous minimization only
.[#1] INFO:Minimization -- [fitFCN] No discrete parameters, performing continuous minimization only
.[#1] INFO:Minimization -- [fitFCN] No discrete parameters, performing continuous minimization only
.[#1] INFO:Minimization -- [fitFCN] No discrete parameters, performing continuous minimization only
.[#1] INFO:Minimization -- [fitFCN] No discrete parameters, performing continuous minimization only
.[#1] INFO:Minimization -- [fitFCN] No discrete parameters, performing continuous minimization only
.[#1] INFO:Minimization -- [fitFCN] No discrete parameters, performing continuous minimization only
.[#1] INFO:Minimization -- [fitFCN] No discrete parameters, performing continuous minimization only
.[#1] INFO:Minimization -- [fitFCN] No discrete parameters, performing continuous minimization only
.[#1] INFO:Minimization -- [fitFCN] No discrete parameters, performing continuous minimization only
.[#1] INFO:Minimization -- [fitFCN] No discrete parameters, performing continuous minimization only
.[#1] INFO:Minimization -- [fitFCN] No discrete parameters, performing continuous minimization only
.[#1] INFO:Minimization -- [fitFCN] No discrete parameters, performing continuous minimization only
.[#1] INFO:Minimization -- [fitFCN] No discrete parameters, performing continuous minimization only
.[#1] INFO:Minimization -- [fitFCN] No discrete parameters, performing continuous minimization only
.[#1] INFO:Minimization -- [fitFCN] No discrete parameters, performing continuous minimization only
.[#1] INFO:Minimization -- [fitFCN] No discrete parameters, performing continuous minimization only
.[#1] INFO:Minimization -- [fitFCN] No discrete parameters, performing continuous minimization only
.[#1] INFO:Minimization -- [fitFCN] No discrete parameters, performing continuous minimization only
.[#1] INFO:Minimization -- [fitFCN] No discrete parameters, performing continuous minimization only
.[#1] INFO:Minimization -- [fitFCN] No discrete parameters, performing continuous minimization only
.[#1] INFO:Minimization -- [fitFCN] No discrete parameters, performing continuous minimization only
.[#1] INFO:Minimization -- [fitFCN] No discrete parameters, performing continuous minimization only
.[#1] INFO:Minimization -- [fitFCN] No discrete parameters, performing continuous minimization only
.[#1] INFO:Minimization -- [fitFCN] No discrete parameters, performing continuous minimization only
.[#1] INFO:Minimization -- [fitFCN] No discrete parameters, performing continuous minimization only
.[#1] INFO:Minimization -- [fitFCN] No discrete parameters, performing continuous minimization only
.[#1] INFO:Minimization -- [fitFCN] No discrete parameters, performing continuous minimization only
.[#1] INFO:Minimization -- [fitFCN] No discrete parameters, performing continuous minimization only
.[#1] INFO:Minimization -- [fitFCN] No discrete parameters, performing continuous minimization only
.[#1] INFO:Minimization -- [fitFCN] No discrete parameters, performing continuous minimization only
.[#1] INFO:Minimization -- [fitFCN] No discrete parameters, performing continuous minimization only
.[#1] INFO:Minimization -- [fitFCN] No discrete parameters, performing continuous minimization only
.[#1] INFO:Minimization -- [fitFCN] No discrete parameters, performing continuous minimization only
.[#1] INFO:Minimization -- [fitFCN] No discrete parameters, performing continuous minimization only
.[#1] INFO:Minimization -- [fitFCN] No discrete parameters, performing continuous minimization only
.[#1] INFO:Minimization -- [fitFCN] No discrete parameters, performing continuous minimization only
.[#1] INFO:Minimization -- [fitFCN] No discrete parameters, performing continuous minimization only
.[#1] INFO:Minimization -- [fitFCN] No discrete parameters, performing continuous minimization only
.[#1] INFO:Minimization -- [fitFCN] No discrete parameters, performing continuous minimization only
.[#1] INFO:Minimization -- [fitFCN] No discrete parameters, performing continuous minimization only
.[#1] INFO:Minimization -- [fitFCN] No discrete parameters, performing continuous minimization only
.[#1] INFO:Minimization -- [fitFCN] No discrete parameters, performing continuous minimization only
.[#1] INFO:Minimization -- [fitFCN] No discrete parameters, performing continuous minimization only
.[#1] INFO:Minimization -- [fitFCN] No discrete parameters, performing continuous minimization only
.[#1] INFO:Minimization -- [fitFCN] No discrete parameters, performing continuous minimization only
.[#1] INFO:Minimization -- [fitFCN] No discrete parameters, performing continuous minimization only
.[#1] INFO:Minimization -- [fitFCN] No discrete parameters, performing continuous minimization only
.[#1] INFO:Minimization -- [fitFCN] No discrete parameters, performing continuous minimization only
.[#1] INFO:Minimization -- [fitFCN] No discrete parameters, performing continuous minimization only
.[#1] INFO:Minimization -- [fitFCN] No discrete parameters, performing continuous minimization only
.[#1] INFO:Minimization -- [fitFCN] No discrete parameters, performing continuous minimization only
.[#1] INFO:Minimization -- [fitFCN] No discrete parameters, performing continuous minimization only
.[#1] INFO:Minimization -- [fitFCN] No discrete parameters, performing continuous minimization only
.[#1] INFO:Minimization -- [fitFCN] No discrete parameters, performing continuous minimization only
.[#1] INFO:Minimization -- [fitFCN] No discrete parameters, performing continuous minimization only
.[#1] INFO:Minimization -- [fitFCN] No discrete parameters, performing continuous minimization only
.[#1] INFO:Minimization -- [fitFCN] No discrete parameters, performing continuous minimization only
.[#1] INFO:Minimization -- [fitFCN] No discrete parameters, performing continuous minimization only
.[#1] INFO:Minimization -- [fitFCN] No discrete parameters, performing continuous minimization only
.[#1] INFO:Minimization -- [fitFCN] No discrete parameters, performing continuous minimization only
.[#1] INFO:Minimization -- [fitFCN] No discrete parameters, performing continuous minimization only
.[#1] INFO:Minimization -- [fitFCN] No discrete parameters, performing continuous minimization only
.[#1] INFO:Minimization -- [fitFCN] No discrete parameters, performing continuous minimization only
.[#1] INFO:Minimization -- [fitFCN] No discrete parameters, performing continuous minimization only
.[#1] INFO:Minimization -- [fitFCN] No discrete parameters, performing continuous minimization only
.[#1] INFO:Minimization -- [fitFCN] No discrete parameters, performing continuous minimization only
.[#1] INFO:Minimization -- [fitFCN] No discrete parameters, performing continuous minimization only
.[#1] INFO:Minimization -- [fitFCN] No discrete parameters, performing continuous minimization only
.[#1] INFO:Minimization -- [fitFCN] No discrete parameters, performing continuous minimization only
.[#1] INFO:Minimization -- [fitFCN] No discrete parameters, performing continuous minimization only
.[#1] INFO:Minimization -- [fitFCN] No discrete parameters, performing continuous minimization only
.[#1] INFO:Minimization -- [fitFCN] No discrete parameters, performing continuous minimization only
.[#1] INFO:Minimization -- [fitFCN] No discrete parameters, performing continuous minimization only
.[#1] INFO:Minimization -- [fitFCN] No discrete parameters, performing continuous minimization only
.[#1] INFO:Minimization -- [fitFCN] No discrete parameters, performing continuous minimization only
.[#1] INFO:Minimization -- [fitFCN] No discrete parameters, performing continuous minimization only
.[#1] INFO:Minimization -- [fitFCN] No discrete parameters, performing continuous minimization only
.[#1] INFO:Minimization -- [fitFCN] No discrete parameters, performing continuous minimization only
.[#1] INFO:Minimization -- [fitFCN] No discrete parameters, performing continuous minimization only
.[#1] INFO:Minimization -- [fitFCN] No discrete parameters, performing continuous minimization only
.[#1] INFO:Minimization -- [fitFCN] No discrete parameters, performing continuous minimization only
.[#1] INFO:Minimization -- [fitFCN] No discrete parameters, performing continuous minimization only
.[#1] INFO:Minimization -- [fitFCN] No discrete parameters, performing continuous minimization only
.[#1] INFO:Minimization -- [fitFCN] No discrete parameters, performing continuous minimization only
.[#1] INFO:Minimization -- [fitFCN] No discrete parameters, performing continuous minimization only
.[#1] INFO:Minimization -- [fitFCN] No discrete parameters, performing continuous minimization only
.[#1] INFO:Minimization -- [fitFCN] No discrete parameters, performing continuous minimization only
.[#1] INFO:Minimization -- [fitFCN] No discrete parameters, performing continuous minimization only
.[#1] INFO:Minimization -- [fitFCN] No discrete parameters, performing continuous minimization only
.[#1] INFO:Minimization -- [fitFCN] No discrete parameters, performing continuous minimization only
.[#1] INFO:Minimization -- [fitFCN] No discrete parameters, performing continuous minimization only
.[#1] INFO:Minimization -- [fitFCN] No discrete parameters, performing continuous minimization only
.[#1] INFO:Minimization -- [fitFCN] No discrete parameters, performing continuous minimization only
.[#1] INFO:Minimization -- [fitFCN] No discrete parameters, performing continuous minimization only
.[#1] INFO:Minimization -- [fitFCN] No discrete parameters, performing continuous minimization only
.[#1] INFO:Minimization -- [fitFCN] No discrete parameters, performing continuous minimization only
.[#1] INFO:Minimization -- [fitFCN] No discrete parameters, performing continuous minimization only
.[#1] INFO:Minimization -- [fitFCN] No discrete parameters, performing continuous minimization only
.[#1] INFO:Minimization -- [fitFCN] No discrete parameters, performing continuous minimization only
.[#1] INFO:Minimization -- [fitFCN] No discrete parameters, performing continuous minimization only
.[#1] INFO:Minimization -- [fitFCN] No discrete parameters, performing continuous minimization only
.[#1] INFO:Minimization -- [fitFCN] No discrete parameters, performing continuous minimization only
.[#1] INFO:Minimization -- [fitFCN] No discrete parameters, performing continuous minimization only
.[#1] INFO:Minimization -- [fitFCN] No discrete parameters, performing continuous minimization only
.[#1] INFO:Minimization -- [fitFCN] No discrete parameters, performing continuous minimization only
.[#1] INFO:Minimization -- [fitFCN] No discrete parameters, performing continuous minimization only
.[#1] INFO:Minimization -- [fitFCN] No discrete parameters, performing continuous minimization only
.[#1] INFO:Minimization -- [fitFCN] No discrete parameters, performing continuous minimization only
.[#1] INFO:Minimization -- [fitFCN] No discrete parameters, performing continuous minimization only
.[#1] INFO:Minimization -- [fitFCN] No discrete parameters, performing continuous minimization only
.[#1] INFO:Minimization -- [fitFCN] No discrete parameters, performing continuous minimization only
.[#1] INFO:Minimization -- [fitFCN] No discrete parameters, performing continuous minimization only
.[#1] INFO:Minimization -- [fitFCN] No discrete parameters, performing continuous minimization only
.[#1] INFO:Minimization -- [fitFCN] No discrete parameters, performing continuous minimization only
.[#1] INFO:Minimization -- [fitFCN] No discrete parameters, performing continuous minimization only
.[#1] INFO:Minimization -- [fitFCN] No discrete parameters, performing continuous minimization only
.[#1] INFO:Minimization -- [fitFCN] No discrete parameters, performing continuous minimization only
.[#1] INFO:Minimization -- [fitFCN] No discrete parameters, performing continuous minimization only
.[#1] INFO:Minimization -- [fitFCN] No discrete parameters, performing continuous minimization only
.[#1] INFO:Minimization -- [fitFCN] No discrete parameters, performing continuous minimization only
.[#1] INFO:Minimization -- [fitFCN] No discrete parameters, performing continuous minimization only
.[#1] INFO:Minimization -- [fitFCN] No discrete parameters, performing continuous minimization only
.[#1] INFO:Minimization -- [fitFCN] No discrete parameters, performing continuous minimization only
.[#1] INFO:Minimization -- [fitFCN] No discrete parameters, performing continuous minimization only
.[#1] INFO:Minimization -- [fitFCN] No discrete parameters, performing continuous minimization only
.[#1] INFO:Minimization -- [fitFCN] No discrete parameters, performing continuous minimization only
.[#1] INFO:Minimization -- [fitFCN] No discrete parameters, performing continuous minimization only
.[#1] INFO:Minimization -- [fitFCN] No discrete parameters, performing continuous minimization only
.[#1] INFO:Minimization -- [fitFCN] No discrete parameters, performing continuous minimization only
.[#1] INFO:Minimization -- [fitFCN] No discrete parameters, performing continuous minimization only
.[#1] INFO:Minimization -- [fitFCN] No discrete parameters, performing continuous minimization only
.[#1] INFO:Minimization -- [fitFCN] No discrete parameters, performing continuous minimization only
.[#1] INFO:Minimization -- [fitFCN] No discrete parameters, performing continuous minimization only
.[#1] INFO:Minimization -- [fitFCN] No discrete parameters, performing continuous minimization only
.[#1] INFO:Minimization -- [fitFCN] No discrete parameters, performing continuous minimization only
.[#1] INFO:Minimization -- [fitFCN] No discrete parameters, performing continuous minimization only
.[#1] INFO:Minimization -- [fitFCN] No discrete parameters, performing continuous minimization only
.[#1] INFO:Minimization -- [fitFCN] No discrete parameters, performing continuous minimization only
.[#1] INFO:Minimization -- [fitFCN] No discrete parameters, performing continuous minimization only
.[#1] INFO:Minimization -- [fitFCN] No discrete parameters, performing continuous minimization only
.[#1] INFO:Minimization -- [fitFCN] No discrete parameters, performing continuous minimization only
.[#1] INFO:Minimization -- [fitFCN] No discrete parameters, performing continuous minimization only
.[#1] INFO:Minimization -- [fitFCN] No discrete parameters, performing continuous minimization only
.[#1] INFO:Minimization -- [fitFCN] No discrete parameters, performing continuous minimization only
.[#1] INFO:Minimization -- [fitFCN] No discrete parameters, performing continuous minimization only
.[#1] INFO:Minimization -- [fitFCN] No discrete parameters, performing continuous minimization only
.[#1] INFO:Minimization -- [fitFCN] No discrete parameters, performing continuous minimization only
.[#1] INFO:Minimization -- [fitFCN] No discrete parameters, performing continuous minimization only
.[#1] INFO:Minimization -- [fitFCN] No discrete parameters, performing continuous minimization only
.[#1] INFO:Minimization -- [fitFCN] No discrete parameters, performing continuous minimization only
.[#1] INFO:Minimization -- [fitFCN] No discrete parameters, performing continuous minimization only
.[#1] INFO:Minimization -- [fitFCN] No discrete parameters, performing continuous minimization only
.[#1] INFO:Minimization -- [fitFCN] No discrete parameters, performing continuous minimization only
.[#1] INFO:Minimization -- [fitFCN] No discrete parameters, performing continuous minimization only
.[#1] INFO:Minimization -- [fitFCN] No discrete parameters, performing continuous minimization only
.[#1] INFO:Minimization -- [fitFCN] No discrete parameters, performing continuous minimization only
.[#1] INFO:Minimization -- [fitFCN] No discrete parameters, performing continuous minimization only
.[#1] INFO:Minimization -- [fitFCN] No discrete parameters, performing continuous minimization only
.[#1] INFO:Minimization -- [fitFCN] No discrete parameters, performing continuous minimization only
.[#1] INFO:Minimization -- [fitFCN] No discrete parameters, performing continuous minimization only
.[#1] INFO:Minimization -- [fitFCN] No discrete parameters, performing continuous minimization only
.[#1] INFO:Minimization -- [fitFCN] No discrete parameters, performing continuous minimization only
.[#1] INFO:Minimization -- [fitFCN] No discrete parameters, performing continuous minimization only
.[#1] INFO:Minimization -- [fitFCN] No discrete parameters, performing continuous minimization only
.[#1] INFO:Minimization -- [fitFCN] No discrete parameters, performing continuous minimization only
.[#1] INFO:Minimization -- [fitFCN] No discrete parameters, performing continuous minimization only
.[#1] INFO:Minimization -- [fitFCN] No discrete parameters, performing continuous minimization only
.[#1] INFO:Minimization -- [fitFCN] No discrete parameters, performing continuous minimization only
.[#1] INFO:Minimization -- [fitFCN] No discrete parameters, performing continuous minimization only
.[#1] INFO:Minimization -- [fitFCN] No discrete parameters, performing continuous minimization only
.[#1] INFO:Minimization -- [fitFCN] No discrete parameters, performing continuous minimization only
.[#1] INFO:Minimization -- [fitFCN] No discrete parameters, performing continuous minimization only
.[#1] INFO:Minimization -- [fitFCN] No discrete parameters, performing continuous minimization only
.[#1] INFO:Minimization -- [fitFCN] No discrete parameters, performing continuous minimization only
.[#1] INFO:Minimization -- [fitFCN] No discrete parameters, performing continuous minimization only
.[#1] INFO:Minimization -- [fitFCN] No discrete parameters, performing continuous minimization only
.[#1] INFO:Minimization -- [fitFCN] No discrete parameters, performing continuous minimization only
.[#1] INFO:Minimization -- [fitFCN] No discrete parameters, performing continuous minimization only
.[#1] INFO:Minimization -- [fitFCN] No discrete parameters, performing continuous minimization only
.[#1] INFO:Minimization -- [fitFCN] No discrete parameters, performing continuous minimization only
.[#1] INFO:Minimization -- [fitFCN] No discrete parameters, performing continuous minimization only
.[#1] INFO:Minimization -- [fitFCN] No discrete parameters, performing continuous minimization only
lower limit on master signal = 0.089069
upper limit on master signal = 2.00127
-------------------------------------------------
Consider this parameter point:
RooRealVar::masterSignal = 0 +/- 0.477956 L(0 - 3)
It is NOT in the interval.
-------------------------------------------------
-------------------------------------------------
Consider this parameter point:
RooRealVar::masterSignal = 2 +/- 0.477956 L(0 - 3)
It IS in the interval.
-------------------------------------------------