
 Getting Contours From TH2D.
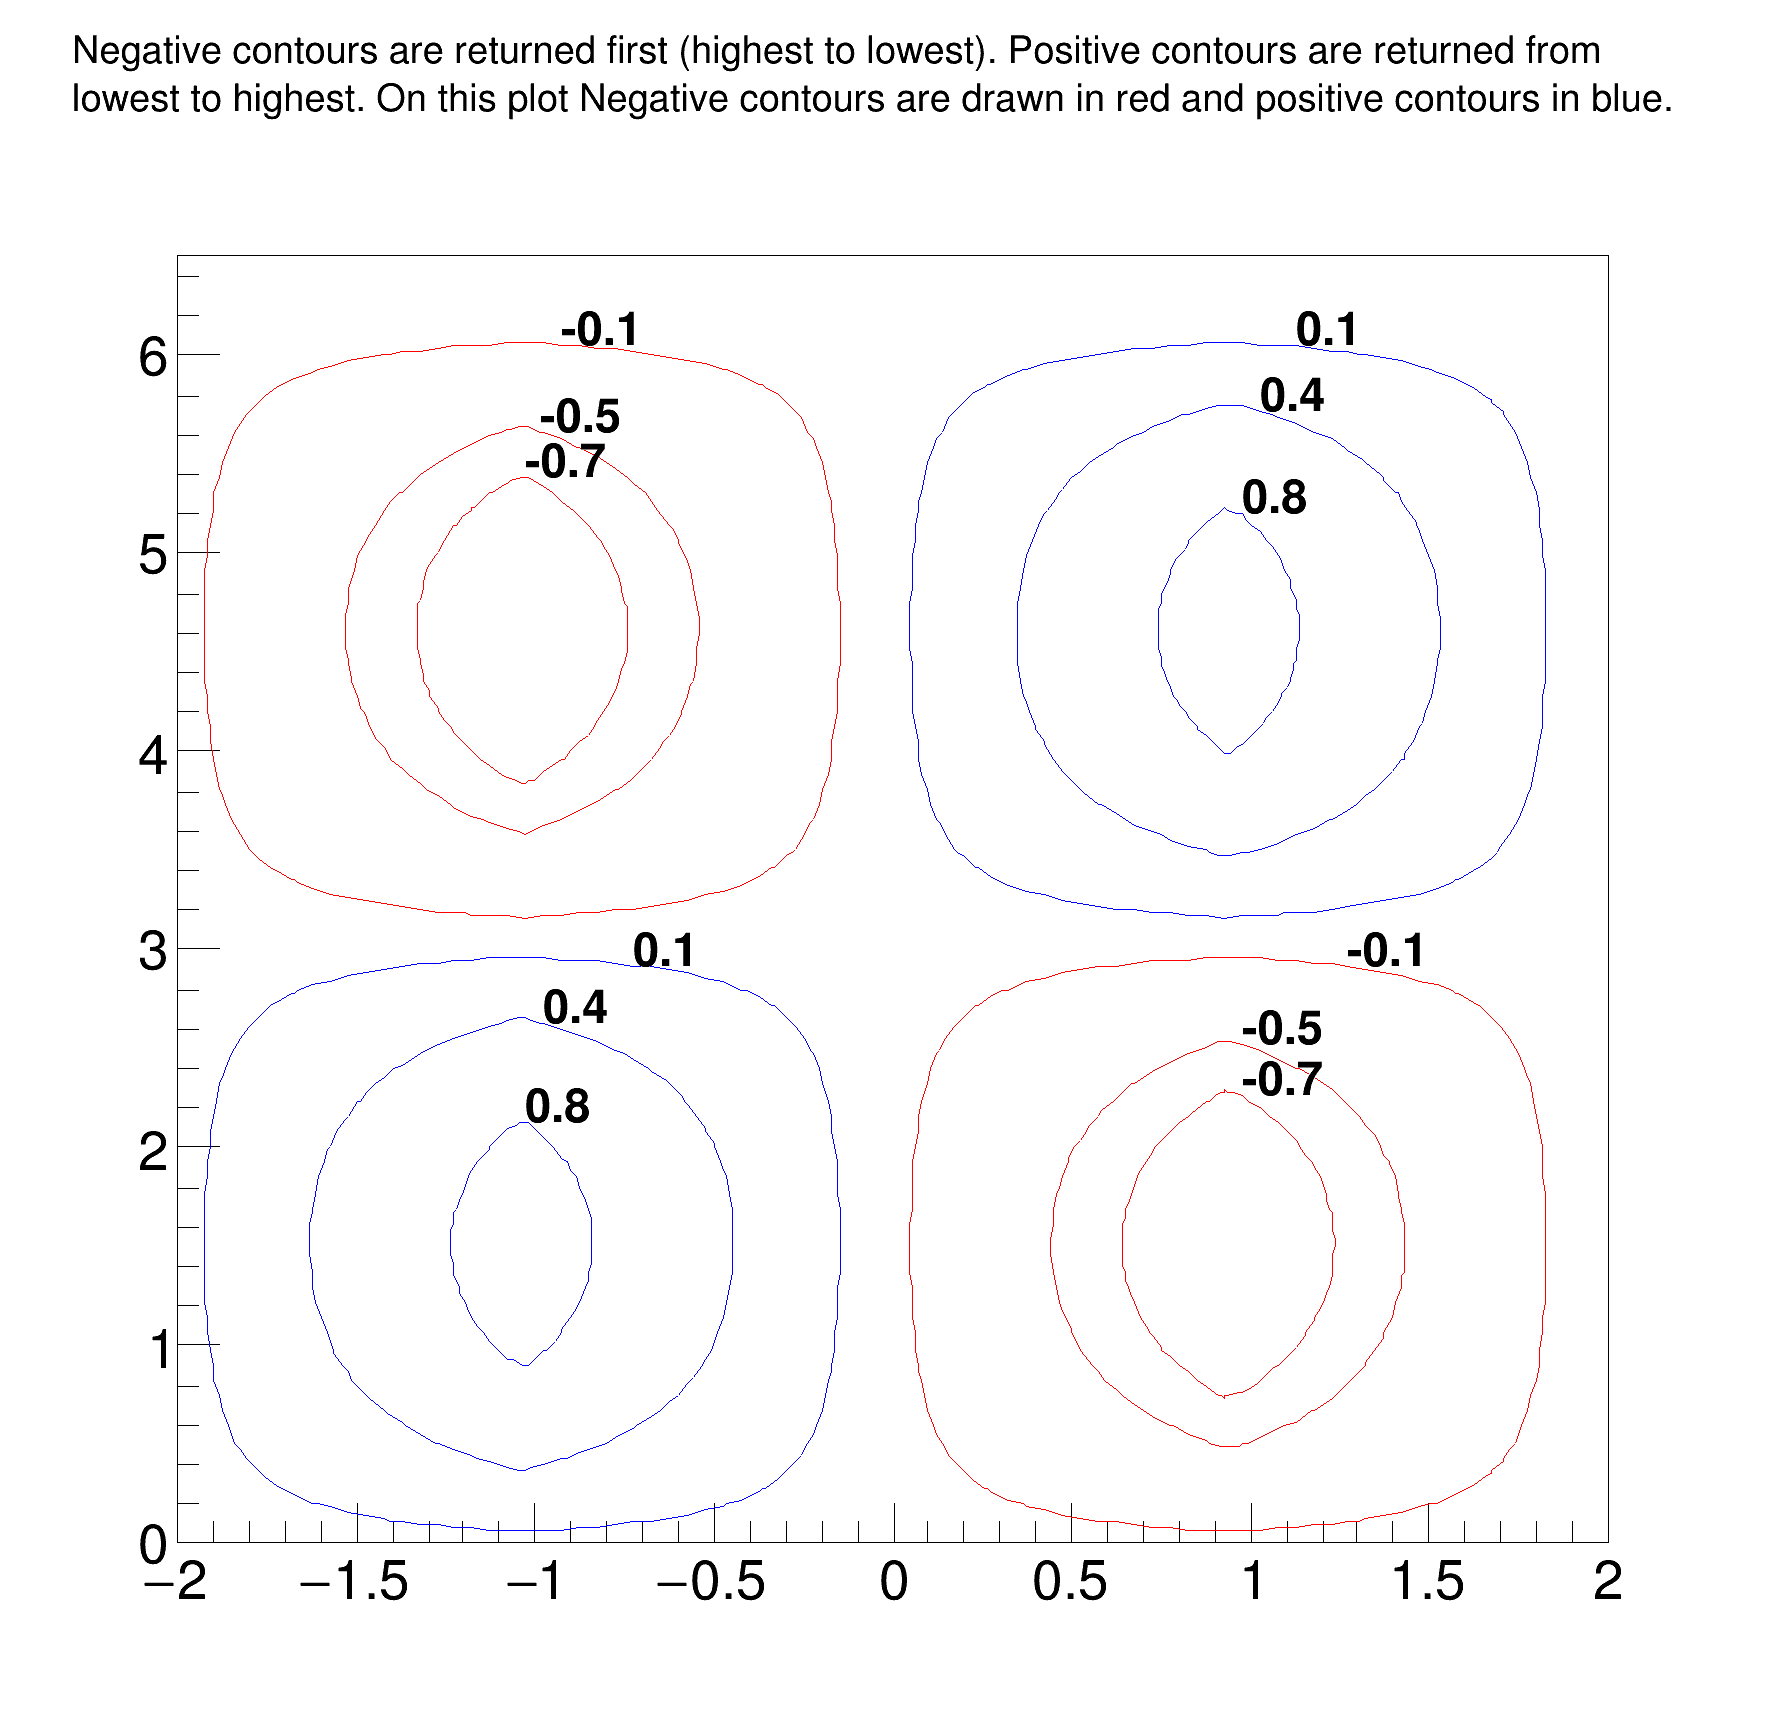
The contours values are drawn next to each contour.
It shows that 6 contours and 12 graphs were found.
Processing /mnt/build/workspace/root-makedoc-v614/rootspi/rdoc/src/v6-14-00-patches/tutorials/hist/ContourList.C...
TotalConts = 6
Contour 0 has 2 Graphs
Contour 1 has 2 Graphs
Contour 2 has 2 Graphs
Contour 3 has 2 Graphs
Contour 4 has 2 Graphs
Contour 5 has 2 Graphs
Z-Level Passed in as: Z = -0.100000
Graph: 1 -- 147 Elements
Graph: 2 -- 147 Elements
Z-Level Passed in as: Z = -0.500000
Graph: 3 -- 93 Elements
Graph: 4 -- 93 Elements
Z-Level Passed in as: Z = -0.700000
Graph: 5 -- 65 Elements
Graph: 6 -- 65 Elements
Z-Level Passed in as: Z = 0.100000
Graph: 7 -- 147 Elements
Graph: 8 -- 147 Elements
Z-Level Passed in as: Z = 0.400000
Graph: 9 -- 107 Elements
Graph: 10 -- 107 Elements
Z-Level Passed in as: Z = 0.800000
Graph: 11 -- 49 Elements
Graph: 12 -- 49 Elements
Extracted 6 Contours and 12 Graphs
(TCanvas *) 0x26376d0
for ( i = 0; i < nZsamples; i++) {
z[i] = (i)*dZ - HofZwavelength/2.0;
HofZ[i] = SawTooth(z[i], HofZwavelength);
}
for(
Int_t i=0; i < nPhiSamples; i++){
phi[i] = (i)*dPhi;
}
TH2D *HistStreamFn =
new TH2D(
"HstreamFn",
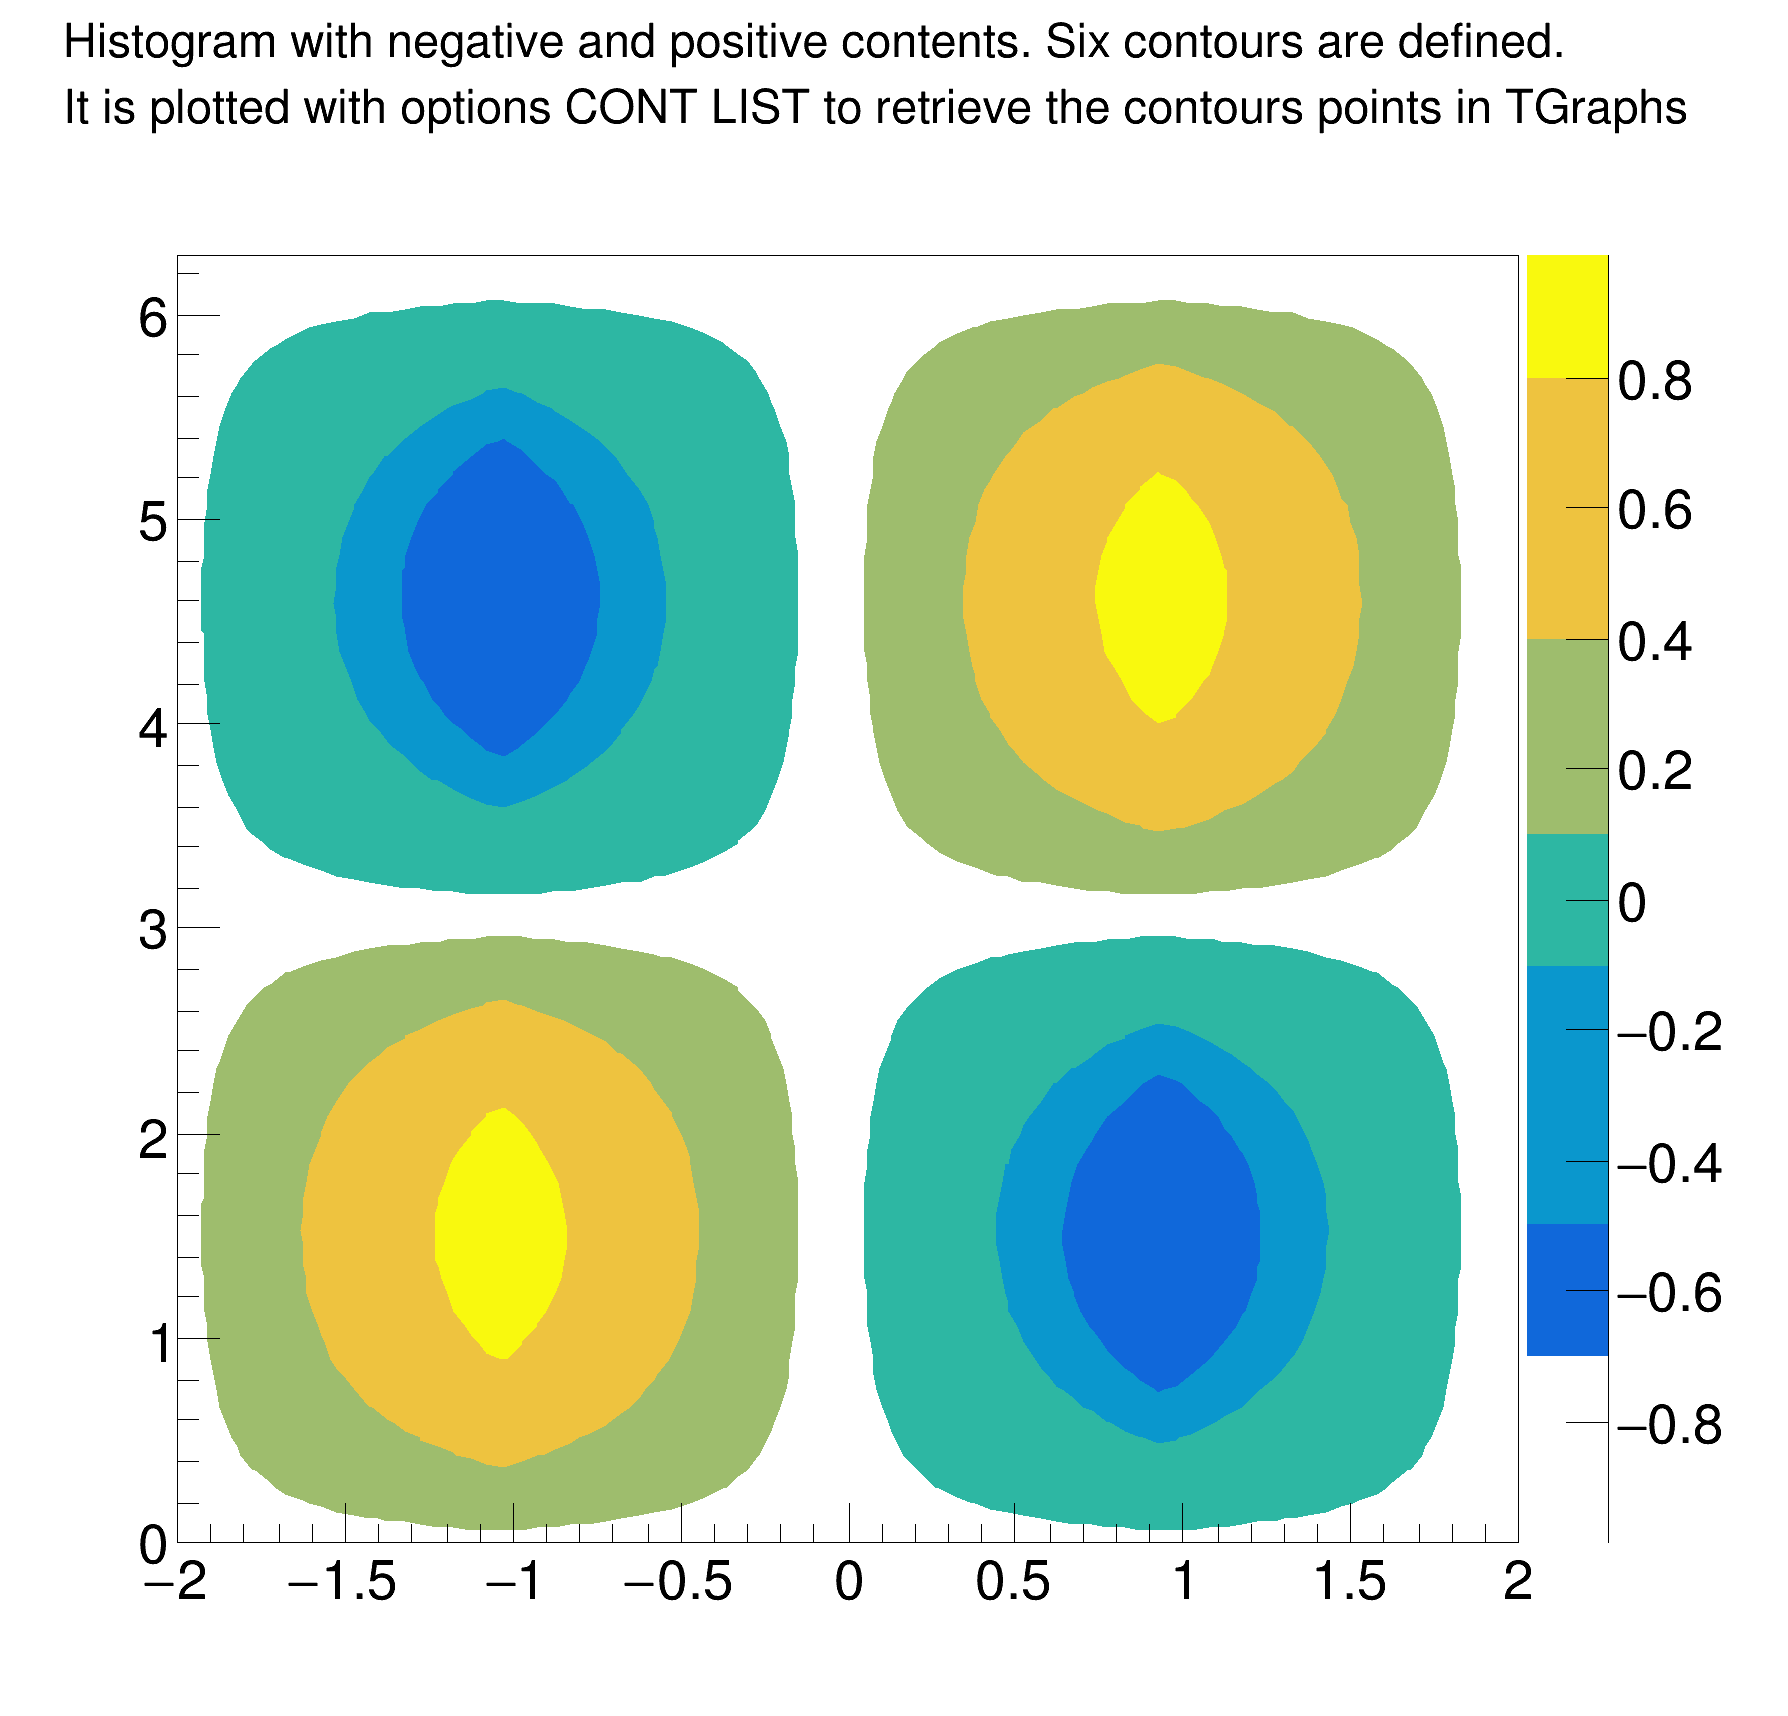
"#splitline{Histogram with negative and positive contents. Six contours are defined.}{It is plotted with options CONT LIST to retrieve the contours points in TGraphs}",
nZsamples, z[0], z[nZsamples-1], nPhiSamples, phi[0], phi[nPhiSamples-1]);
for (
Int_t i = 0; i < nZsamples; i++) {
for(
Int_t j = 0; j < nPhiSamples; j++){
}
}
contours[0] = -0.7;
contours[1] = -0.5;
contours[2] = -0.1;
contours[3] = 0.1;
contours[4] = 0.4;
contours[5] = 0.8;
HistStreamFn->
Draw(
"CONT Z LIST");
if (conts == NULL){
printf("*** No Contours Were Extracted!\n");
TotalConts = 0;
return 0;
} else {
}
printf("TotalConts = %d\n", TotalConts);
for(i = 0; i < TotalConts; i++){
printf(
"Contour %d has %d Graphs\n", i, contLevel->
GetSize());
}
nGraphs = 0;
"#splitline{Negative contours are returned first (highest to lowest). Positive contours are returned from}{lowest to highest. On this plot Negative contours are drawn in red and positive contours in blue.}",
2, -2, 2, 2, 0, 6.5);
char val[20];
for(i = 0; i < TotalConts; i++){
if (i<3) zval0 = contours[2-i];
else zval0 = contours[i];
printf("Z-Level Passed in as: Z = %f\n", zval0);
for(j = 0; j < contLevel->
GetSize(); j++){
nGraphs ++;
printf(
"\tGraph: %d -- %d Elements\n", nGraphs,curv->
GetN());
sprintf(val,"%g",zval0);
}
}
printf("\n\n\tExtracted %d Contours and %d Graphs \n", TotalConts, nGraphs );
}
if ( (x < -WaveLen/2) || (x > WaveLen/2)) y = -99999999;
if (x <= -WaveLen/4) {
y = x + 2.0;
} else if ((x > -WaveLen/4) && (x <= WaveLen/4)) {
} else if (( x > WaveLen/4) && (x <= WaveLen/2)) {
y = x - 2.0;
}
}
- Authors
- Josh de Bever (CSI Medical Physics Group, The University of Western Ontario, London, Ontario, Canada), Olivier Couet
Definition in file ContourList.C.

 ROOT 6.14/05 - Reference Guide Generated on Fri Nov 2 2018 10:58:29 (GVA Time) using Doxygen 1.8.13.