This tutorial shows an example of a combination of two searches using number counting with background uncertainty.
Processing /mnt/build/workspace/root-makedoc-v614/rootspi/rdoc/src/v6-14-00-patches/tutorials/roostats/rs_numberCountingCombination.C...
�[1mRooFit v3.60 -- Developed by Wouter Verkerke and David Kirkby�[0m
Copyright (C) 2000-2013 NIKHEF, University of California & Stanford University
All rights reserved, please read http://roofit.sourceforge.net/license.txt
[#0] WARNING:ObjectHandling -- NumberCountingPdfFactory: changed value of tau_0 to 100.01 to be consistent with background and its uncertainty. Also stored these values of tau into workspace with name . tau_0ExpectedNumberCountingData if you test with a different dataset, you should adjust tau appropriately.
[#0] WARNING:ObjectHandling -- NumberCountingPdfFactory: changed value of tau_1 to 100.01 to be consistent with background and its uncertainty. Also stored these values of tau into workspace with name . tau_1ExpectedNumberCountingData if you test with a different dataset, you should adjust tau appropriately.
[#1] INFO:Minization -- createNLL: caching constraint set under name CONSTR_OF_PDF_TopLevelPdf_FOR_OBS_x_0:x_1:y_0:y_1 with 0 entries
[#0] PROGRESS:Minization -- ProfileLikelihoodCalcultor::DoGLobalFit - find MLE
[#0] PROGRESS:Minization -- ProfileLikelihoodCalcultor::DoMinimizeNLL - using Minuit / Migrad with strategy 1
[#1] INFO:Minization -- RooMinimizer::optimizeConst: activating const optimization
[#1] INFO:Minization -- The following expressions will be evaluated in cache-and-track mode: (sigRegion_0,sideband_0,sigRegion_1,sideband_1)
[#1] INFO:Minization --
RooFitResult: minimized FCN value: 17.6316, estimated distance to minimum: 1.74281e-14
covariance matrix quality: Full, accurate covariance matrix
Status : MINIMIZE=0
Floating Parameter FinalValue +/- Error
-------------------- --------------------------
b_0 1.0000e+02 +/- 9.99e-01
b_1 1.0000e+02 +/- 9.96e-01
masterSignal 1.0000e+00 +/- 4.78e-01
[#0] PROGRESS:Minization -- ProfileLikelihoodCalcultor::GetHypoTest - do conditional fit
[#0] PROGRESS:Minization -- ProfileLikelihoodCalcultor::DoMinimizeNLL - using Minuit / Migrad with strategy 1
[#1] INFO:Minization -- RooMinimizer::optimizeConst: activating const optimization
[#1] INFO:Minization --
RooFitResult: minimized FCN value: 19.9696, estimated distance to minimum: 1.46942e-07
covariance matrix quality: Full, accurate covariance matrix
Status : MINIMIZE=0
Floating Parameter FinalValue +/- Error
-------------------- --------------------------
b_0 1.0020e+02 +/- 9.96e-01
b_1 1.0010e+02 +/- 9.95e-01
-------------------------------------------------
The p-value for the null is 0.015294
Corresponding to a significance of 2.16239
-------------------------------------------------
[#1] INFO:Minization -- createNLL picked up cached consraints from workspace with 0 entries
[#0] PROGRESS:Minization -- ProfileLikelihoodCalcultor::DoGLobalFit - find MLE
[#0] PROGRESS:Minization -- ProfileLikelihoodCalcultor::DoMinimizeNLL - using Minuit / Migrad with strategy 1
[#1] INFO:Minization -- RooMinimizer::optimizeConst: activating const optimization
[#1] INFO:Minization -- The following expressions will be evaluated in cache-and-track mode: (sigRegion_0,sideband_0,sigRegion_1,sideband_1)
[#1] INFO:Minization --
RooFitResult: minimized FCN value: 17.6316, estimated distance to minimum: 4.62901e-07
covariance matrix quality: Full, accurate covariance matrix
Status : MINIMIZE=0
Floating Parameter FinalValue +/- Error
-------------------- --------------------------
b_0 1.0000e+02 +/- 9.99e-01
b_1 1.0000e+02 +/- 9.96e-01
masterSignal 9.9967e-01 +/- 4.78e-01
[#1] INFO:Minization -- RooProfileLL::evaluate(nll_TopLevelPdf_ExpectedNumberCountingData_Profile[masterSignal]) Creating instance of MINUIT
[#1] INFO:Minization -- RooProfileLL::evaluate(nll_TopLevelPdf_ExpectedNumberCountingData_Profile[masterSignal]) determining minimum likelihood for current configurations w.r.t all observable
[#1] INFO:Minization -- RooProfileLL::evaluate(nll_TopLevelPdf_ExpectedNumberCountingData_Profile[masterSignal]) minimum found at (masterSignal=1.00002)
.
[#1] INFO:Minization -- RooProfileLL::evaluate(nll_TopLevelPdf_ExpectedNumberCountingData_Profile[masterSignal]) Creating instance of MINUIT
[#1] INFO:Minization -- RooProfileLL::evaluate(nll_TopLevelPdf_ExpectedNumberCountingData_Profile[masterSignal]) determining minimum likelihood for current configurations w.r.t all observable
[#0] ERROR:InputArguments -- RooArgSet::checkForDup: ERROR argument with name masterSignal is already in this set
[#1] INFO:Minization -- RooProfileLL::evaluate(nll_TopLevelPdf_ExpectedNumberCountingData_Profile[masterSignal]) minimum found at (masterSignal=1.00007)
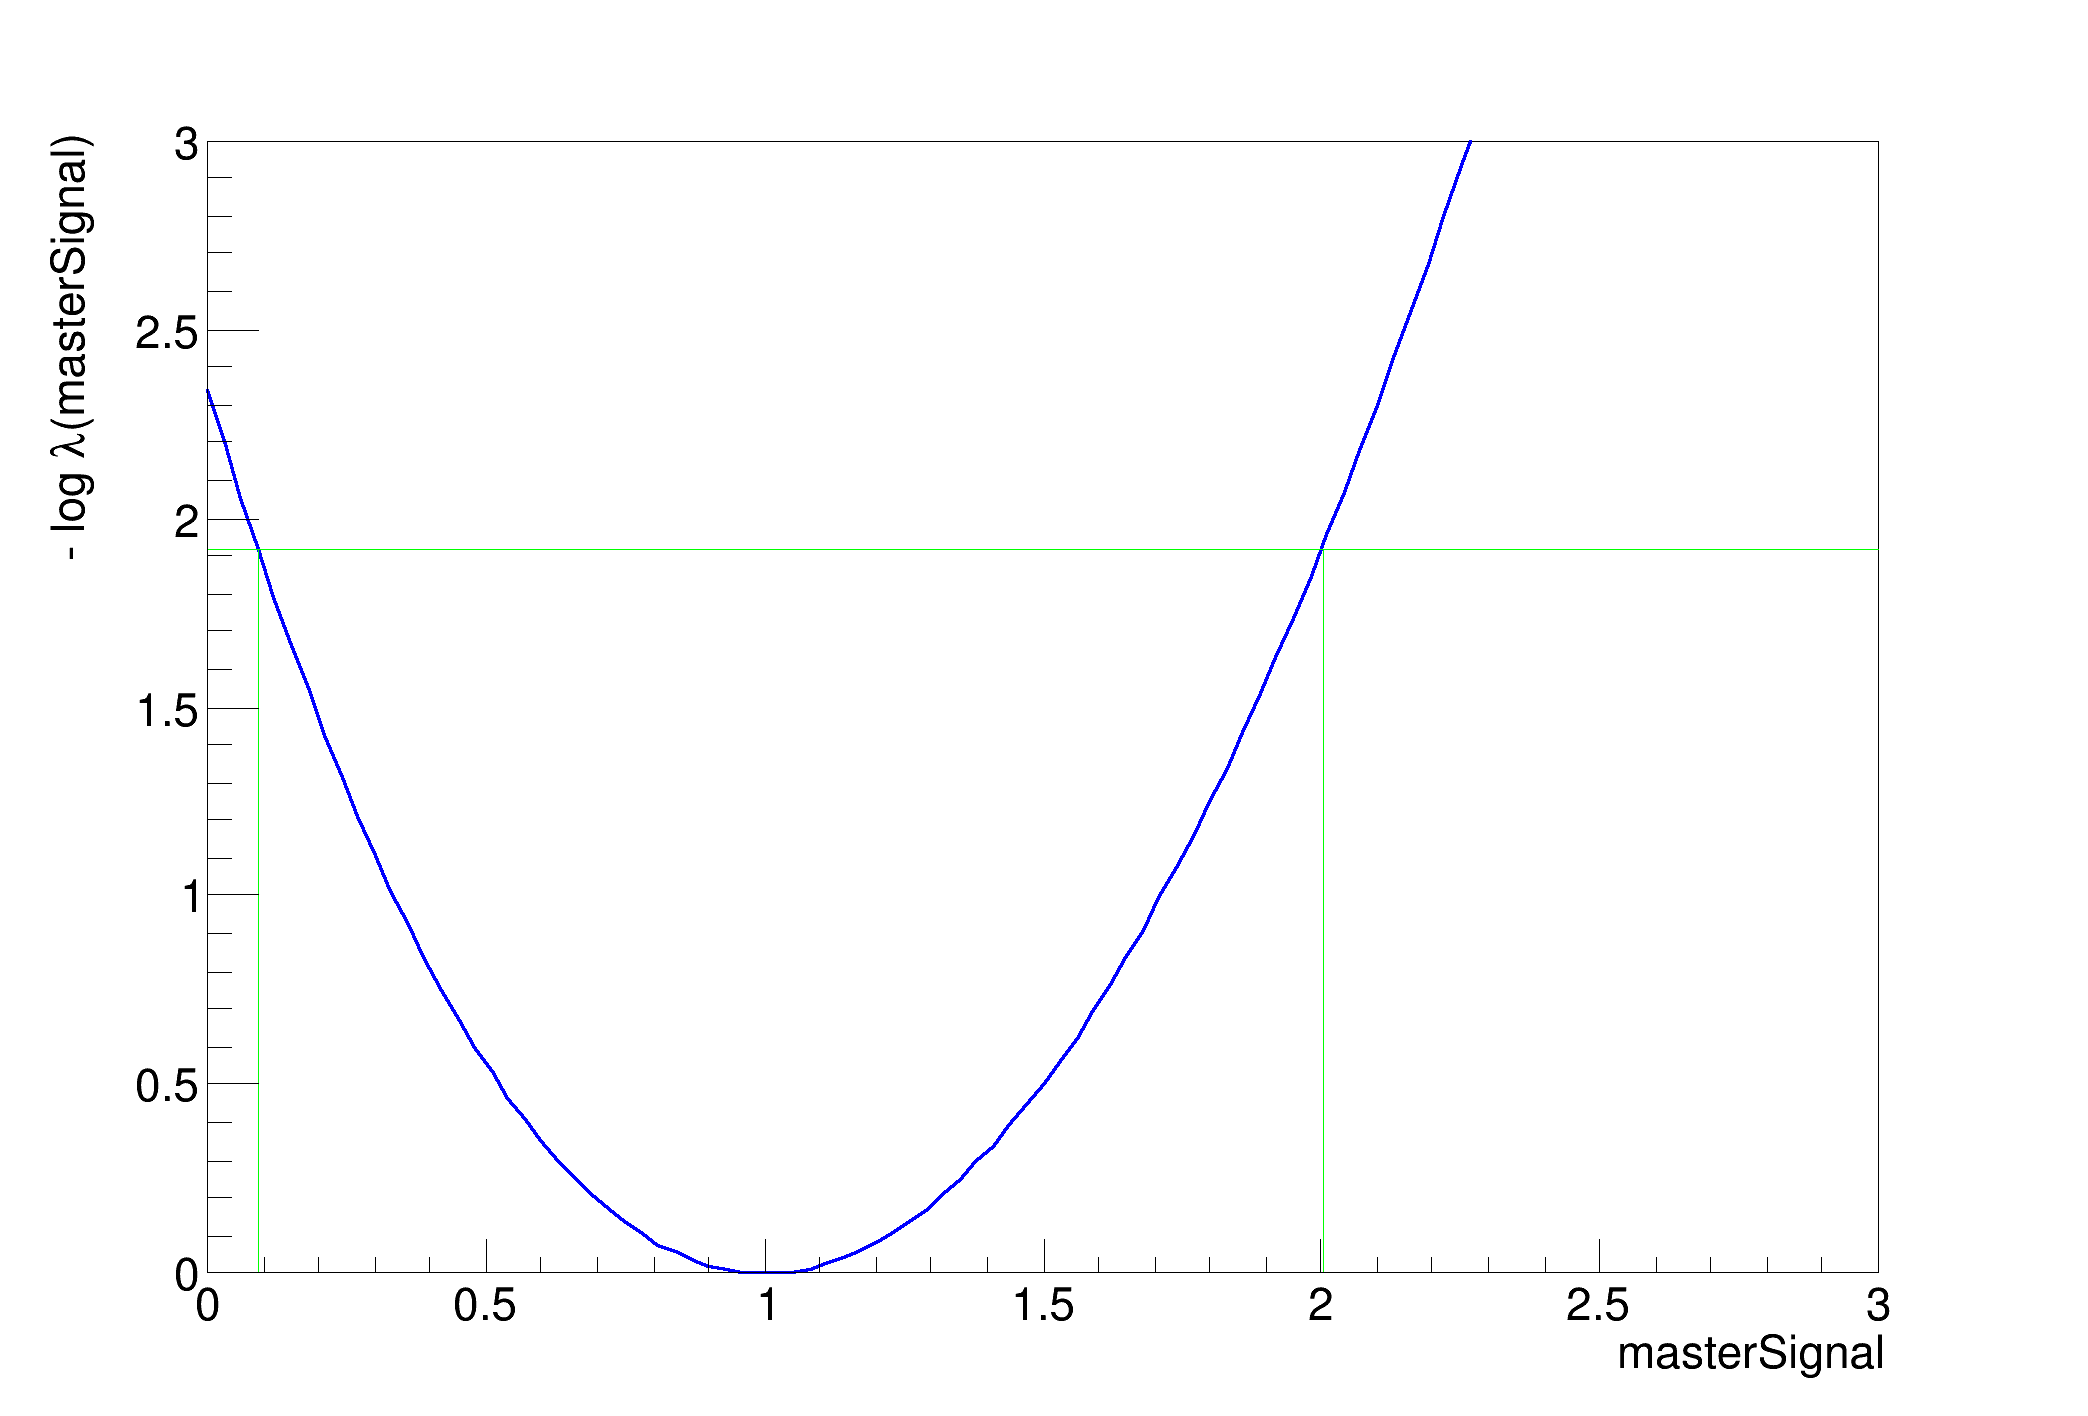
..........................................................................................................................................................................................................lower limit on master signal = 0.089069
upper limit on master signal = 2.00127
-------------------------------------------------
Consider this parameter point:
RooRealVar::masterSignal = 0 +/- 0.477956 L(0 - 3)
It is NOT in the interval.
-------------------------------------------------
-------------------------------------------------
Consider this parameter point:
RooRealVar::masterSignal = 2 +/- 0.477956 L(0 - 3)
It IS in the interval.
-------------------------------------------------
#include <cassert>
void rs_numberCountingCombination_expected();
void rs_numberCountingCombination_observed();
void rs_numberCountingCombination_observedWithTau();
void rs_numberCountingCombination(int flag=1)
{
if(flag==1)
rs_numberCountingCombination_expected();
if(flag==2)
rs_numberCountingCombination_observed();
if(flag==3)
rs_numberCountingCombination_observedWithTau();
}
void rs_numberCountingCombination_expected()
{
f.
AddModel(s,2,wspace,
"TopLevelPdf",
"masterSignal");
f.
AddExpData(s, b, db, 2, wspace,
"ExpectedNumberCountingData");
*wspace->
pdf(
"TopLevelPdf"), *poi, 0.05, nullParams);
assert(htr != 0);
cout << "-------------------------------------------------" << endl;
cout << "The p-value for the null is " << htr->NullPValue() << endl;
cout << "Corresponding to a significance of " << htr->Significance() << endl;
cout << "-------------------------------------------------\n\n" << endl;
lrPlot.SetMaximum(3.);
lrPlot.Draw();
cout << "lower limit on master signal = " << lower << endl;
cout << "upper limit on master signal = " << upper << endl;
cout << "-------------------------------------------------" << endl;
std::cout << "Consider this parameter point:" << std::endl;
std::cout << "It IS in the interval." << std::endl;
else
std::cout << "It is NOT in the interval." << std::endl;
cout << "-------------------------------------------------\n\n" << endl;
delete lrint;
delete htr;
delete wspace;
delete poi;
delete nullParams;
}
void rs_numberCountingCombination_observed()
{
f.
AddModel(s,2,wspace,
"TopLevelPdf",
"masterSignal");
f.
AddData(mainMeas, bkgMeas, dbMeas, 2, wspace,
"ObservedNumberCountingData");
*wspace->
pdf(
"TopLevelPdf"), *poi, 0.05, nullParams);
cout << "-------------------------------------------------" << endl;
cout <<
"The p-value for the null is " << htr->
NullPValue() << endl;
cout <<
"Corresponding to a significance of " << htr->
Significance() << endl;
cout << "-------------------------------------------------\n\n" << endl;
cout <<
"lower limit on master signal = " << lrint->
LowerLimit(*mu ) << endl;
cout <<
"upper limit on master signal = " << lrint->
UpperLimit(*mu ) << endl;
delete lrint;
delete htr;
delete wspace;
delete nullParams;
delete poi;
}
void rs_numberCountingCombination_observedWithTau()
{
f.
AddModel(s,2,wspace,
"TopLevelPdf",
"masterSignal");
f.
AddDataWithSideband(mainMeas, sideband, tau, 2, wspace,
"ObservedNumberCountingDataWithSideband");
*wspace->
pdf(
"TopLevelPdf"), *poi, 0.05, nullParams);
cout << "-------------------------------------------------" << endl;
cout <<
"The p-value for the null is " << htr->
NullPValue() << endl;
cout << "Corresponding to a significance of " << htr->Significance() << endl;
cout << "-------------------------------------------------\n\n" << endl;
cout <<
"lower limit on master signal = " << lrint->
LowerLimit(*mu ) << endl;
cout <<
"upper limit on master signal = " << lrint->
UpperLimit(*mu ) << endl;
delete lrint;
delete htr;
delete wspace;
delete nullParams;
delete poi;
}


 ROOT 6.14/05 - Reference Guide Generated on Fri Nov 2 2018 10:59:06 (GVA Time) using Doxygen 1.8.13.