
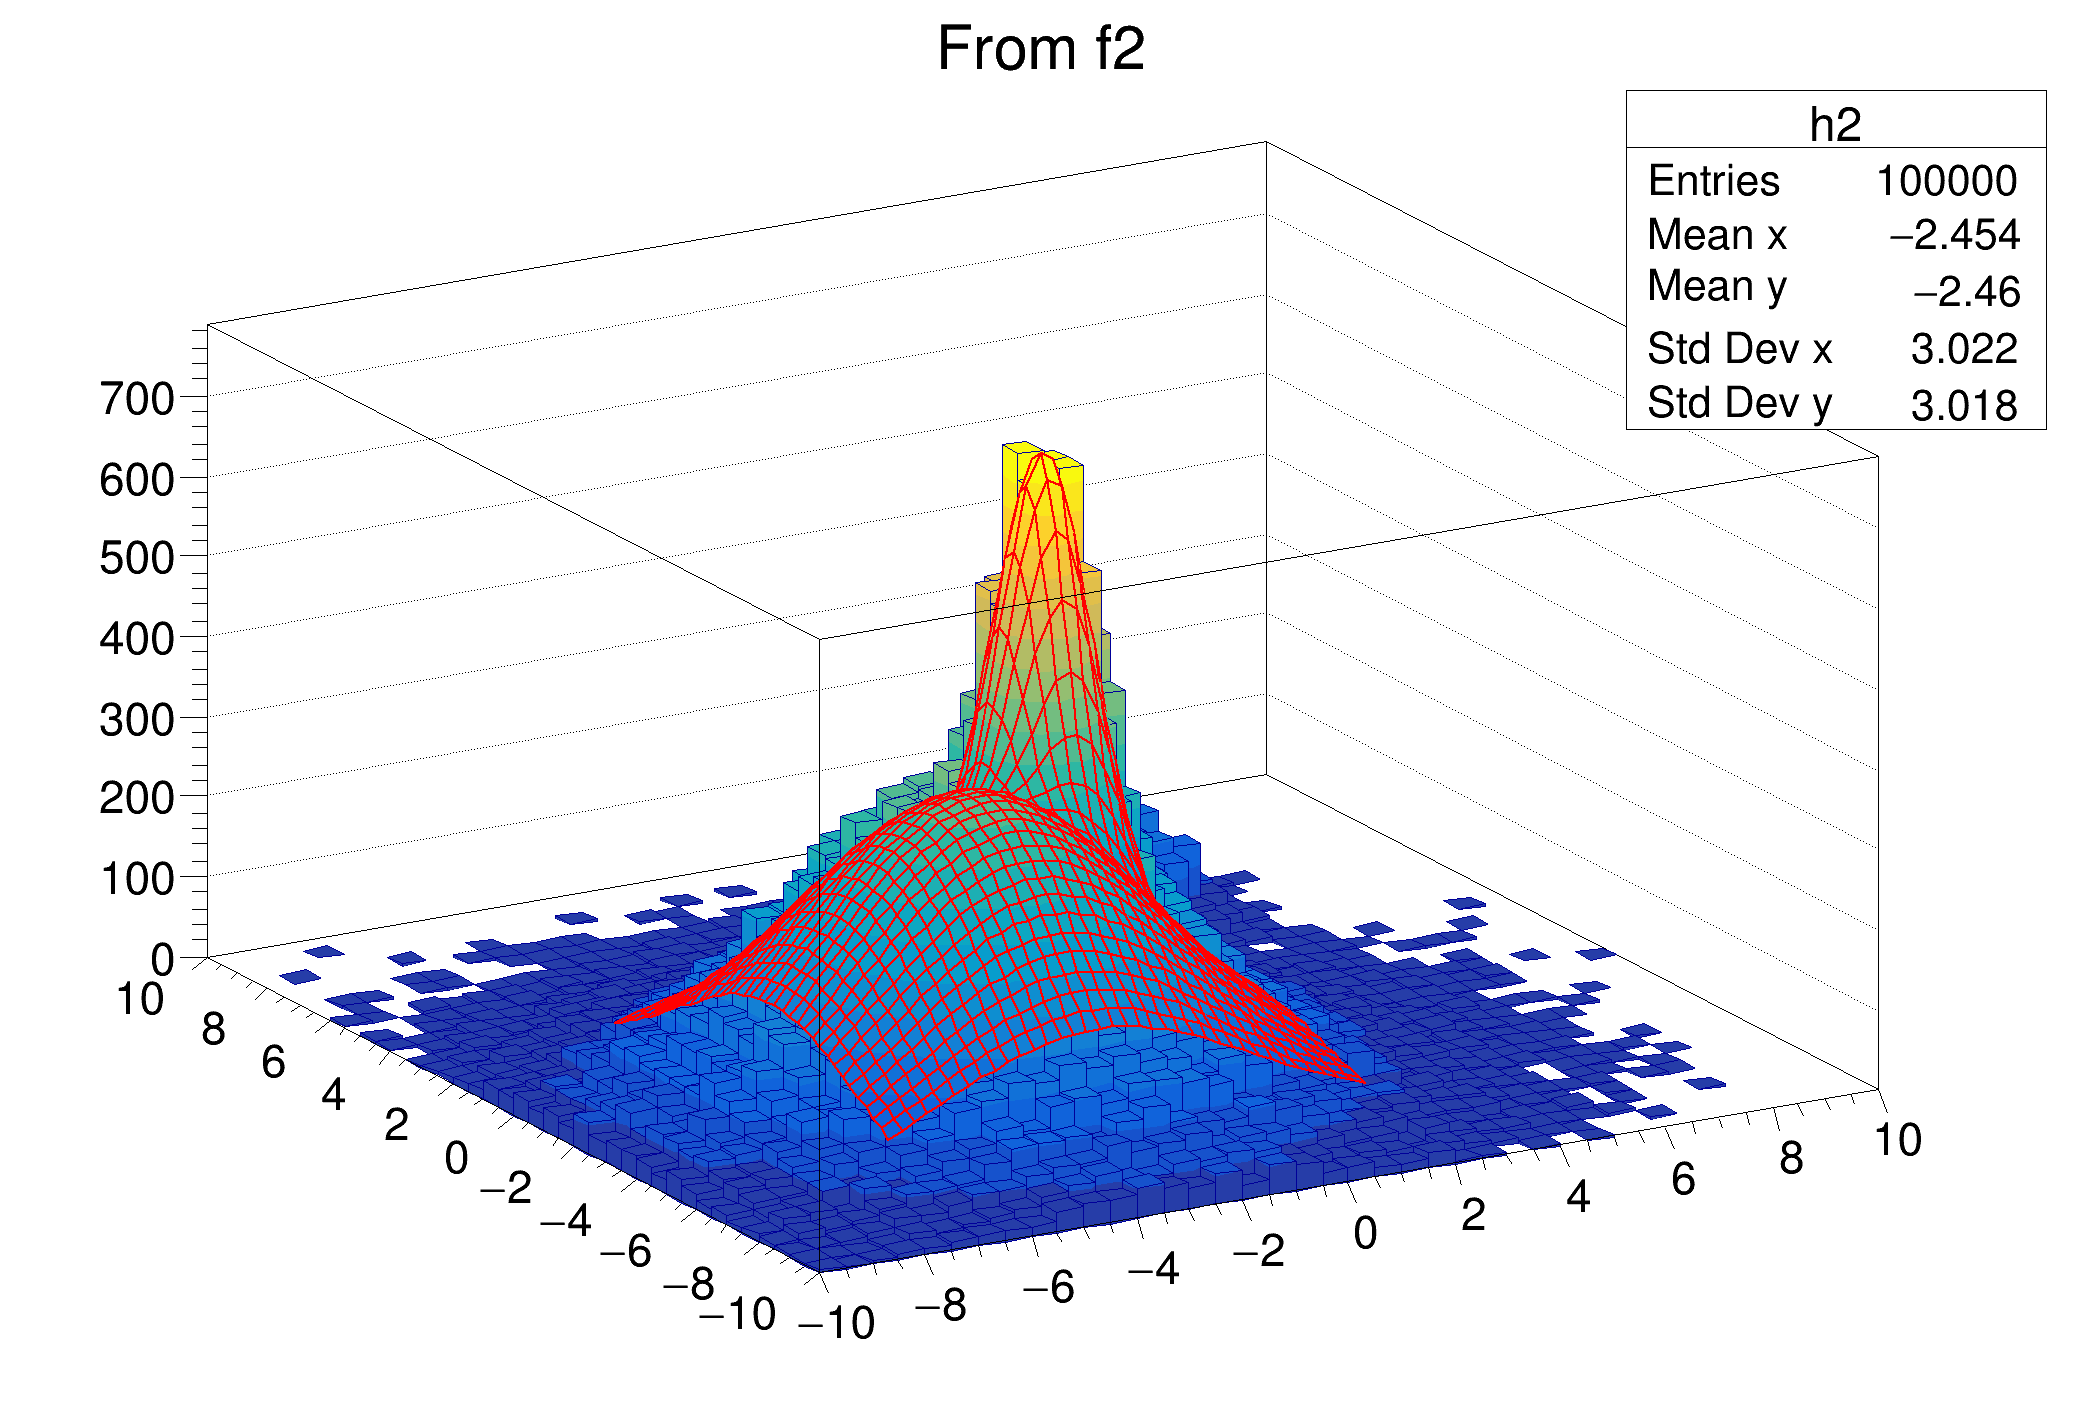
 Fitting a 2-D histogram (a variant) This tutorial illustrates :
- how to create a 2-d function
- fill a 2-d histogram randomly from this function
- fit the histogram
- display the fitted function on top of the histogram (lego-plot) using a surface plot in a sub-range of the histogram.
This example can be executed via the interpreter or/and the compiler
root > .x fit2a.C
root > .x fit2a.C++
FCN=1048.29 FROM MIGRAD STATUS=CONVERGED 384 CALLS 385 TOTAL
EDM=1.71323e-07 STRATEGY= 1 ERROR MATRIX UNCERTAINTY 1.7 per cent
EXT PARAMETER STEP FIRST
NO. NAME VALUE ERROR SIZE DERIVATIVE
1 p0 3.92557e+02 1.80794e+00 -8.93086e-04 1.08685e-04
2 p1 -2.99839e+00 1.13352e-02 -6.49024e-06 -1.81171e-02
3 p2 2.98485e+00 7.41044e-03 3.61030e-06 -5.86707e-02
4 p3 -3.00202e+00 1.11595e-02 -5.78996e-06 -1.75293e-02
5 p4 2.97271e+00 7.15832e-03 -3.28538e-06 -4.12677e-02
6 p5 6.01136e+02 9.83774e+00 3.21497e-03 -2.69040e-05
7 p6 6.14587e-03 1.13579e-02 5.13989e-06 2.41418e-02
8 p7 8.16263e-01 9.52518e-03 3.01650e-06 -8.27896e-03
9 p8 -7.76134e-04 1.27854e-02 5.13131e-06 -5.37304e-03
10 p9 9.11281e-01 1.09052e-02 -6.70503e-06 2.34952e-02
11 p10 1.46899e+02 4.66962e+00 -3.42267e-04 5.38648e-05
12 p11 3.98822e+00 1.79131e-02 1.99376e-05 9.00611e-03
13 p12 7.27558e-01 1.32237e-02 -2.78350e-06 5.94843e-03
14 p13 4.02638e+00 1.71292e-02 4.21853e-06 5.32476e-03
15 p14 7.03078e-01 1.29939e-02 1.10618e-06 -3.47421e-02
(TCanvas *) 0x55bcd6caa0f0
}
return result;
}
Double_t f2params[npar] = {100,-3,3,-3,3,160,0,0.8,0,0.9,40,4,0.7,4,0.7};
auto f2 =
new TF2(
"f2",fun2,-10,10,-10,10, npar);
f2->SetParameters(f2params);
auto h2 =
new TH2F(
"h2",
"From f2",40,-10,10,40,-10,10);
f2params[ 0] *= ratio;
f2params[ 5] *= ratio;
f2params[10] *= ratio;
f2->SetParameters(f2params);
h2->Fit("f2","N");
auto cutg =
new TCutG(
"cutg",5);
cutg->SetPoint(0,-7,-7);
cutg->SetPoint(1, 2,-7);
cutg->SetPoint(2, 2, 2);
cutg->SetPoint(3,-7, 2);
cutg->SetPoint(4,-7,-7);
h2->Draw("lego2 0");
h2->SetFillColor(38);
f2->SetNpx(80);
f2->SetNpy(80);
f2->Draw("surf1 same bb [cutg]");
}
R__EXTERN TStyle * gStyle
A 2-Dim function with parameters.
2-D histogram with a float per channel (see TH1 documentation)}
void SetOptStat(Int_t stat=1)
The type of information printed in the histogram statistics box can be selected via the parameter mod...
void SetPalette(Int_t ncolors=kBird, Int_t *colors=0, Float_t alpha=1.)
See TColor::SetPalette.
- Author
- Rene Brun
Definition in file fit2a.C.