 |
ROOT
Reference Guide |


|
| |
ROOT
Reference Guide |
|
Namespaces | |
| namespace | ratioplot5 |

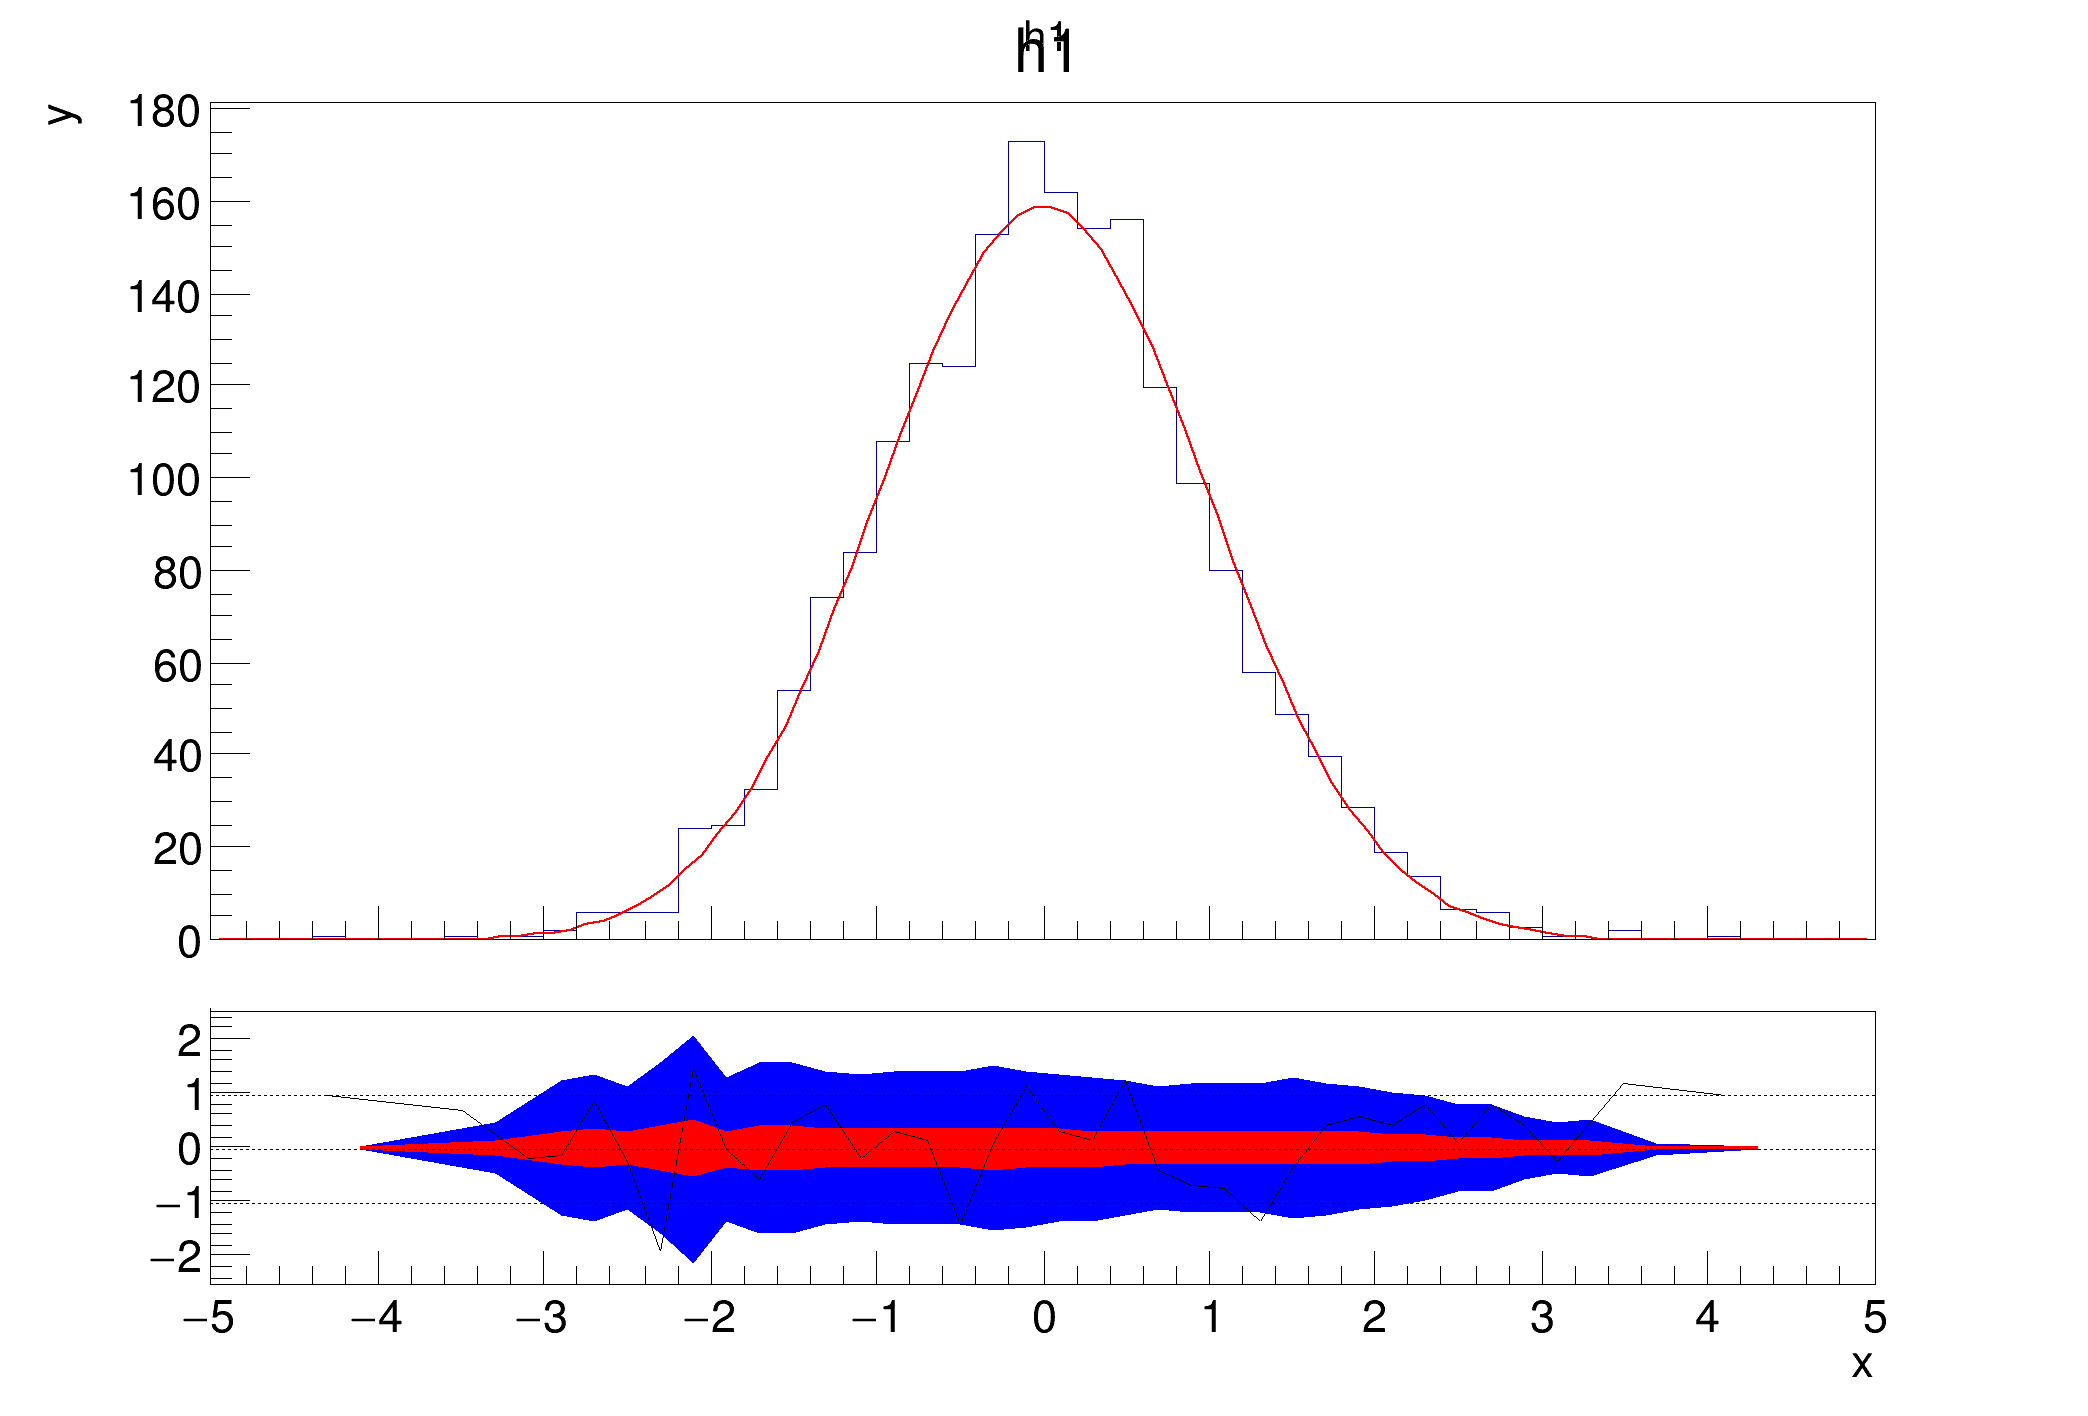
![]() Example that shows how you can set the colors of the confidence interval bands by using the method
Example that shows how you can set the colors of the confidence interval bands by using the method TRatioPlot::SetConfidenceIntervalColors.
Inspired by the tutorial of Paul Gessinger.
Definition in file ratioplot5.py.
