Logo ROOT  
Reference Guide
 
Loading...
Searching...
No Matches
TestSPlot.C File Reference

Detailed Description

This tutorial illustrates the use of class TSPlot and of the sPlots method.

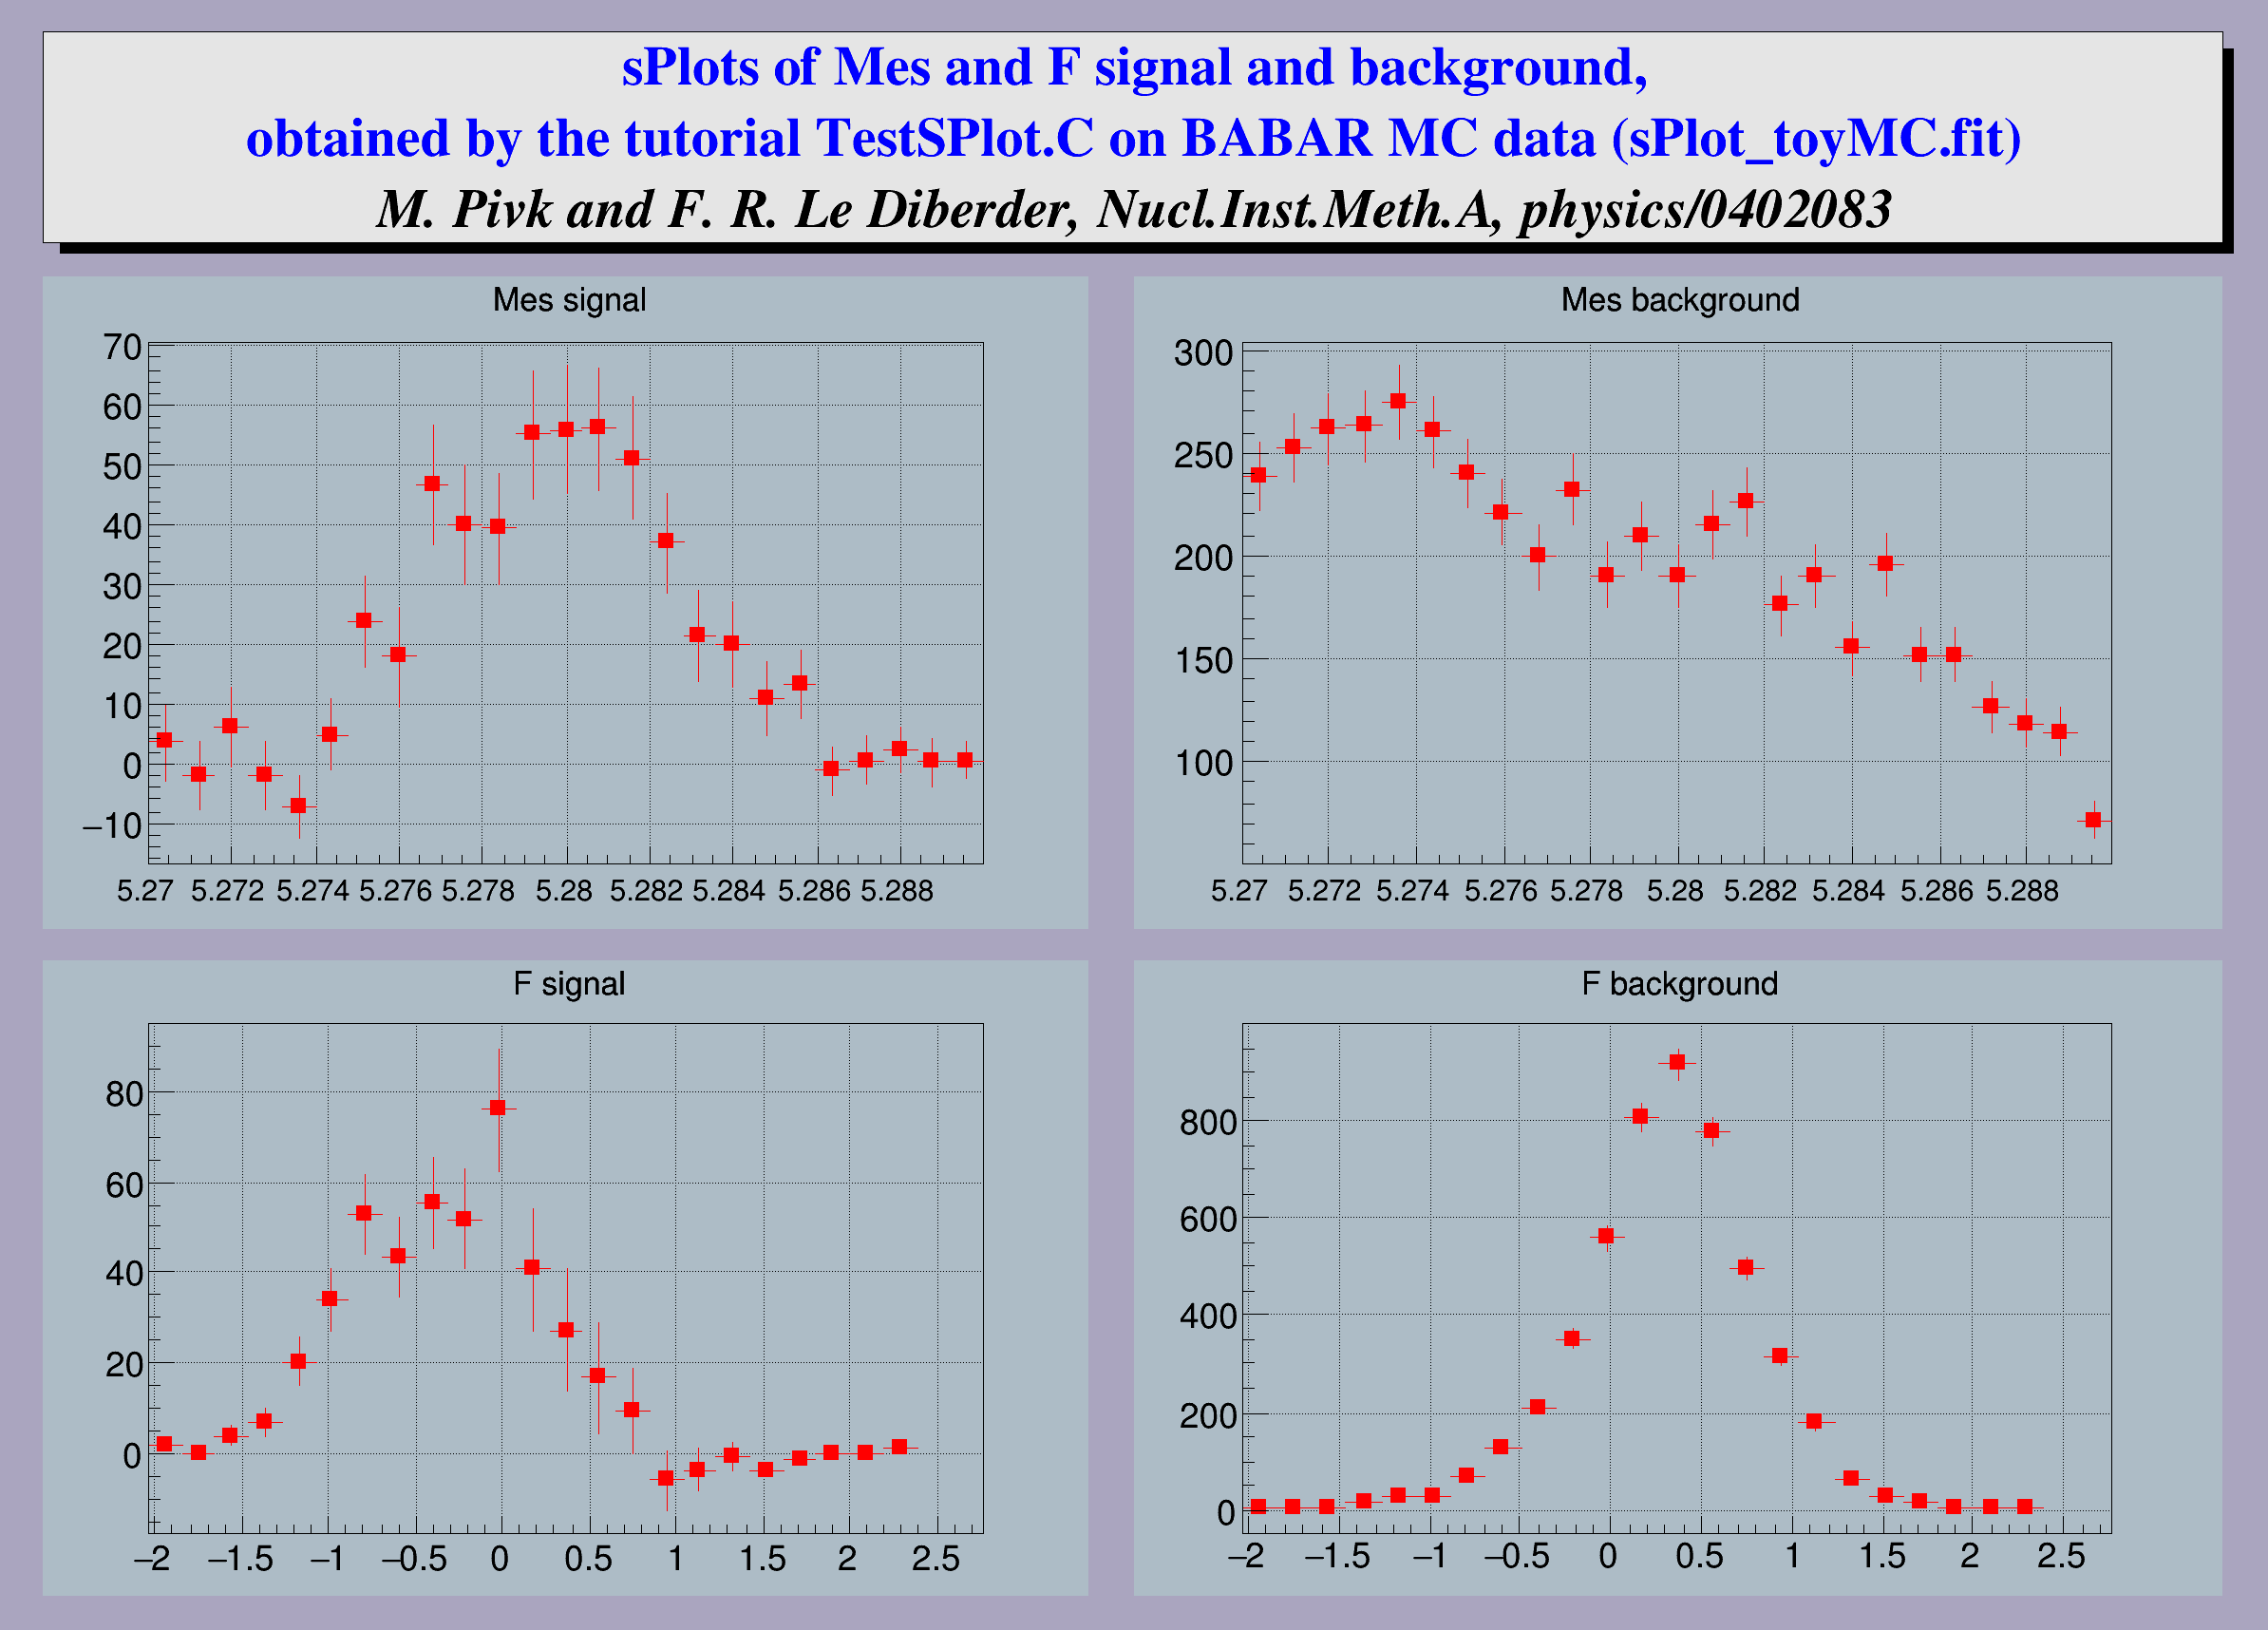
It is an example of analysis of charmless B decays, performed for BABAR. One is dealing with a data sample in which two species are present: the first is termed signal and the second background. A maximum Likelihood fit is performed to obtain the two yields N1 and N2 The fit relies on two discriminating variables collectively denoted y, which are chosen within three possible variables denoted Mes, dE and F. The variable which is not incorporated in y, is used as the control variable x. The distributions of discriminating variables and more details about the method can be found in the TSPlot class description

NOTE: This script requires a data file $ROOTSYS/tutorials/splot/TestSPlot_toyMC.dat.

View in nbviewer Open in SWAN

estimated #of events in species 0 = 462.641575
estimated #of events in species 1 = 4957.409256
estimated #of events in species 0 = 490.068958
estimated #of events in species 1 = 4929.942571
estimated #of events in species 0 = 431.484129
estimated #of events in species 1 = 4988.519463
estimated #of events in species 0 = 420.453703
estimated #of events in species 1 = 4999.547303
#include "TSPlot.h"
#include "TTree.h"
#include "TH1.h"
#include "TCanvas.h"
#include "TFile.h"
#include "TPaveLabel.h"
#include "TPad.h"
#include "TPaveText.h"
#include "Riostream.h"
void TestSPlot()
{
TString dir = gSystem->UnixPathName(__FILE__);
dir.ReplaceAll("TestSPlot.C","");
dir.ReplaceAll("/./","/");
TString dataFile = Form("%sTestSPlot_toyMC.dat",dir.Data());
//Read the data and initialize a TSPlot object
TTree *datatree = new TTree("datatree", "datatree");
datatree->ReadFile(dataFile,
"Mes/D:dE/D:F/D:MesSignal/D:MesBackground/D:dESignal/D:dEBackground/D:FSignal/D:FBackground/D",' ');
TSPlot *splot = new TSPlot(0, 3, 5420, 2, datatree);
//Set the selection for data tree
//Note the order of the variables:
//first the control variables (not presented in this example),
//then the 3 discriminating variables, then their probability distribution
//functions for the first species(signal) and then their pdfs for the
//second species(background)
"Mes:dE:F:MesSignal:dESignal:FSignal:MesBackground:"
"dEBackground:FBackground");
//Set the initial estimates of the number of events in each species
//- used as initial parameter values for the Minuit likelihood fit
Int_t ne[2];
ne[0]=500; ne[1]=5000;
//Compute the weights
splot->MakeSPlot();
//Fill the sPlots
splot->FillSWeightsHists(25);
//Now let's look at the sPlots
//The first two histograms are sPlots for the Mes variable signal and
//background. dE and F were chosen as discriminating variables to determine
//N1 and N2, through a maximum Likelihood fit, and thus the sPlots for the
//control variable Mes, unknown to the fit, was constructed.
//One can see that the sPlot for signal reproduces the PDF correctly,
//even when the latter vanishes.
//
//The lower two histograms are sPlots for the F variables signal and
//background. dE and Mes were chosen as discriminating variables to
//determine N1 and N2, through a maximum Likelihood fit, and thus the
//sPlots for the control variable F, unknown to the fit, was constructed.
TCanvas *myc = new TCanvas("myc",
"sPlots of Mes and F signal and background", 800, 600);
myc->SetFillColor(40);
TPaveText *pt = new TPaveText(0.02,0.85,0.98,0.98);
pt->AddText("sPlots of Mes and F signal and background,");
pt->AddText("obtained by the tutorial TestSPlot.C on BABAR MC "
"data (sPlot_toyMC.fit)");
"M. Pivk and F. R. Le Diberder, Nucl.Inst.Meth.A, physics/0402083");
t3->SetTextColor(1);
t3->SetTextFont(30);
pt->Draw();
TPad* pad1 = new TPad("pad1","Mes signal",0.02,0.43,0.48,0.83,33);
TPad* pad2 = new TPad("pad2","Mes background",0.5,0.43,0.98,0.83,33);
TPad* pad3 = new TPad("pad3", "F signal", 0.02, 0.02, 0.48, 0.41,33);
TPad* pad4 = new TPad("pad4", "F background", 0.5, 0.02, 0.98, 0.41,33);
pad1->Draw();
pad2->Draw();
pad3->Draw();
pad4->Draw();
pad1->cd();
pad1->SetGrid();
TH1D *sweight00 = splot->GetSWeightsHist(-1, 0, 0);
sweight00->SetTitle("Mes signal");
sweight00->SetStats(kFALSE);
sweight00->Draw("e");
sweight00->SetMarkerStyle(21);
sweight00->SetMarkerSize(0.7);
sweight00->SetMarkerColor(2);
sweight00->SetLineColor(2);
sweight00->GetXaxis()->SetLabelSize(0.05);
sweight00->GetYaxis()->SetLabelSize(0.06);
sweight00->GetXaxis()->SetLabelOffset(0.02);
pad2->cd();
pad2->SetGrid();
TH1D *sweight10 = splot->GetSWeightsHist(-1, 1, 0);
sweight10->SetTitle("Mes background");
sweight10->SetStats(kFALSE);
sweight10->Draw("e");
sweight10->SetMarkerStyle(21);
sweight10->SetMarkerSize(0.7);
sweight10->SetMarkerColor(2);
sweight10->SetLineColor(2);
sweight10->GetXaxis()->SetLabelSize(0.05);
sweight10->GetYaxis()->SetLabelSize(0.06);
sweight10->GetXaxis()->SetLabelOffset(0.02);
pad3->cd();
pad3->SetGrid();
TH1D *sweight02 = splot->GetSWeightsHist(-1, 0, 2);
sweight02->SetTitle("F signal");
sweight02->SetStats(kFALSE);
sweight02->Draw("e");
sweight02->SetMarkerStyle(21);
sweight02->SetMarkerSize(0.7);
sweight02->SetMarkerColor(2);
sweight02->SetLineColor(2);
sweight02->GetXaxis()->SetLabelSize(0.06);
sweight02->GetYaxis()->SetLabelSize(0.06);
sweight02->GetXaxis()->SetLabelOffset(0.01);
pad4->cd();
pad4->SetGrid();
TH1D *sweight12 = splot->GetSWeightsHist(-1, 1, 2);
sweight12->SetTitle("F background");
sweight12->SetStats(kFALSE);
sweight12->Draw("e");
sweight12->SetMarkerStyle(21);
sweight12->SetMarkerSize(0.7);
sweight12->SetMarkerColor(2);
sweight12->SetLineColor(2);
sweight12->GetXaxis()->SetLabelSize(0.06);
sweight12->GetYaxis()->SetLabelSize(0.06);
sweight02->GetXaxis()->SetLabelOffset(0.01);
myc->cd();
}
int Int_t
Definition RtypesCore.h:45
const Bool_t kFALSE
Definition RtypesCore.h:92
char * Form(const char *fmt,...)
R__EXTERN TSystem * gSystem
Definition TSystem.h:559
virtual void SetLabelSize(Float_t size=0.04)
Set size of axis labels.
Definition TAttAxis.cxx:203
virtual void SetLabelOffset(Float_t offset=0.005)
Set distance between the axis and the labels.
Definition TAttAxis.cxx:192
virtual void SetFillColor(Color_t fcolor)
Set the fill area color.
Definition TAttFill.h:37
virtual void SetLineColor(Color_t lcolor)
Set the line color.
Definition TAttLine.h:40
virtual void SetMarkerColor(Color_t mcolor=1)
Set the marker color.
Definition TAttMarker.h:38
virtual void SetMarkerStyle(Style_t mstyle=1)
Set the marker style.
Definition TAttMarker.h:40
virtual void SetMarkerSize(Size_t msize=1)
Set the marker size.
Definition TAttMarker.h:41
virtual void SetTextColor(Color_t tcolor=1)
Set the text color.
Definition TAttText.h:43
virtual void SetTextFont(Font_t tfont=62)
Set the text font.
Definition TAttText.h:45
The Canvas class.
Definition TCanvas.h:23
TVirtualPad * cd(Int_t subpadnumber=0) override
Set current canvas & pad.
Definition TCanvas.cxx:708
1-D histogram with a double per channel (see TH1 documentation)}
Definition TH1.h:618
virtual void SetTitle(const char *title)
See GetStatOverflows for more information.
Definition TH1.cxx:6678
TAxis * GetXaxis()
Get the behaviour adopted by the object about the statoverflows. See EStatOverflows for more informat...
Definition TH1.h:320
TAxis * GetYaxis()
Definition TH1.h:321
virtual void Draw(Option_t *option="")
Draw this histogram with options.
Definition TH1.cxx:3073
virtual void SetStats(Bool_t stats=kTRUE)
Set statistics option on/off.
Definition TH1.cxx:8830
The most important graphics class in the ROOT system.
Definition TPad.h:26
void SetGrid(Int_t valuex=1, Int_t valuey=1) override
Definition TPad.h:327
TVirtualPad * cd(Int_t subpadnumber=0) override
Set Current pad.
Definition TPad.cxx:603
void Draw(Option_t *option="") override
Draw Pad in Current pad (re-parent pad if necessary).
Definition TPad.cxx:1299
A Pave (see TPave) with text, lines or/and boxes inside.
Definition TPaveText.h:21
virtual TText * AddText(Double_t x1, Double_t y1, const char *label)
Add a new Text line to this pavetext at given coordinates.
virtual void Draw(Option_t *option="")
Draw this pavetext with its current attributes.
A common method used in High Energy Physics to perform measurements is the maximum Likelihood method,...
Definition TSPlot.h:21
void FillSWeightsHists(Int_t nbins=50)
The order of histograms in the array:
Definition TSPlot.cxx:698
TH1D * GetSWeightsHist(Int_t ixvar, Int_t ispecies, Int_t iyexcl=-1)
Returns the histogram of a variable, weighted with sWeights.
Definition TSPlot.cxx:832
void MakeSPlot(Option_t *option="v")
Calculates the sWeights.
Definition TSPlot.cxx:404
void SetTreeSelection(const char *varexp="", const char *selection="", Long64_t firstentry=0)
Specifies the variables from the tree to be used for splot.
Definition TSPlot.cxx:868
void SetInitialNumbersOfSpecies(Int_t *numbers)
Set the initial number of events of each species - used as initial estimates in minuit.
Definition TSPlot.cxx:388
Basic string class.
Definition TString.h:136
const char * Data() const
Definition TString.h:369
TString & ReplaceAll(const TString &s1, const TString &s2)
Definition TString.h:692
virtual const char * UnixPathName(const char *unixpathname)
Convert from a local pathname to a Unix pathname.
Definition TSystem.cxx:1061
Base class for several text objects.
Definition TText.h:22
A TTree represents a columnar dataset.
Definition TTree.h:79
virtual Long64_t ReadFile(const char *filename, const char *branchDescriptor="", char delimiter=' ')
Create or simply read branches from filename.
Definition TTree.cxx:7545
TPaveText * pt
Authors
Anna Kreshuk, Muriel Pivc

Definition in file TestSPlot.C.