Logo ROOT  
Reference Guide
 
All Classes Namespaces Files Functions Variables Typedefs Enumerations Enumerator Properties Friends Macros Modules Pages
Loading...
Searching...
No Matches
BreitWigner.C File Reference

Detailed Description

View in nbviewer Open in SWAN
Tutorial illustrating how to create a plot comparing a Breit Wigner to a Relativistic Breit Wigner

can be run with:

root[0] .x BreitWigner.C
#include "TMath.h"
#include <limits>
#include <string>
#include "TAxis.h"
#include "TGraph.h"
#include "TCanvas.h"
#include "TLatex.h"
#include "TLegend.h"
#include "TStyle.h" //For gStyle to remove stat box.
void plotTwoTGraphs(Double_t x[], Double_t y1[], Double_t y2[], const Int_t nPoints
, Double_t lowerXLimit, Double_t upperXLimit
, Double_t lowerYLimit, Double_t upperYLimit
, std::string legend1, std::string legend2
, std::string plotTitle1, std::string plotTitle2, std::string plotTitle3
, std::string pdfTitle){
///////////////////////////////////////////////////////
//Define variables for plot aesthetics and positioning
Double_t legendXPos = 0.63; Double_t legendYPos = 0.85;
Double_t legendXWidth = 0.29; Double_t legendYHeight = 0.1;
Double_t plotTitleXPos = 0.23; Double_t plotTitleYPos = 0.25;
Double_t fontSize = 0.04;
Double_t lineWidth = 2;
bool setLimitPlotLogScale = true;
std::string xAxisTitle = "E [GeV]"; std::string yAxisTitle = "Events";
Double_t xAxisTitleOffset = 1; Double_t yAxisTitleOffset = 1.3;
///////////////////////////////////////////////////////
// Initialize TGraphs
TGraph* gr1 = new TGraph(nPoints,x,y1);
TGraph* gr2 = new TGraph(nPoints,x,y2);
gr1->SetLineWidth(lineWidth);
gr2->SetLineWidth(lineWidth);
/////////////////////////////////////////////////////////
// Initialize canvas
TCanvas* c1 = new TCanvas("c1","transparent pad",200,10,600,600);
c1->SetLogy(setLimitPlotLogScale);
c1->SetTicks(1,1);
c1->SetRightMargin(0.02);
c1->SetTopMargin(0.02);
///////////////////////////////////////////////////////
//Make just a basic invisible TGraph just for the axes
const Double_t axis_x[2] = {lowerXLimit,upperXLimit};
const Double_t axis_y[2] = {lowerYLimit,upperYLimit};
TGraph* grAxis = new TGraph(2, axis_x, axis_y);
grAxis->SetTitle("");
grAxis->GetYaxis()->SetTitle(yAxisTitle.c_str());
grAxis->GetXaxis()->SetTitle(xAxisTitle.c_str());
grAxis->GetXaxis()->SetRangeUser(lowerXLimit,upperXLimit);
grAxis->GetYaxis()->SetRangeUser(lowerYLimit,upperYLimit);
grAxis->GetXaxis()->SetLabelSize(fontSize);
grAxis->GetYaxis()->SetLabelSize(fontSize);
grAxis->GetXaxis()->SetTitleSize(fontSize);
grAxis->GetYaxis()->SetTitleSize(fontSize);
grAxis->GetXaxis()->SetTitleOffset(xAxisTitleOffset);
grAxis->GetYaxis()->SetTitleOffset(yAxisTitleOffset);
grAxis->SetLineWidth(0);//So invisible
///////////////////////////////////////////////////////////
// Make legend and set aesthetics
auto legend = new TLegend(legendXPos,legendYPos,legendXPos+legendXWidth,legendYPos+legendYHeight);
legend->SetFillStyle(0);
legend->SetBorderSize(0);
legend->SetTextSize(fontSize);
legend->AddEntry(gr1,legend1.c_str(),"L");
legend->AddEntry(gr2,legend2.c_str(),"L");
/////////////////////////////////////////////////////////////
// Add plot title to plot. Make in three lines so not crowded.
// Shift each line down by shiftY
float shiftY{0.037};
TLatex* tex_Title = new TLatex(plotTitleXPos,plotTitleYPos-0*shiftY,plotTitle1.c_str());
tex_Title->SetNDC();
tex_Title->SetTextFont(42);
tex_Title->SetTextSize(fontSize);
tex_Title->SetLineWidth(lineWidth);
TLatex* tex_Title2 = new TLatex(plotTitleXPos,plotTitleYPos-1*shiftY,plotTitle2.c_str());
tex_Title2->SetNDC();
tex_Title2->SetTextFont(42);
tex_Title2->SetTextSize(fontSize);
tex_Title2->SetLineWidth(lineWidth);
TLatex* tex_Title3 = new TLatex(plotTitleXPos,plotTitleYPos-2*shiftY,plotTitle3.c_str());
tex_Title3->SetNDC();
tex_Title3->SetTextFont(42);
tex_Title3->SetTextSize(fontSize);
tex_Title3->SetLineWidth(lineWidth);
/////////////////////////////////////
// Draw everything
grAxis->Draw("AL");
gr1->Draw("L same");
gr2->Draw("L same");
legend->Draw();
tex_Title->Draw();
tex_Title2->Draw();
tex_Title3->Draw();
c1->RedrawAxis(); //Be sure to redraw axis AFTER plotting TGraphs otherwise TGraphs will be on top of tick marks and axis borders.
gPad->Print(pdfTitle.c_str());
}
void BreitWigner(){
/////////////////////////////////////////////////////////
// Define x axis limits and steps for each plotted point
const Int_t nPoints = 1000;
Double_t xMinimum = 0; Double_t xMaximum = 13000;
Double_t xStepSize = (xMaximum-xMinimum)/nPoints;
///////////////////////////////////////////////////////
// Define arrays of (x,y) points.
Double_t x[nPoints];
Double_t y_nonRelBW[nPoints], y_relBW[nPoints];
//////////////////////////////////
// Define Breit-Wigner parameters
Double_t width = 1350;
Double_t sigma = 269.7899;
Double_t median = 9000;
///////////////////////////////////////////////////
// Loop over x axis range, filling in (x,y) points,
// and finding y minimums and maximums for axis limit.
Double_t yMinimum = std::numeric_limits<Double_t>::max();
Double_t yMaximum = TMath::BreitWignerRelativistic(median,median,width); //y maximum is at x=median (and non relativistic = relativistic at median so choice of function does not matter).
for (Int_t i=0;i<nPoints;i++) {
Double_t currentX = xMinimum+i*xStepSize;
x[i] = currentX;
y_nonRelBW[i] = TMath::BreitWigner(currentX,median,width);
y_relBW[i] = TMath::BreitWignerRelativistic(currentX,median,width);
if (y_nonRelBW[i]<yMinimum){yMinimum = y_nonRelBW[i];}
if (y_relBW[i]<yMinimum){yMinimum = y_relBW[i];}
}
plotTwoTGraphs(x, y_nonRelBW, y_relBW, nPoints
, xMinimum, xMaximum //xAxis limits
, yMinimum/4, yMaximum*4 //yAxis limits, expand for aesthetics.
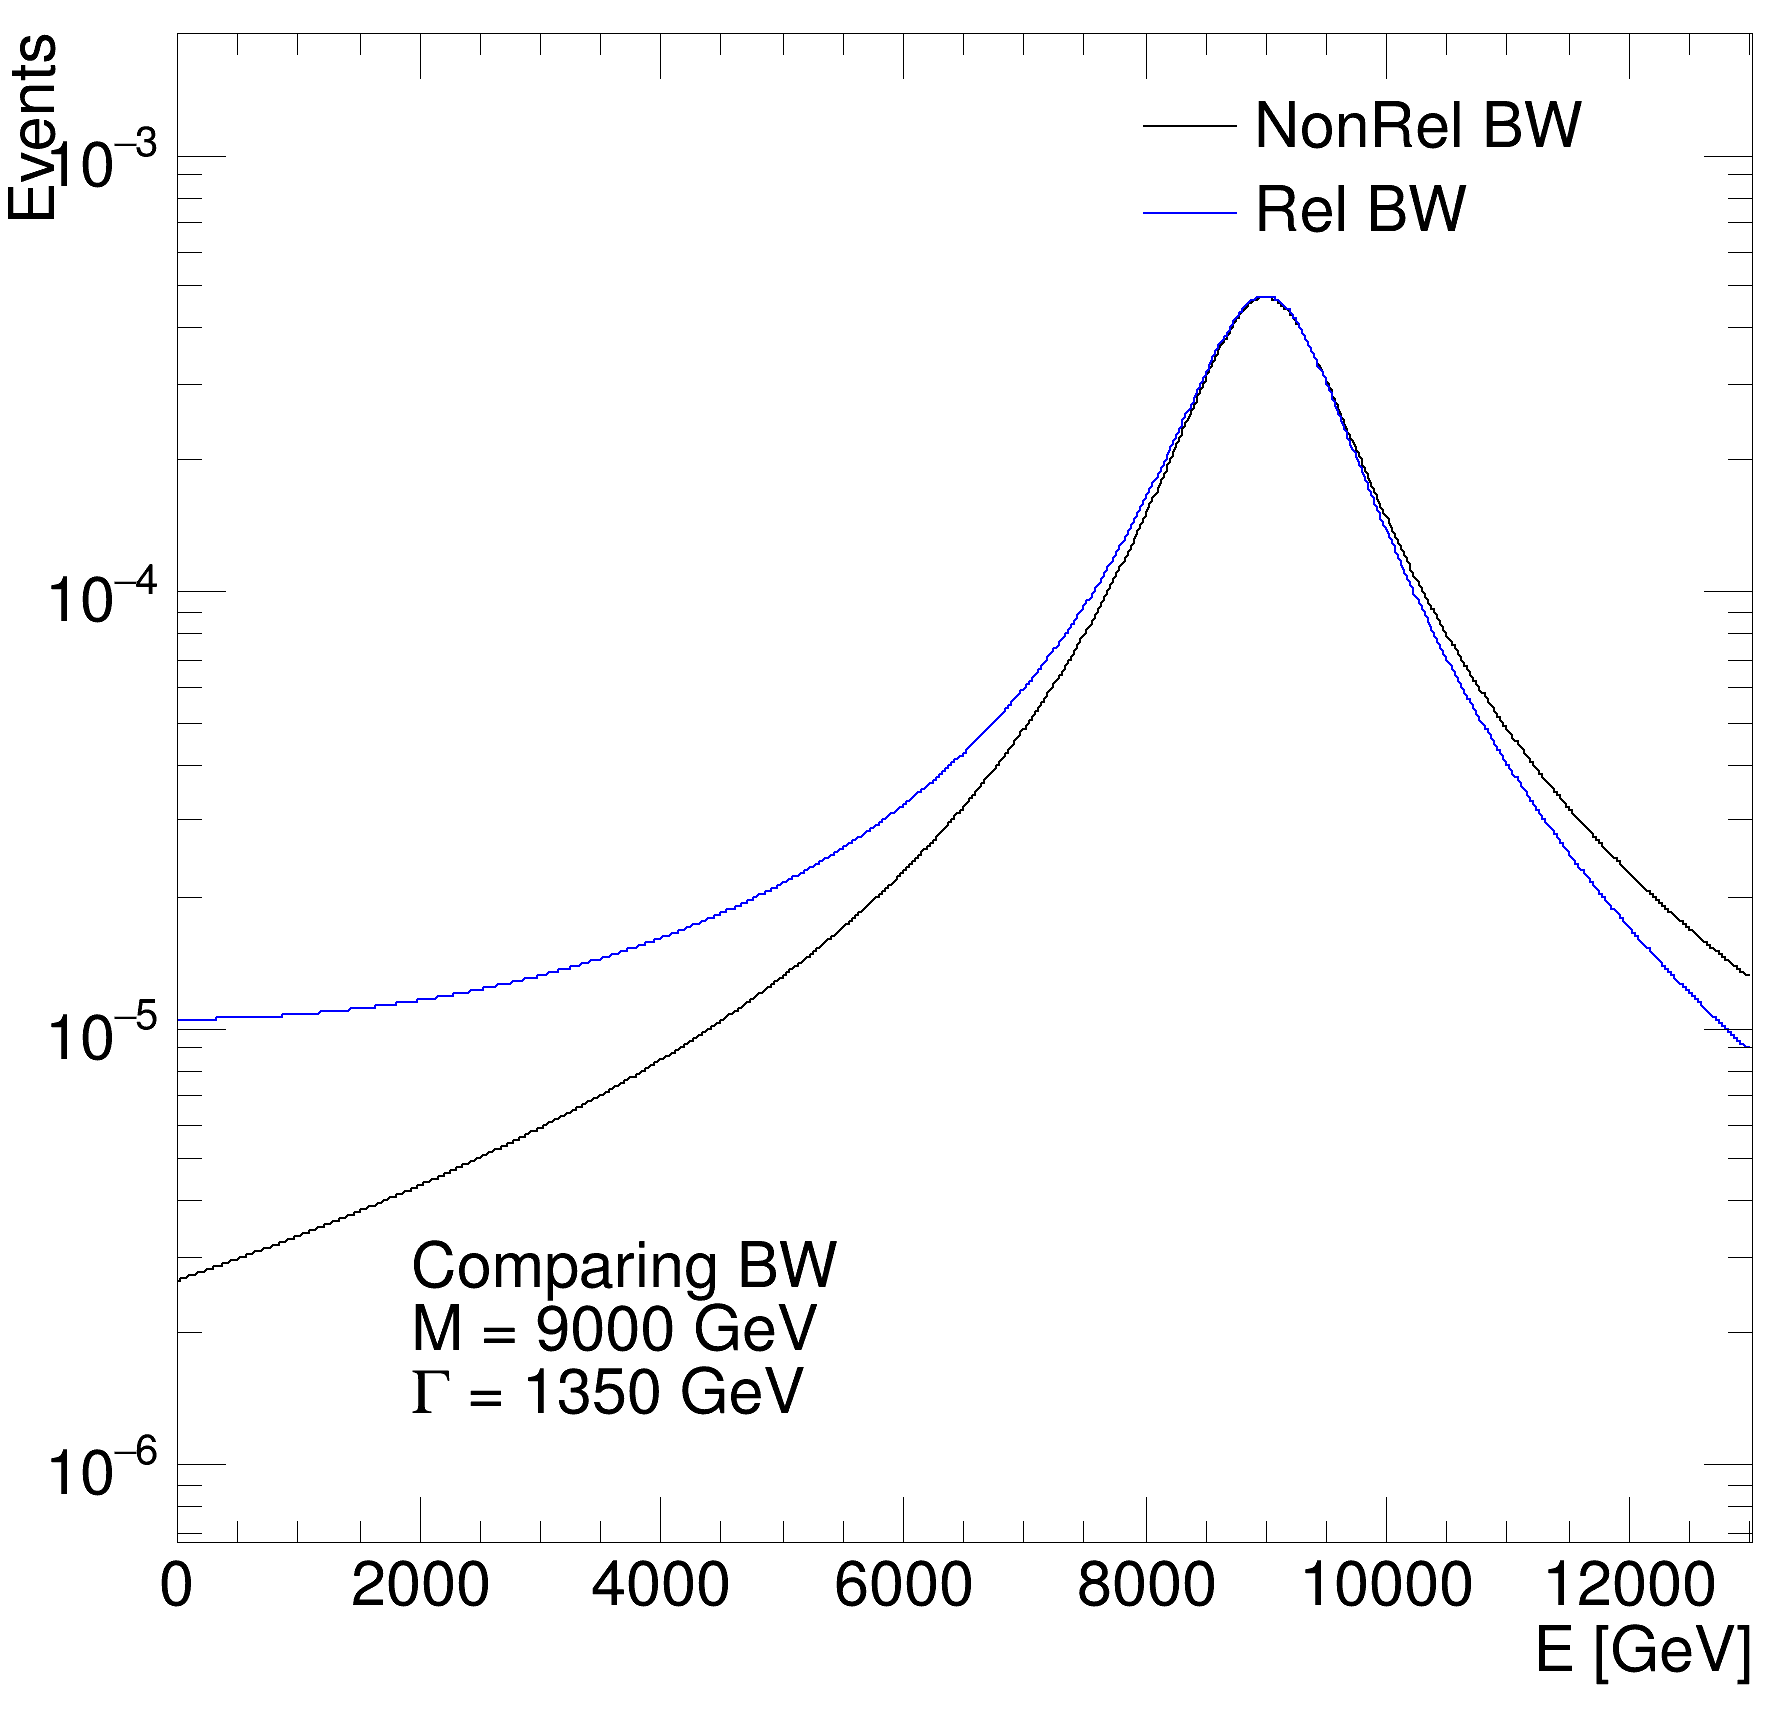
,"NonRel BW", "Rel BW" //Legend entries
, "Comparing BW", "M = " + std::to_string(int(round(median))) + " GeV", "#Gamma = " + std::to_string(int(round(width))) + " GeV" //Plot Title entry (three lines)
, "BW_M"+std::to_string(int(round(median)))+"_Gamma" + std::to_string(int(round(width))) +".pdf)" //PDF file title.
);
}
int Int_t
Definition RtypesCore.h:45
double Double_t
Definition RtypesCore.h:59
@ kBlack
Definition Rtypes.h:65
@ kBlue
Definition Rtypes.h:66
Option_t Option_t TPoint TPoint const char y2
Option_t Option_t width
Option_t Option_t TPoint TPoint const char y1
R__EXTERN TStyle * gStyle
Definition TStyle.h:414
#define gPad
virtual void SetTitleOffset(Float_t offset=1)
Set distance between the axis and the axis title.
Definition TAttAxis.cxx:298
virtual void SetLabelSize(Float_t size=0.04)
Set size of axis labels.
Definition TAttAxis.cxx:203
virtual void SetTitleSize(Float_t size=0.04)
Set size of axis title.
Definition TAttAxis.cxx:309
virtual void SetLineWidth(Width_t lwidth)
Set the line width.
Definition TAttLine.h:43
virtual void SetLineColor(Color_t lcolor)
Set the line color.
Definition TAttLine.h:40
virtual void SetTextFont(Font_t tfont=62)
Set the text font.
Definition TAttText.h:46
virtual void SetTextSize(Float_t tsize=1)
Set the text size.
Definition TAttText.h:47
virtual void SetRangeUser(Double_t ufirst, Double_t ulast)
Set the viewing range for the axis from ufirst to ulast (in user coordinates, that is,...
Definition TAxis.cxx:978
The Canvas class.
Definition TCanvas.h:23
A TGraph is an object made of two arrays X and Y with npoints each.
Definition TGraph.h:41
void Draw(Option_t *chopt="") override
Draw this graph with its current attributes.
Definition TGraph.cxx:808
TAxis * GetXaxis() const
Get x axis of the graph.
Definition TGraph.cxx:1550
TAxis * GetYaxis() const
Get y axis of the graph.
Definition TGraph.cxx:1559
void SetTitle(const char *title="") override
Change (i.e.
Definition TGraph.cxx:2380
To draw Mathematical Formula.
Definition TLatex.h:18
This class displays a legend box (TPaveText) containing several legend entries.
Definition TLegend.h:23
virtual void SetTitle(const char *title="")
Set the title of the TNamed.
Definition TNamed.cxx:164
virtual void Draw(Option_t *option="")
Default Draw method for all objects.
Definition TObject.cxx:274
void SetOptStat(Int_t stat=1)
The type of information printed in the histogram statistics box can be selected via the parameter mod...
Definition TStyle.cxx:1589
virtual void SetNDC(Bool_t isNDC=kTRUE)
Set NDC mode on if isNDC = kTRUE, off otherwise.
Definition TText.cxx:815
RVec< PromoteType< T > > round(const RVec< T > &v)
Definition RVec.hxx:1817
const Double_t sigma
return c1
Definition legend1.C:41
Double_t x[n]
Definition legend1.C:17
Double_t BreitWigner(Double_t x, Double_t mean=0, Double_t gamma=1)
Calculates a Breit Wigner function with mean and gamma.
Definition TMath.cxx:442
Double_t BreitWignerRelativistic(Double_t x, Double_t median=0, Double_t gamma=1)
Calculates a Relativistic Breit Wigner function with median and gamma.
Definition TMath.cxx:452
Author
Jack Lindon

Definition in file BreitWigner.C.