Logo ROOT  
Reference Guide
 
All Classes Namespaces Files Functions Variables Typedefs Enumerations Enumerator Properties Friends Macros Modules Pages
Loading...
Searching...
No Matches
BreitWigner.C File Reference

Detailed Description

View in nbviewer Open in SWAN
Tutorial illustrating how to create a plot comparing a Breit Wigner to a Relativistic Breit Wigner

can be run with:

root[0] .x BreitWigner.C
#include "TMath.h"
#include <limits>
#include <string>
#include "TAxis.h"
#include "TGraph.h"
#include "TCanvas.h"
#include "TLatex.h"
#include "TLegend.h"
#include "TStyle.h" //For gStyle to remove stat box.
, std::string legend1, std::string legend2
, std::string plotTitle1, std::string plotTitle2, std::string plotTitle3
, std::string pdfTitle){
///////////////////////////////////////////////////////
//Define variables for plot aesthetics and positioning
bool setLimitPlotLogScale = true;
std::string xAxisTitle = "E [GeV]"; std::string yAxisTitle = "Events";
///////////////////////////////////////////////////////
// Initialize TGraphs
gr1->SetLineWidth(lineWidth);
gr2->SetLineWidth(lineWidth);
gr1->SetLineColor(kBlack);
gr2->SetLineColor(kBlue);
/////////////////////////////////////////////////////////
// Initialize canvas
TCanvas* c1 = new TCanvas("c1","transparent pad",200,10,600,600);
c1->SetTicks(1,1);
c1->SetRightMargin(0.02);
c1->SetTopMargin(0.02);
///////////////////////////////////////////////////////
//Make just a basic invisible TGraph just for the axes
grAxis->SetTitle("");
grAxis->GetYaxis()->SetTitle(yAxisTitle.c_str());
grAxis->GetXaxis()->SetTitle(xAxisTitle.c_str());
grAxis->GetXaxis()->SetRangeUser(lowerXLimit,upperXLimit);
grAxis->GetYaxis()->SetRangeUser(lowerYLimit,upperYLimit);
grAxis->GetXaxis()->SetLabelSize(fontSize);
grAxis->GetYaxis()->SetLabelSize(fontSize);
grAxis->GetXaxis()->SetTitleSize(fontSize);
grAxis->GetYaxis()->SetTitleSize(fontSize);
grAxis->GetXaxis()->SetTitleOffset(xAxisTitleOffset);
grAxis->GetYaxis()->SetTitleOffset(yAxisTitleOffset);
grAxis->SetLineWidth(0);//So invisible
///////////////////////////////////////////////////////////
// Make legend and set aesthetics
legend->SetFillStyle(0);
legend->SetBorderSize(0);
legend->SetTextSize(fontSize);
legend->AddEntry(gr1,legend1.c_str(),"L");
legend->AddEntry(gr2,legend2.c_str(),"L");
/////////////////////////////////////////////////////////////
// Add plot title to plot. Make in three lines so not crowded.
// Shift each line down by shiftY
float shiftY{0.037};
tex_Title->SetNDC();
tex_Title->SetTextFont(42);
tex_Title->SetTextSize(fontSize);
tex_Title->SetLineWidth(lineWidth);
tex_Title2->SetNDC();
tex_Title2->SetTextFont(42);
tex_Title2->SetTextSize(fontSize);
tex_Title2->SetLineWidth(lineWidth);
tex_Title3->SetNDC();
tex_Title3->SetTextFont(42);
tex_Title3->SetTextSize(fontSize);
tex_Title3->SetLineWidth(lineWidth);
/////////////////////////////////////
// Draw everything
grAxis->Draw("AL");
gr1->Draw("L same");
gr2->Draw("L same");
legend->Draw();
tex_Title->Draw();
tex_Title2->Draw();
tex_Title3->Draw();
c1->RedrawAxis(); //Be sure to redraw axis AFTER plotting TGraphs otherwise TGraphs will be on top of tick marks and axis borders.
gPad->Print(pdfTitle.c_str());
}
void BreitWigner(){
/////////////////////////////////////////////////////////
// Define x axis limits and steps for each plotted point
const Int_t nPoints = 1000;
///////////////////////////////////////////////////////
// Define arrays of (x,y) points.
//////////////////////////////////
// Define Breit-Wigner parameters
Double_t width = 1350;
Double_t sigma = 269.7899;
Double_t median = 9000;
///////////////////////////////////////////////////
// Loop over x axis range, filling in (x,y) points,
// and finding y minimums and maximums for axis limit.
Double_t yMinimum = std::numeric_limits<Double_t>::max();
Double_t yMaximum = TMath::BreitWignerRelativistic(median,median,width); //y maximum is at x=median (and non relativistic = relativistic at median so choice of function does not matter).
for (Int_t i=0;i<nPoints;i++) {
x[i] = currentX;
}
, xMinimum, xMaximum //xAxis limits
, yMinimum/4, yMaximum*4 //yAxis limits, expand for aesthetics.
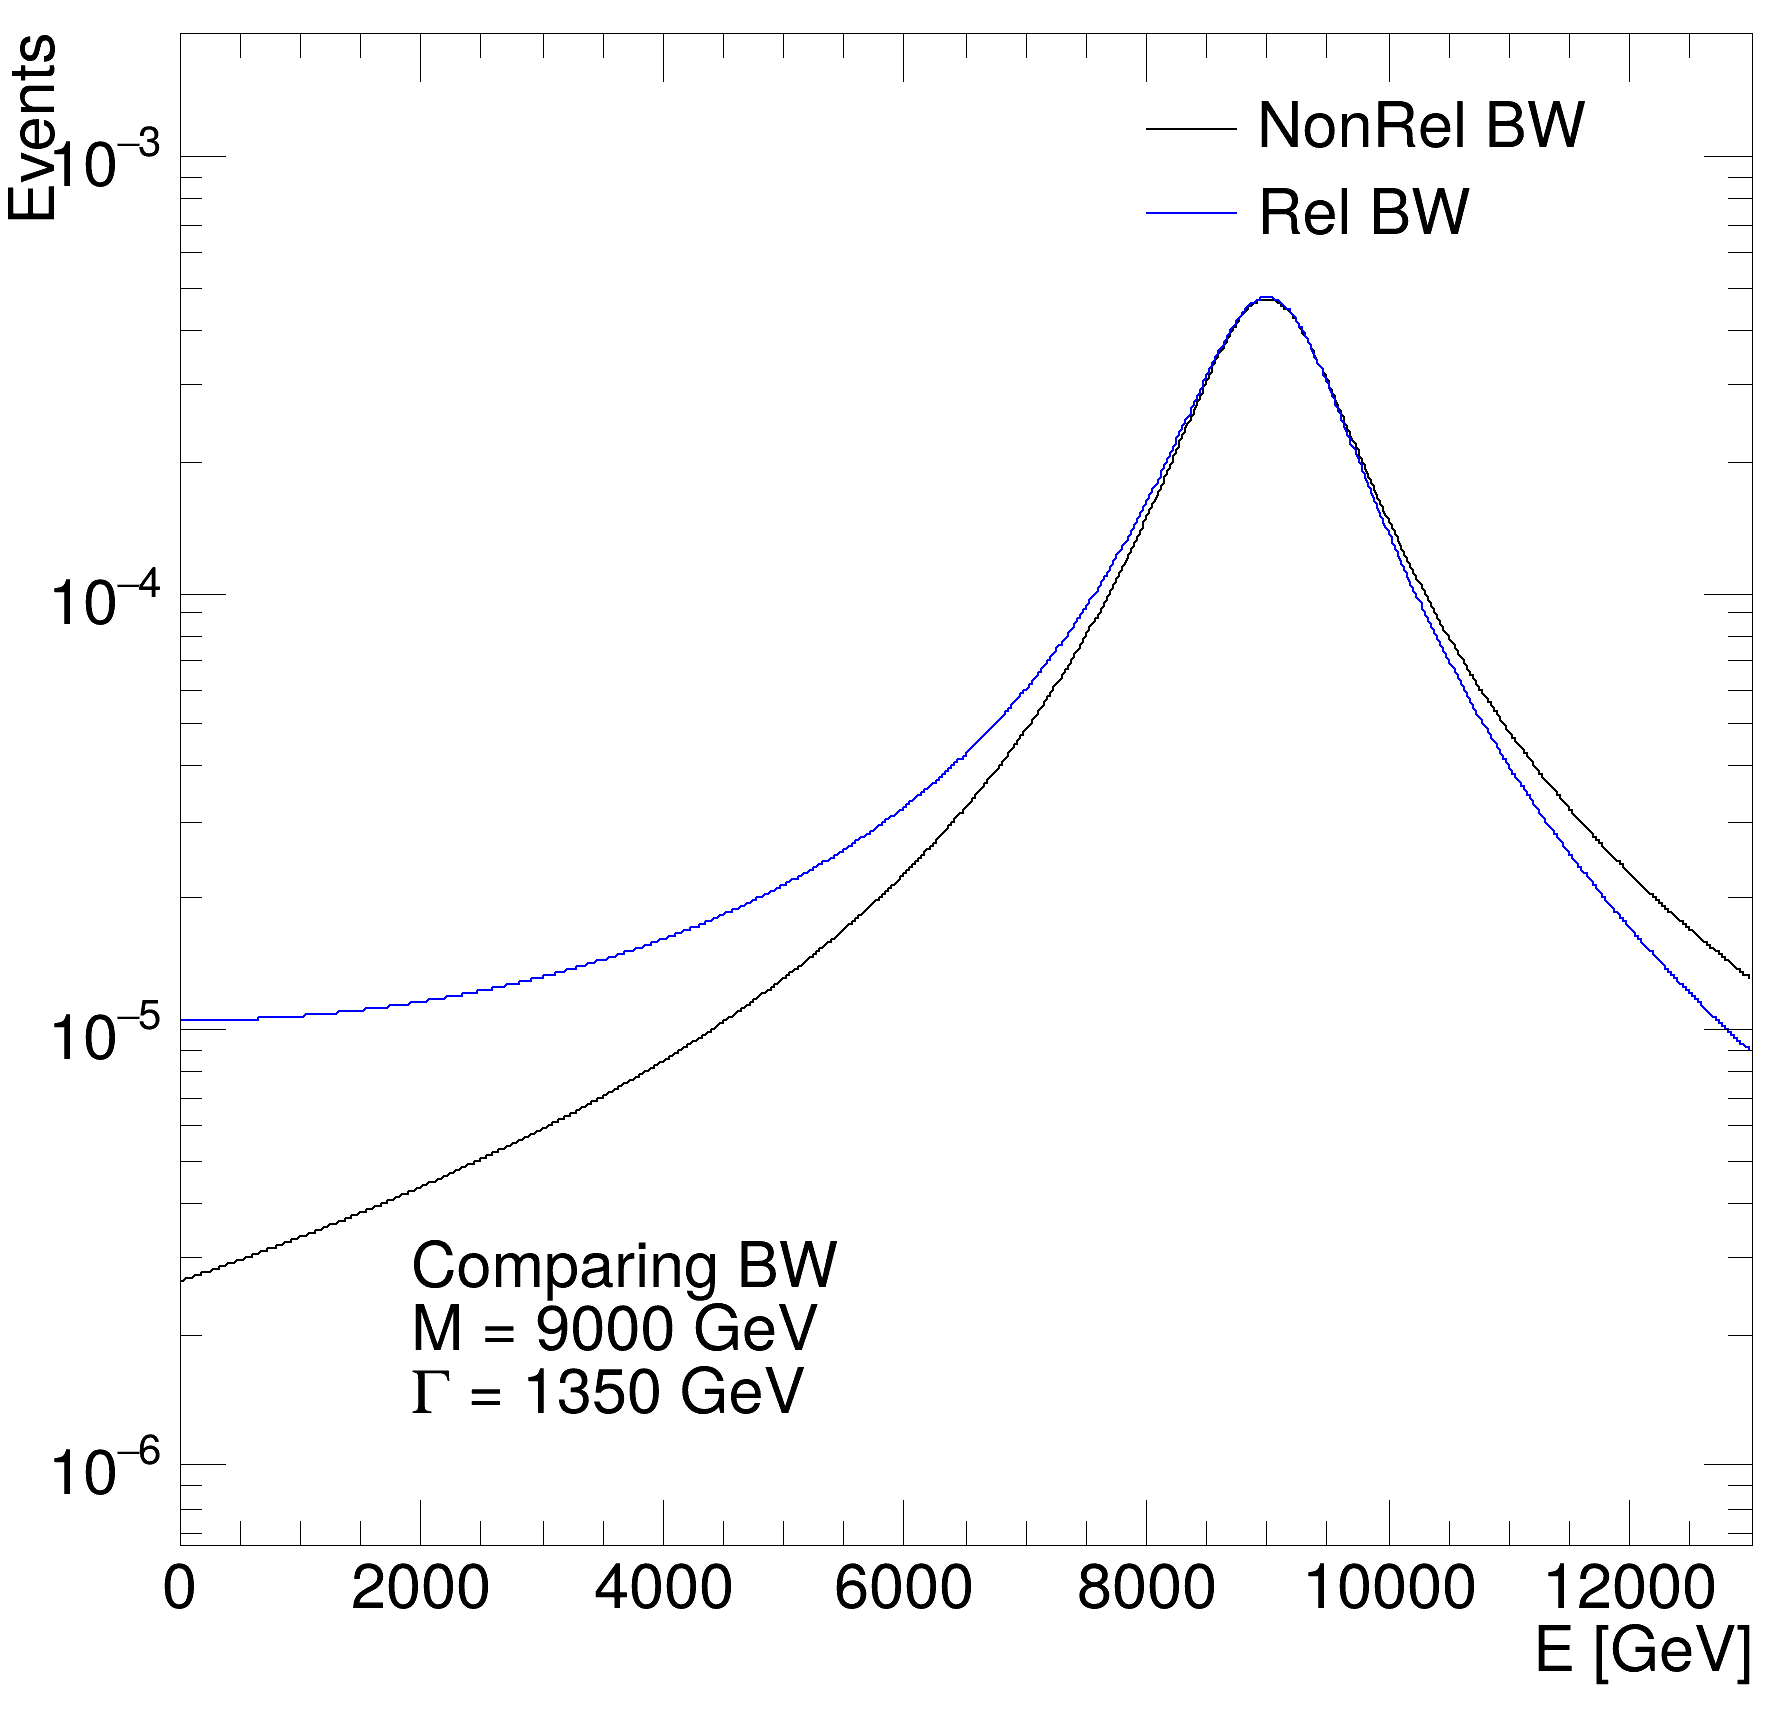
,"NonRel BW", "Rel BW" //Legend entries
, "Comparing BW", "M = " + std::to_string(int(round(median))) + " GeV", "#Gamma = " + std::to_string(int(round(width))) + " GeV" //Plot Title entry (three lines)
, "BW_M"+std::to_string(int(round(median)))+"_Gamma" + std::to_string(int(round(width))) +".pdf)" //PDF file title.
);
}
int Int_t
Definition RtypesCore.h:45
double Double_t
Definition RtypesCore.h:59
@ kBlack
Definition Rtypes.h:65
@ kBlue
Definition Rtypes.h:66
ROOT::Detail::TRangeCast< T, true > TRangeDynCast
TRangeDynCast is an adapter class that allows the typed iteration through a TCollection.
Option_t Option_t TPoint TPoint const char y2
Option_t Option_t width
Option_t Option_t TPoint TPoint const char y1
R__EXTERN TStyle * gStyle
Definition TStyle.h:436
#define gPad
The Canvas class.
Definition TCanvas.h:23
A TGraph is an object made of two arrays X and Y with npoints each.
Definition TGraph.h:41
To draw Mathematical Formula.
Definition TLatex.h:18
This class displays a legend box (TPaveText) containing several legend entries.
Definition TLegend.h:23
void SetOptStat(Int_t stat=1)
The type of information printed in the histogram statistics box can be selected via the parameter mod...
Definition TStyle.cxx:1640
RVec< PromoteType< T > > round(const RVec< T > &v)
Definition RVec.hxx:1869
const Double_t sigma
return c1
Definition legend1.C:41
Double_t x[n]
Definition legend1.C:17
Double_t BreitWigner(Double_t x, Double_t mean=0, Double_t gamma=1)
Calculates a Breit Wigner function with mean and gamma.
Definition TMath.cxx:442
Double_t BreitWignerRelativistic(Double_t x, Double_t median=0, Double_t gamma=1)
Calculates a Relativistic Breit Wigner function with median and gamma.
Definition TMath.cxx:452
Author
Jack Lindon

Definition in file BreitWigner.C.