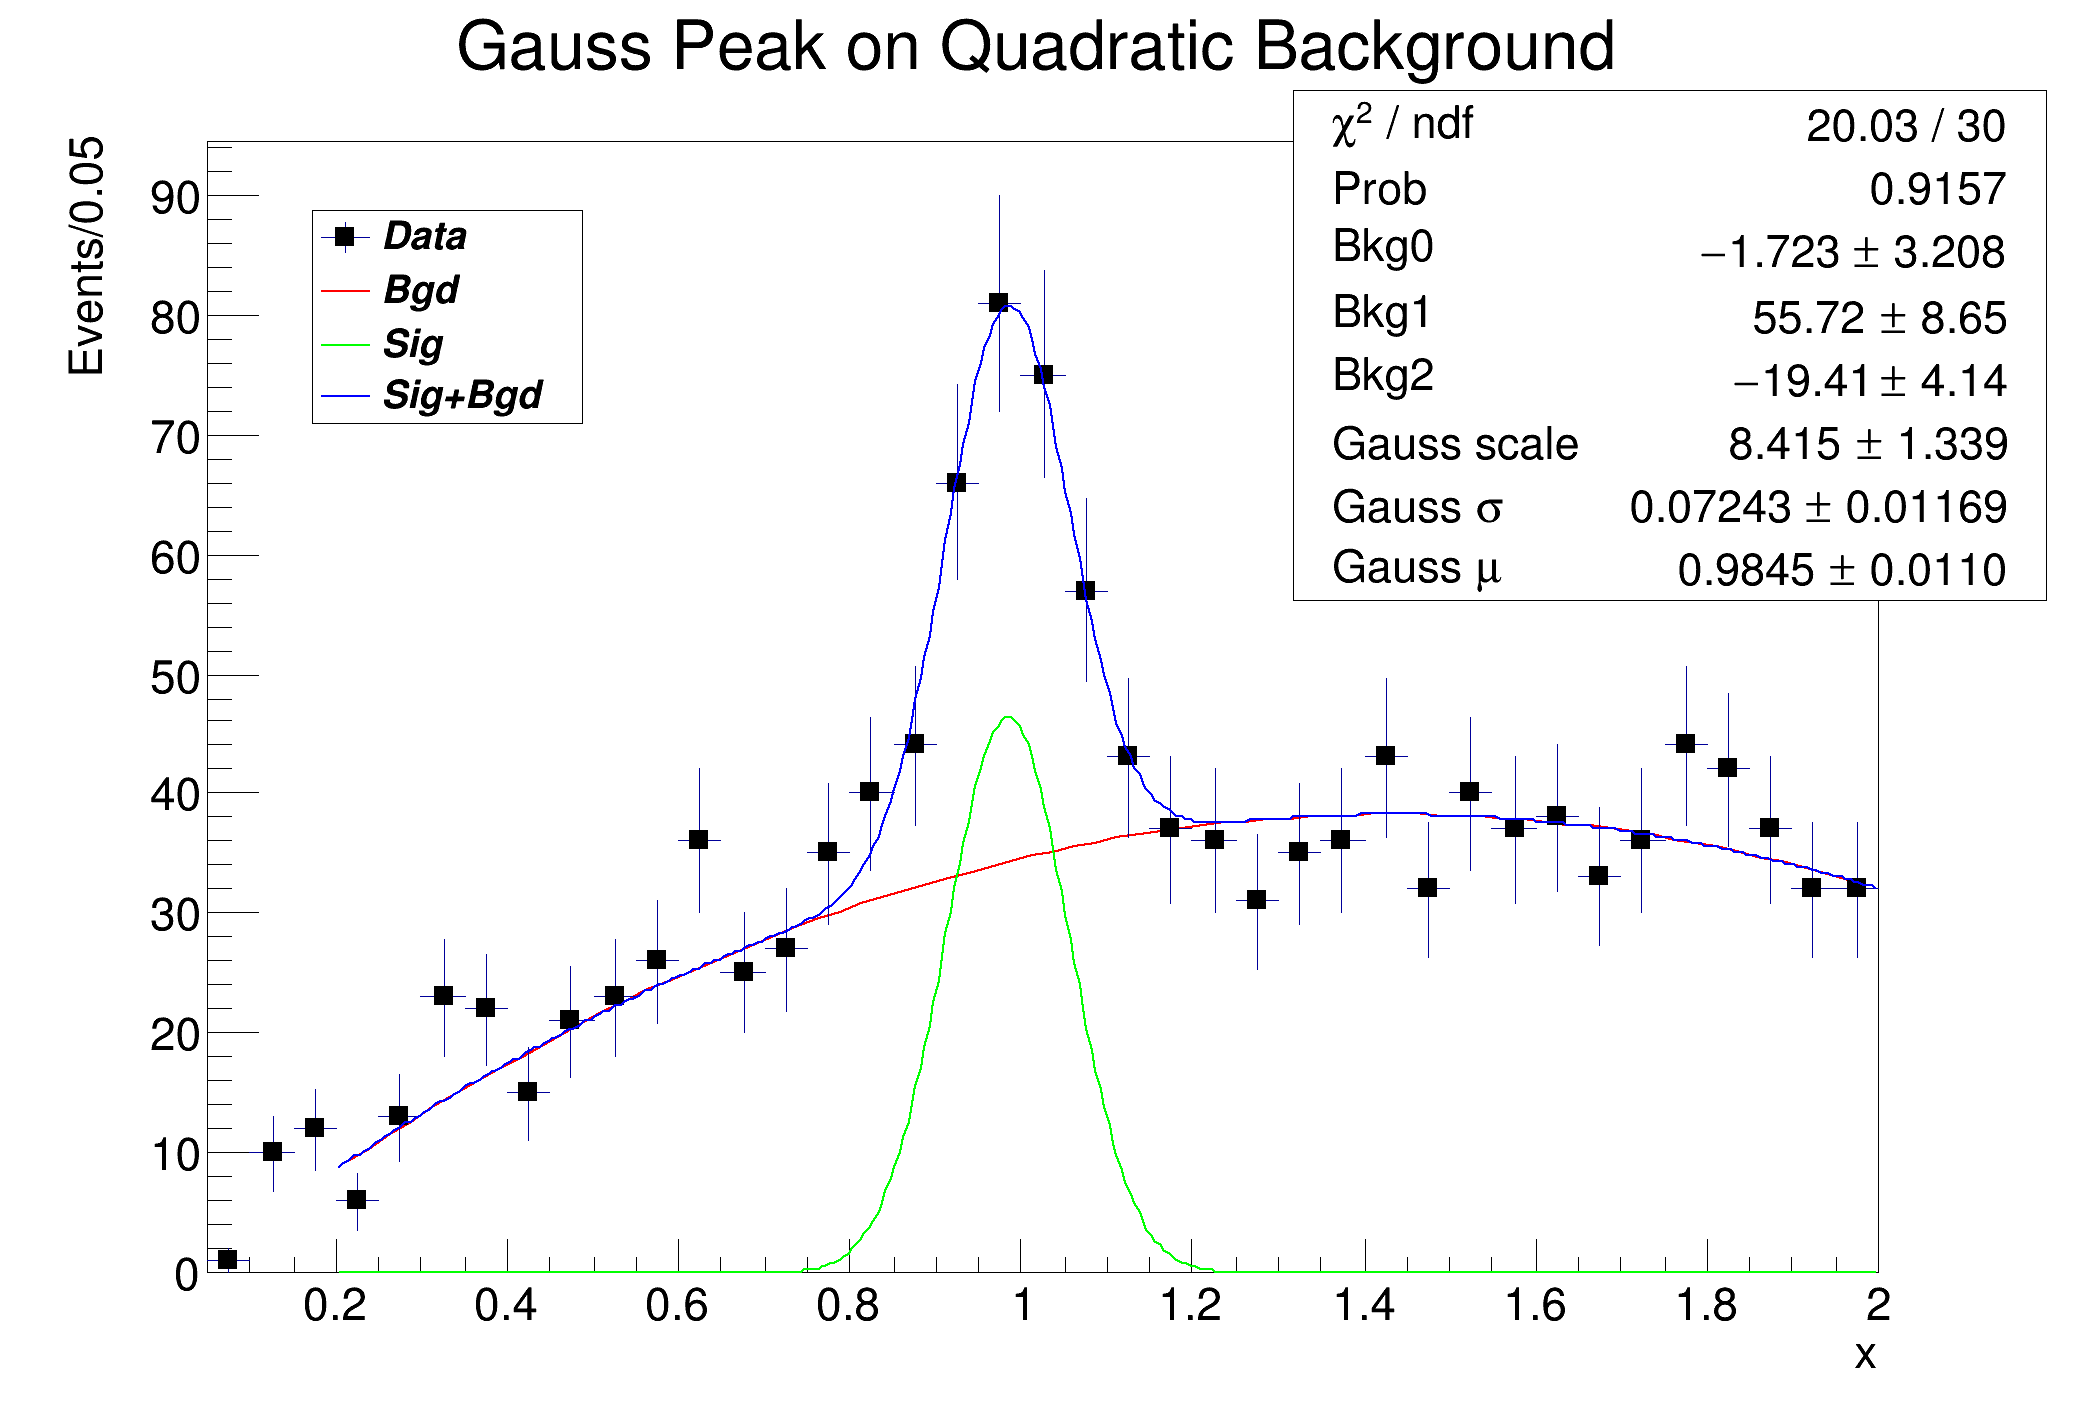
Example for fitting a signal + background model to a histogram found in a file.
enum ParIndex_t {
Bkg0=0, Bkg1=1, Bkg2,
SigScale, SigSigma, SigMean,
N_PAR};
const std::map<ParIndex_t,std::string> parNames{
{Bkg0, "Bkg0"}, {Bkg1, "Bkg1"}, {Bkg2, "Bkg2"},
{SigScale, "Gauss scale"}, {SigSigma, "Gauss #sigma"}, {SigMean, "Gauss #mu"}
};
double background(
double *
x,
double *par) {
return par[Bkg0] + par[Bkg1]*
x[0] + par[Bkg2]*
x[0]*
x[0];
}
double signal(
double *
x,
double *par) {
return par[SigScale]*
TMath::Gaus(
x[0], par[SigMean], par[SigSigma],
true);
}
double fitFunction(
double *
x,
double *par) {
return background(
x, par) + signal(
x, par);
}
TF1 fitFcn(
"fitFcn",fitFunction,fitxmin,fitxmax,N_PAR);
fitFcn.SetNpx(500);
fitFcn.SetLineWidth(2);
fitFcn.SetLineColor(
kBlue);
for (auto& idx_name : parNames) {
fitFcn.SetParName(idx_name.first, idx_name.second.c_str());
}
fitFcn.SetParameters(30,0,0,50.,0.1,1.);
histo->
Fit(
"fitFcn",
"VR+",
"ep");
TF1 backFcn(
"backFcn",background,fitxmin,fitxmax,N_PAR);
backFcn.SetLineColor(
kRed);
TF1 signalFcn(
"signalFcn",signal,fitxmin,fitxmax,N_PAR);
signalFcn.SetLineColor(
kBlue);
signalFcn.SetNpx(500);
double par[N_PAR];
fitFcn.GetParameters(par);
backFcn.SetParameters(par);
backFcn.DrawCopy("same");
signalFcn.SetParameters(par);
signalFcn.SetLineColor(
kGreen);
signalFcn.DrawCopy("same");
const double integral = signalFcn.Integral(0.,3.);
std::cout << "number of signal events = " << integral/binwidth << " " << binwidth<< std::endl;
TLegend legend(0.15,0.7,0.28,0.85);
legend.SetTextFont(72);
legend.SetTextSize(0.03);
legend.AddEntry(histo,"Data","lpe");
legend.AddEntry(&backFcn,"Bgd","l");
legend.AddEntry(&signalFcn,"Sig","l");
legend.AddEntry(&fitFcn,"Sig+Bgd","l");
legend.DrawClone();
}
void CreateRootFile(){
const int nBins = 60;
double data[nBins] = { 6, 1,10,12, 6,13,23,22,15,21,
23,26,36,25,27,35,40,44,66,81,
75,57,43,37,36,31,35,36,43,32,
40,37,38,33,36,44,42,37,32,32,
43,44,35,33,33,39,29,41,32,44,
26,39,29,35,32,21,21,15,25,15};
TFile*
f =
new TFile(
"exampleRootFile.root",
"RECREATE");
TH1D *histo =
new TH1D(
"histo",
"Gauss Peak on Quadratic Background;x;Events/0.05",60,0,3);
}
void FitHistoInFile() {
float fitxmin=0.2;
float fitxmax=2.7;
TCanvas *
c1 =
new TCanvas(
"c1",
"Fitting Demo of Histogram in File",10,10,700,500);
CreateRootFile();
f->GetObject(
"histo",histo);
if (!histo){
std::cout << "histo not found" << std::endl;
return;
}
FitRoutine(
c1,histo, fitxmin, fitxmax,
"FitHistoInFile.pdf");
}
Option_t Option_t TPoint TPoint const char GetTextMagnitude GetFillStyle GetLineColor GetLineWidth GetMarkerStyle GetTextAlign GetTextColor GetTextSize void data
Option_t Option_t TPoint TPoint const char GetTextMagnitude GetFillStyle GetLineColor GetLineWidth GetMarkerStyle GetTextAlign GetTextColor GetTextSize void char Point_t Rectangle_t WindowAttributes_t Float_t Float_t Float_t Int_t Int_t UInt_t UInt_t Rectangle_t Int_t Int_t Window_t TString Int_t GCValues_t GetPrimarySelectionOwner GetDisplay GetScreen GetColormap GetNativeEvent const char const char dpyName wid window const char font_name cursor keysym reg const char only_if_exist regb h Point_t winding char text const char depth char const char Int_t count const char ColorStruct_t color const char filename
R__EXTERN TStyle * gStyle
virtual void SetMarkerStyle(Style_t mstyle=1)
Set the marker style.
virtual void SetMarkerSize(Size_t msize=1)
Set the marker size.
virtual void SetRange(Int_t first=0, Int_t last=0)
Set the viewing range for the axis using bin numbers.
virtual Double_t GetBinWidth(Int_t bin) const
Return bin width.
A ROOT file is composed of a header, followed by consecutive data records (TKey instances) with a wel...
1-D histogram with a double per channel (see TH1 documentation)}
TH1 is the base class of all histogram classes in ROOT.
virtual TFitResultPtr Fit(const char *formula, Option_t *option="", Option_t *goption="", Double_t xmin=0, Double_t xmax=0)
Fit histogram with function fname.
void Draw(Option_t *option="") override
Draw this histogram with options.
virtual void SetBinContent(Int_t bin, Double_t content)
Set bin content see convention for numbering bins in TH1::GetBin In case the bin number is greater th...
This class displays a legend box (TPaveText) containing several legend entries.
void SetOptStat(Int_t stat=1)
The type of information printed in the histogram statistics box can be selected via the parameter mod...
void SetOptFit(Int_t fit=1)
The type of information about fit parameters printed in the histogram statistics box can be selected ...
Double_t Gaus(Double_t x, Double_t mean=0, Double_t sigma=1, Bool_t norm=kFALSE)
Calculates a gaussian function with mean and sigma.
Minuit2Minimizer: Minimize with max-calls 1780 convergence for edm < 0.01 strategy 1
Number of iterations 17
----------> Iteration 0
FVAL = 1529.09554298 Edm = 1995.56841581 Nfcn = 25
Error matrix change = 1
Parameters : p0 = 30 p1 = 0 p2 = 0 p3 = 50 p4 = 0.1 p5 = 1
----------> Iteration 1
FVAL = 417.624308317 Edm = 480.13293748 Nfcn = 41
Error matrix change = 0.640972
Parameters : p0 = 21.0028 p1 = -4.96702 p2 = -1.39455 p3 = 27.1085 p4 = 0.12243 p5 = 0.995333
----------> Iteration 2
FVAL = 88.8885076595 Edm = 16.2936179231 Nfcn = 59
Error matrix change = 0.367602
Parameters : p0 = 22.2062 p1 = 1.01384 p2 = 3.74492 p3 = 15.4684 p4 = 0.133674 p5 = 0.994635
----------> Iteration 3
FVAL = 63.8241467861 Edm = 3.17758579488 Nfcn = 73
Error matrix change = 0.34157
Parameters : p0 = 17.9274 p1 = 1.52758 p2 = 4.93171 p3 = 12.2791 p4 = 0.132646 p5 = 0.994209
----------> Iteration 4
FVAL = 55.1442862092 Edm = 0.22822646638 Nfcn = 89
Error matrix change = 0.423967
Parameters : p0 = 14.5751 p1 = 2.94924 p2 = 5.87871 p3 = 14.8197 p4 = 0.131275 p5 = 0.991903
----------> Iteration 5
FVAL = 53.4289073945 Edm = 1.11050817173 Nfcn = 104
Error matrix change = 0.499462
Parameters : p0 = 13.8128 p1 = 4.31214 p2 = 4.77436 p3 = 15.2637 p4 = 0.129147 p5 = 0.984581
----------> Iteration 6
FVAL = 48.4756174099 Edm = 0.26351167941 Nfcn = 118
Error matrix change = 0.560446
Parameters : p0 = 12.0901 p1 = 10.4687 p2 = 2.42177 p3 = 13.7425 p4 = 0.124228 p5 = 0.962145
----------> Iteration 7
FVAL = 46.6349583124 Edm = 1.56781379254 Nfcn = 133
Error matrix change = 0.587229
Parameters : p0 = 11.2362 p1 = 14.7787 p2 = 0.198283 p3 = 11.597 p4 = 0.120788 p5 = 0.958233
----------> Iteration 8
FVAL = 32.3981722197 Edm = 6.55363294533 Nfcn = 151
Error matrix change = 0.634164
Parameters : p0 = 1.02818 p1 = 46.3715 p2 = -15.2613 p3 = 9.25378 p4 = 0.0928931 p5 = 0.946441
----------> Iteration 9
FVAL = 21.4555626905 Edm = 0.277914347616 Nfcn = 166
Error matrix change = 0.325569
Parameters : p0 = -2.66809 p1 = 58.5453 p2 = -20.8916 p3 = 8.43353 p4 = 0.0835661 p5 = 0.983301
----------> Iteration 10
FVAL = 21.2576224712 Edm = 0.0985943659181 Nfcn = 180
Error matrix change = 0.235324
Parameters : p0 = -2.531 p1 = 57.2304 p2 = -20.1351 p3 = 8.91543 p4 = 0.0842051 p5 = 0.98436
----------> Iteration 11
FVAL = 21.0418662198 Edm = 0.163200465587 Nfcn = 194
Error matrix change = 0.121684
Parameters : p0 = -2.93549 p1 = 57.7085 p2 = -20.1524 p3 = 8.78327 p4 = 0.0819441 p5 = 0.980776
----------> Iteration 12
FVAL = 20.1793241317 Edm = 0.148586112923 Nfcn = 211
Error matrix change = 0.0902235
Parameters : p0 = -2.66094 p1 = 58.3868 p2 = -20.6874 p3 = 8.45469 p4 = 0.0722423 p5 = 0.985085
----------> Iteration 13
FVAL = 20.0356153356 Edm = 0.0027813824137 Nfcn = 224
Error matrix change = 0.0782338
Parameters : p0 = -1.6371 p1 = 55.5779 p2 = -19.3667 p3 = 8.43758 p4 = 0.0727503 p5 = 0.984327
----------> Iteration 14
FVAL = 20.033124412 Edm = 3.26053080905e-05 Nfcn = 237
Error matrix change = 0.0415848
Parameters : p0 = -1.72039 p1 = 55.7224 p2 = -19.4085 p3 = 8.41476 p4 = 0.0723863 p5 = 0.984483
----------> Iteration 15
FVAL = 20.0330977486 Edm = 1.41976040596e-07 Nfcn = 251
Error matrix change = 0.0223374
Parameters : p0 = -1.72294 p1 = 55.7228 p2 = -19.4083 p3 = 8.41522 p4 = 0.0724347 p5 = 0.984485
----------> Iteration 16
FVAL = 20.0330977486 Edm = 1.41976040596e-07 Nfcn = 251
Error matrix change = 0.0223374
Parameters : p0 = -1.72294 p1 = 55.7228 p2 = -19.4083 p3 = 8.41522 p4 = 0.0724347 p5 = 0.984485
Minuit2Minimizer : Valid minimum - status = 0
FVAL = 20.0330977485550434
Edm = 1.41976040595893912e-07
Nfcn = 251
Bkg0 = -1.72294 +/- 3.20827
Bkg1 = 55.7228 +/- 8.6473
Bkg2 = -19.4083 +/- 4.14403
Gauss scale = 8.41522 +/- 1.33872
Gauss #sigma = 0.0724347 +/- 0.0116855
Gauss #mu = 0.984485 +/- 0.0109757
Covariance Matrix:
Bkg0 Bkg1 Bkg2 Gauss scaleGauss #sigma Gauss #mu
Bkg0 10.293 -25.273 11.233 1.4782 0.0095082 0.0011726
Bkg1 -25.273 74.776 -35.237 -5.827 -0.037636 0.00042072
Bkg2 11.233 -35.237 17.173 2.8018 0.018113 -0.00087613
Gauss scale 1.4782 -5.827 2.8018 1.7922 0.008954 -0.00050823
Gauss #sigma 0.0095082 -0.037636 0.018113 0.008954 0.00013655 -1.1754e-05
Gauss #mu 0.0011726 0.00042072 -0.00087613 -0.00050823 -1.1754e-05 0.00012047
Correlation Matrix:
Bkg0 Bkg1 Bkg2 Gauss scaleGauss #sigma Gauss #mu
Bkg0 1 -0.91099 0.84489 0.34417 0.25362 0.033301
Bkg1 -0.91099 1 -0.98333 -0.50335 -0.37246 0.0044329
Bkg2 0.84489 -0.98333 1 0.50504 0.37404 -0.019263
Gauss scale 0.34417 -0.50335 0.50504 1 0.57237 -0.034589
Gauss #sigma 0.25362 -0.37246 0.37404 0.57237 1 -0.091642
Gauss #mu 0.033301 0.0044329 -0.019263 -0.034589 -0.091642 1
****************************************
Minimizer is Minuit2 / Migrad
Chi2 = 20.0331
NDf = 30
Edm = 1.41976e-07
NCalls = 251
Bkg0 = -1.72294 +/- 3.20827
Bkg1 = 55.7228 +/- 8.6473
Bkg2 = -19.4083 +/- 4.14403
Gauss scale = 8.41522 +/- 1.33872
Gauss #sigma = 0.0724347 +/- 0.0116855
Gauss #mu = 0.984485 +/- 0.0109757
number of signal events = 168.304 0.05