Example for fitting a signal + background model to a histogram found in a file.
const std::map<ParIndex_t,std::string>
parNames{
};
}
double signal(
double *
x,
double *par) {
}
}
}
fitFcn.SetParameters(30,0,0,50.,0.1,1.);
histo->
Fit(
"fitFcn",
"VR+",
"ep");
const double integral =
signalFcn.Integral(0.,3.);
std::cout <<
"number of signal events = " << integral/
binwidth <<
" " <<
binwidth<< std::endl;
legend.AddEntry(histo,
"Data",
"lpe");
}
const int nBins = 60;
double data[nBins] = { 6, 1,10,12, 6,13,23,22,15,21,
23,26,36,25,27,35,40,44,66,81,
75,57,43,37,36,31,35,36,43,32,
40,37,38,33,36,44,42,37,32,32,
43,44,35,33,33,39,29,41,32,44,
26,39,29,35,32,21,21,15,25,15};
TFile*
f =
new TFile(
"exampleRootFile.root",
"RECREATE");
TH1D *histo =
new TH1D(
"histo",
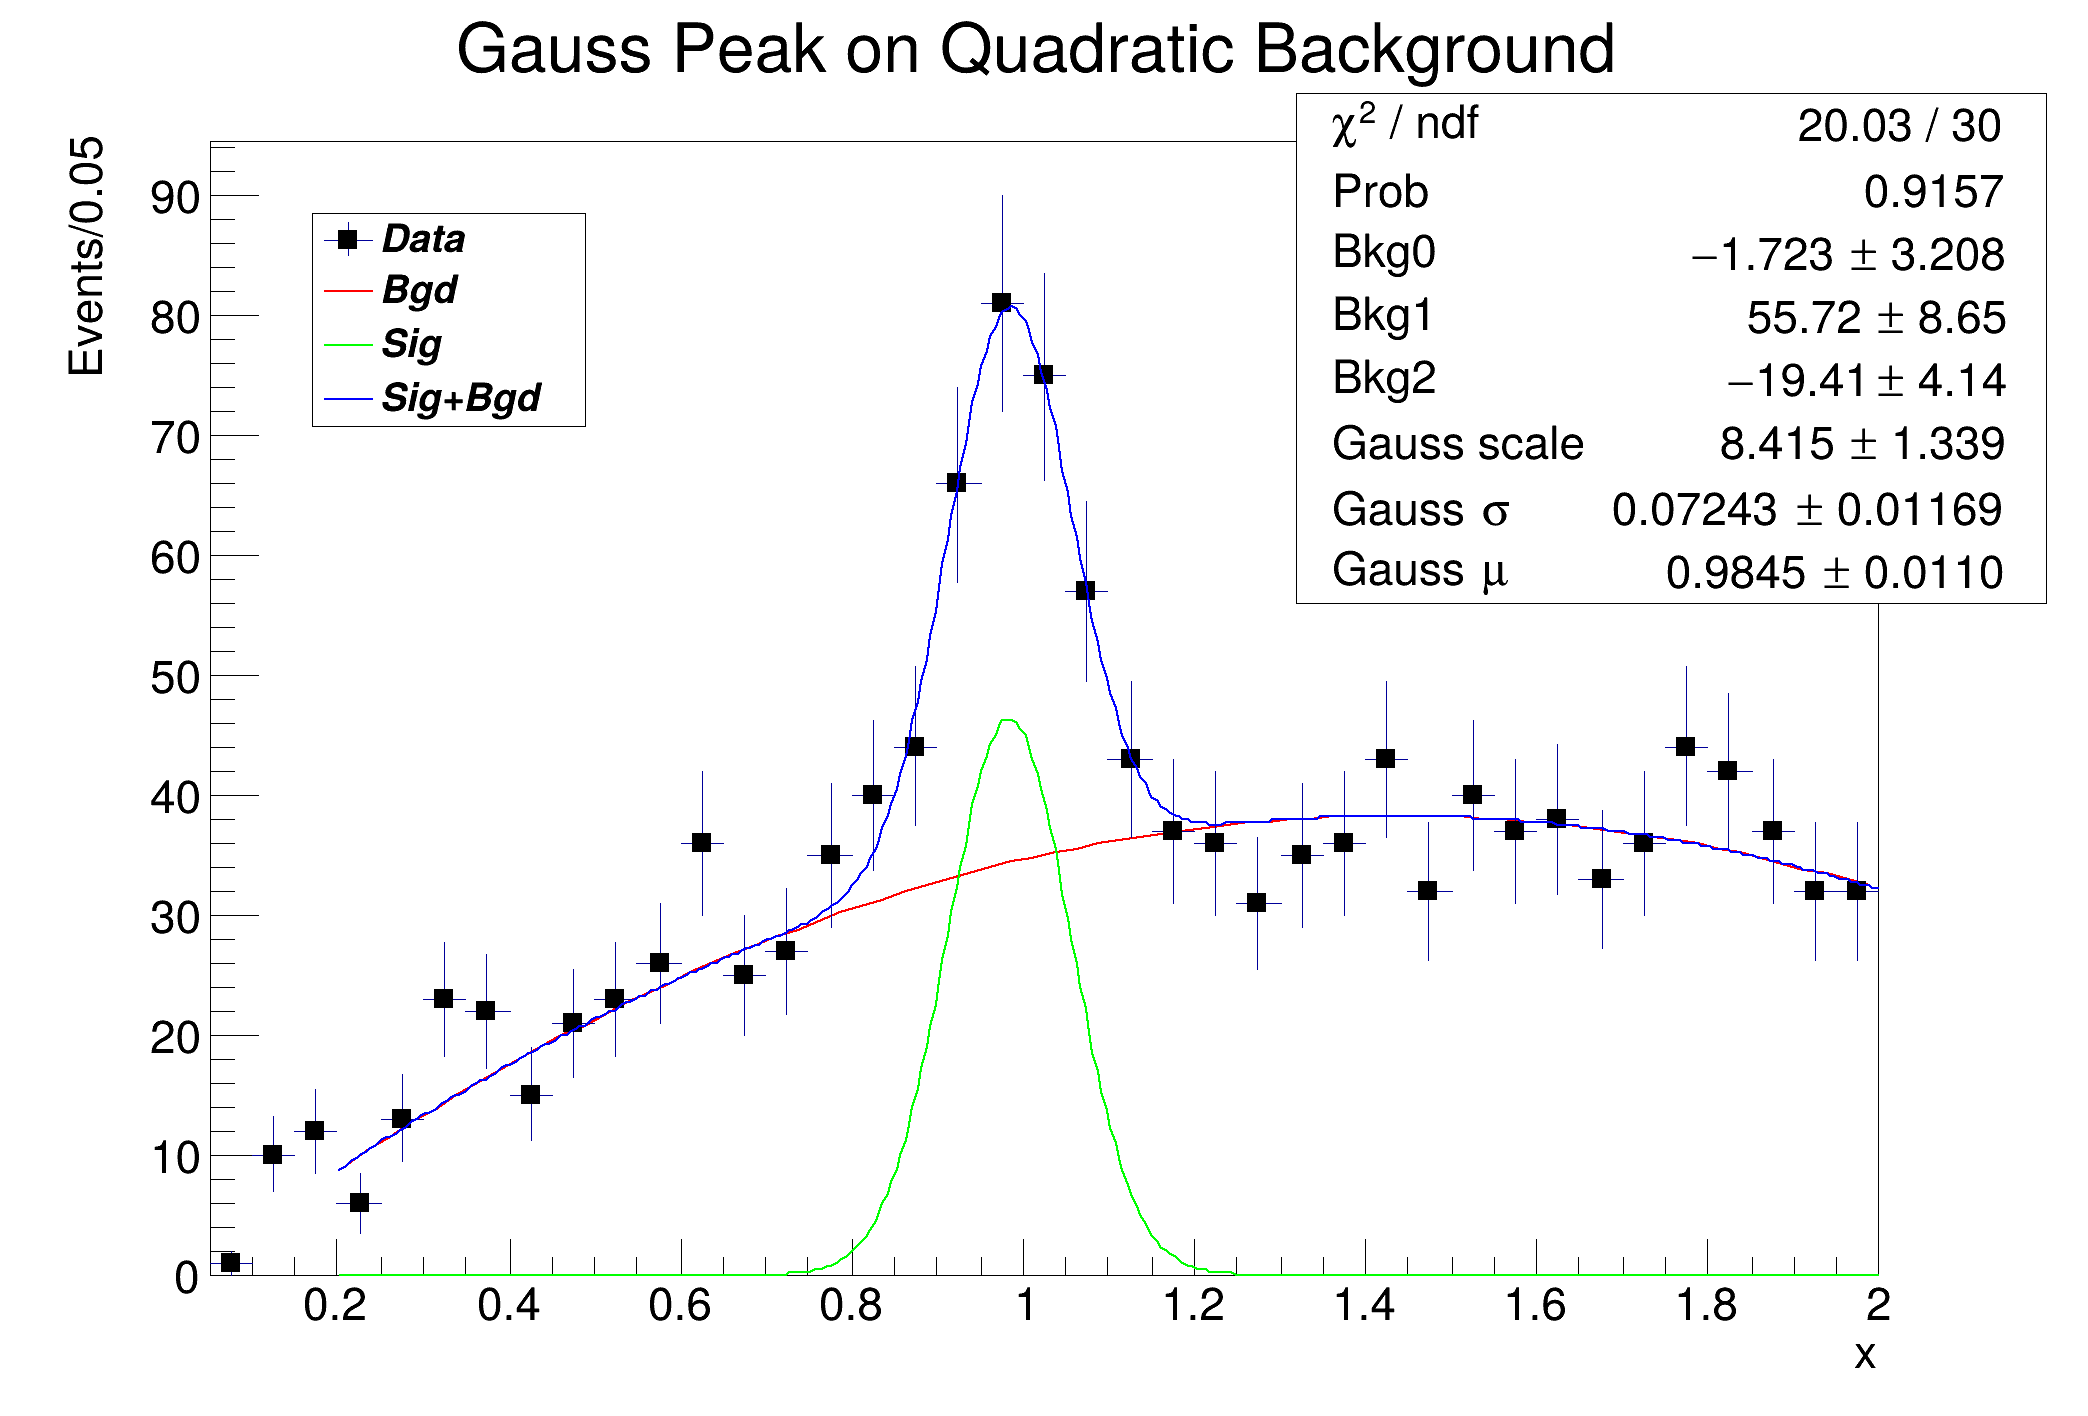
"Gauss Peak on Quadratic Background;x;Events/0.05",60,0,3);
}
TCanvas *
c1 =
new TCanvas(
"c1",
"Fitting Demo of Histogram in File",10,10,700,500);
f->GetObject(
"histo",histo);
if (!histo){
std::cout << "histo not found" << std::endl;
return;
}
}
ROOT::Detail::TRangeCast< T, true > TRangeDynCast
TRangeDynCast is an adapter class that allows the typed iteration through a TCollection.
Option_t Option_t TPoint TPoint const char GetTextMagnitude GetFillStyle GetLineColor GetLineWidth GetMarkerStyle GetTextAlign GetTextColor GetTextSize void data
Option_t Option_t TPoint TPoint const char GetTextMagnitude GetFillStyle GetLineColor GetLineWidth GetMarkerStyle GetTextAlign GetTextColor GetTextSize void char Point_t Rectangle_t WindowAttributes_t Float_t Float_t Float_t Int_t Int_t UInt_t UInt_t Rectangle_t Int_t Int_t Window_t TString Int_t GCValues_t GetPrimarySelectionOwner GetDisplay GetScreen GetColormap GetNativeEvent const char const char dpyName wid window const char font_name cursor keysym reg const char only_if_exist regb h Point_t winding char text const char depth char const char Int_t count const char ColorStruct_t color const char filename
R__EXTERN TStyle * gStyle
virtual void SetMarkerStyle(Style_t mstyle=1)
Set the marker style.
virtual void SetMarkerSize(Size_t msize=1)
Set the marker size.
virtual void SetRange(Int_t first=0, Int_t last=0)
Set the viewing range for the axis using bin numbers.
virtual Double_t GetBinWidth(Int_t bin) const
Return bin width.
A file, usually with extension .root, that stores data and code in the form of serialized objects in ...
1-D histogram with a double per channel (see TH1 documentation)
TH1 is the base class of all histogram classes in ROOT.
virtual TFitResultPtr Fit(const char *formula, Option_t *option="", Option_t *goption="", Double_t xmin=0, Double_t xmax=0)
Fit histogram with function fname.
void Draw(Option_t *option="") override
Draw this histogram with options.
virtual void SetBinContent(Int_t bin, Double_t content)
Set bin content see convention for numbering bins in TH1::GetBin In case the bin number is greater th...
This class displays a legend box (TPaveText) containing several legend entries.
void SetOptStat(Int_t stat=1)
The type of information printed in the histogram statistics box can be selected via the parameter mod...
void SetOptFit(Int_t fit=1)
The type of information about fit parameters printed in the histogram statistics box can be selected ...
Double_t Gaus(Double_t x, Double_t mean=0, Double_t sigma=1, Bool_t norm=kFALSE)
Calculates a gaussian function with mean and sigma.
Minuit2Minimizer: Minimize with max-calls 1780 convergence for edm < 0.01 strategy 1
Minuit2Minimizer : Valid minimum - status = 0
FVAL = 20.0330977485550541
Edm = 1.41976037524239175e-07
Nfcn = 251
Bkg0 = -1.72294 +/- 3.20827
Bkg1 = 55.7228 +/- 8.6473
Bkg2 = -19.4083 +/- 4.14403
Gauss scale = 8.41522 +/- 1.33872
Gauss #sigma = 0.0724347 +/- 0.0116855
Gauss #mu = 0.984485 +/- 0.0109757
Covariance Matrix:
Bkg0 Bkg1 Bkg2 Gauss scaleGauss #sigma Gauss #mu
Bkg0 10.293 -25.273 11.233 1.4782 0.0095082 0.0011726
Bkg1 -25.273 74.776 -35.237 -5.827 -0.037636 0.00042072
Bkg2 11.233 -35.237 17.173 2.8018 0.018113 -0.00087613
Gauss scale 1.4782 -5.827 2.8018 1.7922 0.008954 -0.00050823
Gauss #sigma 0.0095082 -0.037636 0.018113 0.008954 0.00013655 -1.1754e-05
Gauss #mu 0.0011726 0.00042072 -0.00087613 -0.00050823 -1.1754e-05 0.00012047
Correlation Matrix:
Bkg0 Bkg1 Bkg2 Gauss scaleGauss #sigma Gauss #mu
Bkg0 1 -0.91099 0.84489 0.34417 0.25362 0.033301
Bkg1 -0.91099 1 -0.98333 -0.50335 -0.37246 0.0044329
Bkg2 0.84489 -0.98333 1 0.50504 0.37404 -0.019263
Gauss scale 0.34417 -0.50335 0.50504 1 0.57237 -0.034589
Gauss #sigma 0.25362 -0.37246 0.37404 0.57237 1 -0.091642
Gauss #mu 0.033301 0.0044329 -0.019263 -0.034589 -0.091642 1
****************************************
Minimizer is Minuit2 / Migrad
Chi2 = 20.0331
NDf = 30
Edm = 1.41976e-07
NCalls = 251
Bkg0 = -1.72294 +/- 3.20827
Bkg1 = 55.7228 +/- 8.6473
Bkg2 = -19.4083 +/- 4.14403
Gauss scale = 8.41522 +/- 1.33872
Gauss #sigma = 0.0724347 +/- 0.0116855
Gauss #mu = 0.984485 +/- 0.0109757
number of signal events = 168.304 0.05