library: libGraf
#include "TGaxis.h" |
TGaxis
class description - source file - inheritance tree (.pdf)
    public:

                          TGaxis()
                          TGaxis(Double_t xmin, Double_t ymin, Double_t xmax, Double_t ymax, Double_t wmin, Double_t wmax, Int_t ndiv = 510, Option_t* chopt = "", Double_t gridlength = 0)
                          TGaxis(Double_t xmin, Double_t ymin, Double_t xmax, Double_t ymax, const char* funcname, Int_t ndiv = 510, Option_t* chopt = "", Double_t gridlength = 0)
                          TGaxis(const TGaxis&)
                  virtual ~TGaxis()
             virtual void AdjustBinSize(Double_t A1, Double_t A2, Int_t nold, Double_t& BinLow, Double_t& BinHigh, Int_t& nbins, Double_t& BinWidth)
             virtual void CenterLabels(Bool_t center = kTRUE)
             virtual void CenterTitle(Bool_t center = kTRUE)
           static TClass* Class()
             virtual void DrawAxis(Double_t xmin, Double_t ymin, Double_t xmax, Double_t ymax, Double_t wmin, Double_t wmax, Int_t ndiv = 510, Option_t* chopt = "", Double_t gridlength = 0)
                     TF1* GetFunction() const
                  Float_t GetGridLength() const
                    Int_t GetLabelColor() const
                    Int_t GetLabelFont() const
                  Float_t GetLabelOffset() const
                  Float_t GetLabelSize() const
             static Int_t GetMaxDigits()
      virtual const char* GetName() const
                    Int_t GetNdiv() const
      virtual const char* GetOption() const
                  Float_t GetTickSize() const
      virtual const char* GetTitle() const
                  Float_t GetTitleOffset() const
                  Float_t GetTitleSize() const
                 Double_t GetWmax() const
                 Double_t GetWmin() const
             virtual void ImportAxisAttributes(TAxis* axis)
          virtual TClass* IsA() const
                     void LabelsLimits(const char* label, Int_t& first, Int_t& last)
                  TGaxis& operator=(const TGaxis&)
             virtual void Paint(Option_t* chopt = "")
             virtual void PaintAxis(Double_t xmin, Double_t ymin, Double_t xmax, Double_t ymax, Double_t& wmin, Double_t& wmax, Int_t& ndiv, Option_t* chopt = "", Double_t gridlength = 0, Bool_t drawGridOnly = kFALSE)
             virtual void Rotate(Double_t X, Double_t Y, Double_t CFI, Double_t SFI, Double_t XT, Double_t YT, Double_t& U, Double_t& V)
             virtual void SavePrimitive(ofstream& out, Option_t* option)
             virtual void SetDecimals(Bool_t dot = kTRUE)
                     void SetFunction(const char* funcname = "")
                     void SetGridLength(Float_t gridlength)
                     void SetLabelColor(Int_t labelcolor)
                     void SetLabelFont(Int_t labelfont)
                     void SetLabelOffset(Float_t labeloffset)
                     void SetLabelSize(Float_t labelsize)
              static void SetMaxDigits(Int_t maxd = 5)
             virtual void SetMoreLogLabels(Bool_t more = kTRUE)
             virtual void SetName(const char* name)
             virtual void SetNdivisions(Int_t ndiv)
             virtual void SetNoExponent(Bool_t noExponent = kTRUE)
                     void SetOption(Option_t* option = "")
                     void SetTickSize(Float_t ticksize)
                     void SetTimeFormat(const char* tformat)
                     void SetTimeOffset(Double_t toffset, Option_t* option = "local")
             virtual void SetTitle(const char* title = "")
                     void SetTitleOffset(Float_t titleoffset = 1)
                     void SetTitleSize(Float_t titlesize)
                     void SetWmax(Double_t wmax)
                     void SetWmin(Double_t wmin)
             virtual void ShowMembers(TMemberInspector& insp, char* parent)
             virtual void Streamer(TBuffer& b)
                     void StreamerNVirtual(TBuffer& b)
    protected:

          Double_t fWmin          Lowest value on the axis
          Double_t fWmax          Highest value on the axis
           Float_t fGridLength    Length of the grid in NDC
           Float_t fTickSize      Size of primary tick mark in NDC
           Float_t fLabelOffset   Offset of label wrt axis
           Float_t fLabelSize     Size of labels in NDC
           Float_t fTitleOffset   Offset of title wrt axis
           Float_t fTitleSize     Size of title in NDC
             Int_t fNdiv          Number of divisions
             Int_t fLabelColor    Color for labels
             Int_t fLabelFont     Font for labels
           TString fChopt         Axis options
           TString fName          axis name
           TString fTitle         axis title
           TString fTimeFormat    Time format, ex: 09/12/99 12:34:00
           TString fFunctionName  name of mapping function pointed by fFunction
              TF1* fFunction      !Pointer to function computing axis values
            TAxis* fAxis          !pointer to original TAxis axis (if any)
      static Int_t fgMaxDigits    !Number of digits above which the 10>N notation is used
Service class for the graphical representation of axis.
Instances of this class are generated by the histogram classes and TGraph.
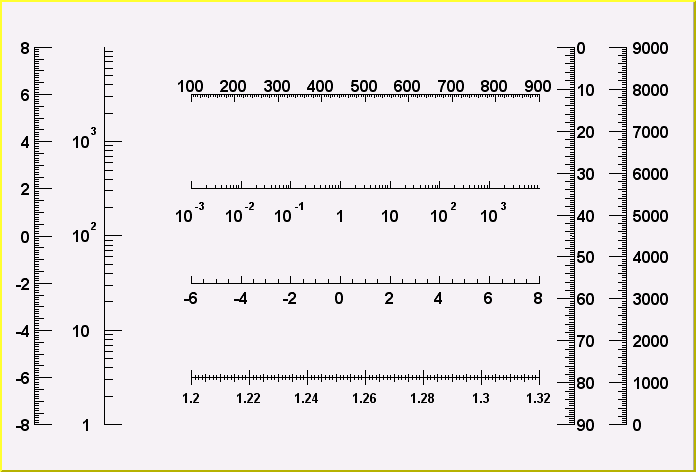
The picture below has been generated by the following macro.
{
gROOT.Reset();
c1 = new TCanvas("c1","Examples of Gaxis",10,10,700,500);
c1->Range(-10,-1,10,1);
TGaxis *axis1 = new TGaxis(-4.5,-0.2,5.5,-0.2,-6,8,510,"");
axis1->SetName("axis1");
axis1->Draw();
TGaxis *axis2 = new TGaxis(-4.5,0.2,5.5,0.2,0.001,10000,510,"G");
axis2->SetName("axis2");
axis2->Draw();
TGaxis *axis3 = new TGaxis(-9,-0.8,-9,0.8,-8,8,50510,"");
axis3->SetName("axis3");
axis3->Draw();
TGaxis *axis4 = new TGaxis(-7,-0.8,-7,0.8,1,10000,50510,"G");
axis4->SetName("axis4");
axis4->Draw();
TGaxis *axis5 = new TGaxis(-4.5,-0.6,5.5,-0.6,1.2,1.32,80506,"-+");
axis5->SetName("axis5");
axis5->SetLabelSize(0.03);
axis5->SetTextFont(72);
axis5->SetLabelOffset(0.025);
axis5->Draw();
TGaxis *axis6 = new TGaxis(-4.5,0.6,5.5,0.6,100,900,50510,"-");
axis6->SetName("axis6");
axis6->Draw();
TGaxis *axis7 = new TGaxis(8,-0.8,8,0.8,0,9000,50510,"+L");
axis7->SetName("axis7");
axis7->SetLabelOffset(0.01);
axis7->Draw();
//one can make axis going top->bottom. However because of a long standing
//problem, the two x values should not be equal
TGaxis *axis8 = new TGaxis(6.5,0.8,6.499,-0.8,0,90,50510,"-");
axis8->SetName("axis8");
axis8->Draw();
}
/*
 */
*/
  See the second TGaxis constructor for examples of TGaxis
  with a mapping function.
TGaxis(): TLine(), TAttText(11,0,1,62,0.040)
*-*-*-*-*-*-*-*-*-*-*Gaxis default constructor-*-*-*-*-*-*-*-*-*-*-*-*-*-*-*
*-*                  =========================
TGaxis(Double_t xmin, Double_t ymin, Double_t xmax, Double_t ymax,
Double_t wmin, Double_t wmax, Int_t ndiv, Option_t *chopt,
Double_t gridlength)
: TLine(xmin,ymin,xmax,ymax), TAttText(11,0,1,62,0.040)
*-*-*-*-*-*-*-*-*-*-*Gaxis normal constructor-*-*-*-*-*-*-*-*-*-*-*-*-*-*-*
*-*                  =========================
  See explanation of parameters in PaintAxis
TGaxis(Double_t xmin, Double_t ymin, Double_t xmax, Double_t ymax,
const char *funcname, Int_t ndiv, Option_t *chopt,
Double_t gridlength)
: TLine(xmin,ymin,xmax,ymax), TAttText(11,0,1,62,0.040)
*-*-*-*-*-*-*-*-*-*-*Gaxis constructor with a TF1 to map axis values-*-*-*
*-* ===============================================
See explanation of parameters in PaintAxis
Instead of the wmin,wmax arguments of the normal constructor, the
name of a TF1 function can be specified. This function will be used
by TGaxis::PaintAxis to map the user coordinates to the axis values
and ticks.
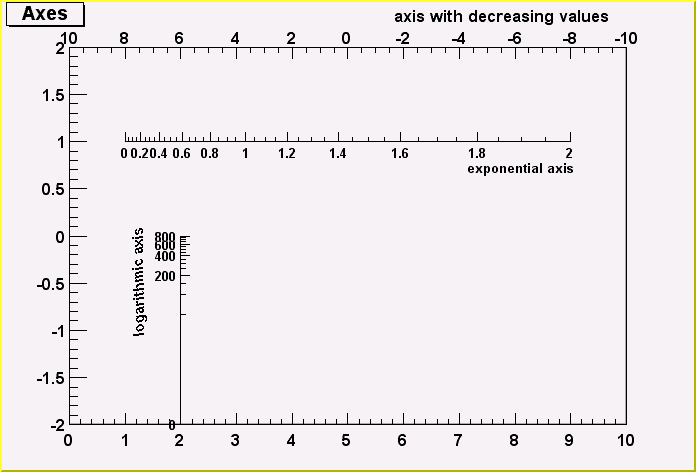
Examples:
void gaxis3a()
{
gStyle->SetOptStat(0);
TH2F *h2 = new TH2F("h","Axes",100,0,10,100,-2,2);
h2->Draw();
TF1 *f1=new TF1("f1","-x",-10,10);
TGaxis *A1 = new TGaxis(0,2,10,2,"f1",510,"-");
A1->SetTitle("axis with decreasing values");
A1->Draw();
TF1 *f2=new TF1("f2","exp(x)",0,2);
TGaxis *A2 = new TGaxis(1,1,9,1,"f2");
A2->SetTitle("exponential axis");
A2->SetLabelSize(0.03);
A2->SetTitleSize(0.03);
A2->SetTitleOffset(1.2);
A2->Draw();
TF1 *f3=new TF1("f3","log10(x)",1,1000);
TGaxis *A3 = new TGaxis(2,-2,2,0,"f3",505,"G");
A3->SetTitle("logarithmic axis");
A3->SetLabelSize(0.03);
A3->SetTitleSize(0.03);
A3->SetTitleOffset(1.2);
A3->Draw();
}
/*
 */
*/
~TGaxis()
*-*-*-*-*-*-*-*-*-*-*Gaxis default destructor-*-*-*-*-*-*-*-*-*-*-*-*-*-*-*
*-*                  =======================
void CenterLabels(Bool_t center)
   if center = kTRUE axis labels are centered in the center of the bin
   default is to center on the primary tick marks
   This option does not make sense if there are more bins than tick marks.
void CenterTitle(Bool_t center)
   if center = kTRUE axis title will be centered
   default is right adjusted
void DrawAxis(Double_t xmin, Double_t ymin, Double_t xmax, Double_t ymax,
Double_t wmin, Double_t wmax, Int_t ndiv, Option_t *chopt,
Double_t gridlength)
*-*-*-*-*-*-*-*-*-*-*Draw this axis with new attributes*-*-*-*-*-*-*-*-*-*
*-*                  ==================================
Int_t GetMaxDigits()
static function returning fgMaxDigits (See SetMaxDigits)
void ImportAxisAttributes(TAxis *axis)
Copy TAxis attributes to this TGaxis
void Paint(Option_t *)
*-*-*-*-*-*-*-*-*-*-*Draw this axis with its current attributes*-*-*-*-*-*-*
*-*                  ==========================================
void PaintAxis(Double_t xmin, Double_t ymin, Double_t xmax, Double_t ymax,
Double_t &wmin, Double_t &wmax, Int_t &ndiv, Option_t *chopt,
Double_t gridlength, Bool_t drawGridOnly)
*-*-*-*-*-*-*-*-*-*-*-*Control function to draw an axis*-*-*-*-*-*-*-*-*-*-*
*-*                    ================================

============> Original authors (O.Couet C.E.Vandoni N.Cremel-Somon)
              largely modified and converted to C++ class by Rene Brun

 _Input parameters:

  xmin      : X origin coordinate in WC space.
  xmax      : X end axis coordinate in WC space.
  ymin      : Y origin coordinate in WC space.
  ymax      : Y end axis coordinate in WC space.
  wmin      : Lowest value for the tick mark
              labels written on the axis.
  wmax      : Highest value for the tick mark labels
              written on the axis.
  ndiv      : Number of divisions.

       ndiv=N1 + 100*N2 + 10000*N3
       N1=number of 1st divisions.
       N2=number of 2nd divisions.
       N3=number of 3rd divisions.
           e.g.:
           nndi=0 --> no tick marks.
           nndi=2 --> 2 divisions, one tick mark in the middle
                      of the axis.

  chopt :  options (see below).

       chopt='G': loGarithmic scale, default is linear.
       chopt='B': Blank axis. Useful to superpose axis.

 Orientation of tick marks on axis.
 ----------------------------------

   Tick marks are normally drawn on the positive side of the axis,
   however, if x0=x1, then negative.

       chopt='+': tick marks are drawn on Positive side. (default)
       chopt='-': tick mark are drawn on the negative side.
       i.e: '+-' --> tick marks are drawn on both sides of the axis.
       chopt='U': Unlabeled axis, default is labeled.

 Size of tick marks
 ------------------
 By default, tick marks have a length equal to 3 per cent of the
 axis length.
 When the option "S" is specified, the length of the tick marks
 is equal to fTickSize*axis_length, where fTickSize may be set
 via TGaxis::SetTickSize.

 Position of labels on axis.
 ---------------------------

   Labels are normally drawn on side opposite to tick marks.
   However:

       chopt='=': on Equal side

 Orientation of labels on axis.
 ------------------------------

   Labels are normally drawn parallel to the axis.
   However if x0=x1, then Orthogonal
           if y0=Y1, then Parallel

 Position of labels on tick marks.
 ---------------------------------

   Labels are centered on tick marks.
   However , if x0=x1, then they are right adjusted.

       chopt='R': labels are Right adjusted on tick mark.
                    (default is centered)
       chopt='L': labels are Left adjusted on tick mark.
       chopt='C': labels are Centered on tick mark.
       chopt='M': In the Middle of the divisions.

 Format of labels.
 -----------------

   Blank characters are stripped, and then the
   label is correctly aligned. the dot, if last
   character of the string, is also stripped,
   unless the option "." (a dot, or period) is specified.
   if SetDecimals(kTRUE) has been called (bit TAxis::kDecimals set).
   all labels have the same number of decimals after the "."
   The same is true if gStyle->SetStripDecimals(kFALSE) has been called.

   In the following, we have some parameters, like
   tick marks length and characters height (in percentage
   of the length of the axis (WC))
   The default values are as follows:

   Primary tick marks: 3.0 %
   Secondary tick marks: 1.5 %
   Third order tick marks: .75 %
   Characters height for labels: 4%

   Labels offset: 1.0 %

 optional grid.
 --------------

       chopt='W': cross-Wire
   In case of a log axis, the grid is only drawn for the primary tick marks
   if the number of secondary and tertiary divisions is 0.

 Axis bining optimization.
 -------------------------

   By default the axis bining is optimized .

       chopt='N': No bining optimization
       chopt='I': Integer labelling

 Maximum Number of Digits for the axis labels
 --------------------------------------------
 See the static function TGaxis::SetMaxDigits

 Time representation.
 --------------------

   Axis labels may be considered as times, plotted in a defined time format.
   The format is set with SetTimeFormat().
   wmin and wmax are considered as two time values in seconds.
   The time axis will be spread around the time offset value (set with
   SetTimeOffset() ). Actually it will go from TimeOffset+wmin to
   TimeOffset+wmax.
   see examples in tutorials timeonaxis.C and timeonaxis2.C

       chopt='t': Plot times with a defined format instead of values
void AdjustBinSize(Double_t A1, Double_t A2, Int_t nold
,Double_t &binLow, Double_t &binHigh, Int_t &nbins, Double_t &binWidth)
*-*-*-*-*-*-*-*-*-*-*-*Axis labels optimisation*-*-*-*-*-*-*-*-*-*-*-*-*-*
*-*                    ========================

   This routine adjusts the bining of the axis
   in order to have integer values for the labels

 _Input parameters:

  A1,A2    : Old WMIN,WMAX .
  binLow,binHigh : New WMIN,WMAX .
  nold     : Old NDIV (primary divisions)
  nbins    : New NDIV .
void LabelsLimits(const char *label, Int_t &first, Int_t &last)
*-*-*-*-*-*-*-*-*Find first and last character of a label*-*-*-*-*-*-*-*-*-*
*-*              ========================================
void Rotate(Double_t X, Double_t Y, Double_t CFI, Double_t SFI
,Double_t XT, Double_t YT, Double_t &U, Double_t &V)
*-*-*-*-*-*-*-*-*-*-*-*-*-*Rotate axis coordinates*-*-*-*-*-*-*-*-*-*-*-*-*
*-*                        =======================
void SavePrimitive(ofstream &out, Option_t *)
Save primitive as a C++ statement(s) on output stream out
void SetDecimals(Bool_t dot)
 Set the Decimals flag
 By default, blank characters are stripped, and then the
 label is correctly aligned. The dot, if last character of the string,
 is also stripped, unless this option is specified.
 One can disable the option by calling axis.SetDecimals(kTRUE).
 Note the bit is set in fBits (as opposed to fBits2 in TAxis!)
void SetFunction(const char *funcname)
        specify a function to map the axis values
        =========================================
void SetMaxDigits(Int_t maxd)
 static function to set fgMaxDigits for axis with the bin content
 (y axis for 1-d histogram, z axis for 2-d histogram)
fgMaxDigits is the maximum number of digits permitted for the axis
labels above which the notation with 10^N is used.
For example, to accept 6 digits number like 900000 on an axis
call TGaxis::SetMaxDigits(6). The default value is 5.
fgMaxDigits must be greater than 0.
void SetName(const char *name)
*-*-*-*-*-*-*-*-*-*-*Change the name of the axis*-*-*-*-*-*-*-*-*-*-*-*-*-*
*-*                  ============================
void SetMoreLogLabels(Bool_t more)
 Set the kMoreLogLabels bit flag
 When this option is selected more labels are drawn when in log scale
 and there is a small number of decades  (<3).
 Note that this option is automatically inherited from TAxis
void SetNoExponent(Bool_t noExponent)
 Set the NoExponent flag
 By default, an exponent of the form 10^N is used when the label values
 are either all very small or very large.
 One can disable the exponent by calling axis.SetNoExponent(kTRUE).
void SetOption(Option_t *option)
*-*-*-*-*-*-*-*-*-*-*-*-*-*-*To set axis options*-*-*-*-*-*-*-*-*-*-*-*-*-*
*-*                          ===================
void SetTitle(const char *title)
*-*-*-*-*-*-*-*-*-*-*Change the title of the axis*-*-*-*-*-*-*-*-*-*-*-*-*
*-*                  ============================
void SetTimeFormat(const char *tformat)
*-*-*-*-*-*-*-*-*-*-*Change the format used for time plotting *-*-*-*-*-*-*-*
*-*                  ========================================
  The format string for date and time use the same options as the one used
  in the standard strftime C function, i.e. :
    for date :
      %a abbreviated weekday name
      %b abbreviated month name
      %d day of the month (01-31)
      %m month (01-12)
      %y year without century

    for time :
      %H hour (24-hour clock)
      %I hour (12-hour clock)
      %p local equivalent of AM or PM
      %M minute (00-59)
      %S seconds (00-61)
      %% %
void SetTimeOffset(Double_t toffset, Option_t *option)
 Change the time offset
 If option = "gmt" the time offset is treated as a GMT time.
void Streamer(TBuffer &R__b)
Stream an object of class TGaxis.
Inline Functions
            Float_t GetGridLength() const
               TF1* GetFunction() const
              Int_t GetLabelColor() const
              Int_t GetLabelFont() const
            Float_t GetLabelOffset() const
            Float_t GetLabelSize() const
            Float_t GetTitleOffset() const
            Float_t GetTitleSize() const
        const char* GetName() const
        const char* GetOption() const
        const char* GetTitle() const
              Int_t GetNdiv() const
           Double_t GetWmin() const
           Double_t GetWmax() const
            Float_t GetTickSize() const
               void SetLabelColor(Int_t labelcolor)
               void SetLabelFont(Int_t labelfont)
               void SetLabelOffset(Float_t labeloffset)
               void SetLabelSize(Float_t labelsize)
               void SetNdivisions(Int_t ndiv)
               void SetTickSize(Float_t ticksize)
               void SetGridLength(Float_t gridlength)
               void SetTitleOffset(Float_t titleoffset = 1)
               void SetTitleSize(Float_t titlesize)
               void SetWmin(Double_t wmin)
               void SetWmax(Double_t wmax)
            TClass* Class()
            TClass* IsA() const
               void ShowMembers(TMemberInspector& insp, char* parent)
               void StreamerNVirtual(TBuffer& b)
             TGaxis TGaxis(const TGaxis&)
            TGaxis& operator=(const TGaxis&)
Author: Rene Brun, Olivier Couet 12/12/94
Last update: root/graf:$Name: $:$Id: TGaxis.cxx,v 1.84 2005/11/22 11:09:20 couet Exp $
Copyright (C) 1995-2000, Rene Brun and Fons Rademakers. *
ROOT page - Class index - Class Hierarchy - Top of the page
This page has been automatically generated. If you have any comments or suggestions about the page layout send a mail to ROOT support, or contact the developers with any questions or problems regarding ROOT.