 |
ROOT
Reference Guide |

|
| |
ROOT
Reference Guide |
|
A common method used in High Energy Physics to perform measurements is the maximum Likelihood method, exploiting discriminating variables to disentangle signal from background. The crucial point for such an analysis to be reliable is to use an exhaustive list of sources of events combined with an accurate description of all the Probability Density Functions (PDF).
To assess the validity of the fit, a convincing quality check is to explore further the data sample by examining the distributions of control variables. A control variable can be obtained for instance by removing one of the discriminating variables before performing again the maximum Likelihood fit: this removed variable is a control variable. The expected distribution of this control variable, for signal, is to be compared to the one extracted, for signal, from the data sample. In order to be able to do so, one must be able to unfold from the distribution of the whole data sample.
The TSPlot method allows to reconstruct the distributions for the control variable, independently for each of the various sources of events, without making use of any a priori knowledge on this variable. The aim is thus to use the knowledge available for the discriminating variables to infer the behaviour of the individual sources of events with respect to the control variable.
TSPlot is optimal if the control variable is uncorrelated with the discriminating variables.
A detail description of the formalism itself, called \(\hbox{$_s$}{\cal P}lot\), is given in [1].
The \(\hbox{$_s$}{\cal P}lot\) technique is developed in the above context of a maximum Likelihood method making use of discriminating variables.
One considers a data sample in which are merged several species of events. These species represent various signal components and background components which all together account for the data sample. The different terms of the log-Likelihood are:
The extended log-Likelihood reads:
\[ {\cal L}=\sum_{e=1}^{N}\ln \Big\{ \sum_{i=1}^{{\rm N}_{\rm s}}N_i{\rm f}_i(y_e) \Big\} -\sum_{i=1}^{{\rm N}_{\rm s}}N_i \tag{1} \]
From this expression, after maximization of \({\cal L}\) with respect to the \(N_i\) parameters, a weight can be computed for every event and each species, in order to obtain later the true distribution \(\hbox{M}_i(x)\) of variable \(x\). If \({\rm n}\) is one of the \({\rm N}_{\rm s}\) species present in the data sample, the weight for this species is defined by:
\[ \fbox{$ {_s{\cal P}}_{\rm n}(y_e)={\sum_{j=1}^{{\rm N}_{\rm s}} \hbox{V}_{{\rm n}j}{\rm f}_j(y_e)\over\sum_{k=1}^{{\rm N}_{\rm s}}N_k{\rm f}_k(y_e) } $} , \tag{2} \]
where \(\hbox{V}_{{\rm n}j}\)
is the covariance matrix resulting from the Likelihood maximization. This matrix can be used directly from the fit, but this is numerically less accurate than the direct computation:
\[ \hbox{ V}^{-1}_{{\rm n}j}~=~ {\partial^2(-{\cal L})\over\partial N_{\rm n}\partial N_j}~=~ \sum_{e=1}^N {{\rm f}_{\rm n}(y_e){\rm f}_j(y_e)\over(\sum_{k=1}^{{\rm N}_{\rm s}}N_k{\rm f}_k(y_e))^2} . \tag{3} \]
The distribution of the control variable \(x\) obtained by histogramming the weighted events reproduces, on average, the true distribution \({\hbox{ {M}}}_{\rm n}(x)\)
The class TSPlot allows to reconstruct the true distribution \({\hbox{ {M}}}_{\rm n}(x)\)
of a control variable \(x\) for each of the \({\rm N}_{\rm s}\) species from the sole knowledge of the PDFs of the discriminating variables \({\rm f}_i(y)\). The plots obtained thanks to the TSPlot class are called \(\hbox {$_s$}{\cal P}lots\).
Beside reproducing the true distribution, \(\hbox {$_s$}{\cal P}lots\) bear remarkable properties:
\[ \sum_{e=1}^{N} {_s{\cal P}}_{\rm n}(y_e)~=~N_{\rm n} ~. \tag{4} \]
\[ \sum_{l=1}^{{\rm N}_{\rm s}} {_s{\cal P}}_l(y_e) ~=~1 ~. \tag{5} \]
That is to say that, summing up the \({\rm N}_{\rm s}\) \(\hbox {$_s$}{\cal P}lots\), one recovers the data sample distribution in \(x\), and summing up the number of events entering in a \(\hbox{$_s$}{\cal P}lot\) for a given species, one recovers the yield of the species, as provided by the fit. The property 4 is implemented in the TSPlot class as a check.
\[ \sigma[N_{\rm n}\ _s\tilde{\rm M}_{\rm n}(x) {\delta x}]~=~\sqrt{\sum_{e \subset {\delta x}} ({_s{\cal P}}_{\rm n})^2} ~. \tag{6} \]
reproduces the statistical uncertainty on the yield \(N_{\rm n}\), as provided by the fit: \(\sigma[N_{\rm n}]\equiv\sqrt{\hbox{ V}_{{\rm n}{\rm n}}}\) . Because of that and since the determination of the yields is optimal when obtained using a Likelihood fit, one can conclude that the \(\hbox{$_s$}{\cal P}lot\) technique is itself an optimal method to reconstruct distributions of control variables.
The \(\hbox {$_s$}{\cal P}lots\) reproduce the true distributions of the species in the control variable \(x\), within the above defined statistical uncertainties.
To illustrate the technique, one considers an example derived from the analysis where \(\hbox {$_s$}{\cal P}lots\) have been first used (charmless B decays). One is dealing with a data sample in which two species are present: the first is termed signal and the second background. A maximum Likelihood fit is performed to obtain the two yields \(N_1\) and \(N_2\) . The fit relies on two discriminating variables collectively denoted \(y\) which are chosen within three possible variables denoted \({m_{\rm ES}}\) , \(\Delta E\) and \({\cal F}\). The variable which is not incorporated in \(y\) is used as the control variable \(x\) . The six distributions of the three variables are assumed to be the ones depicted in Fig. 1.
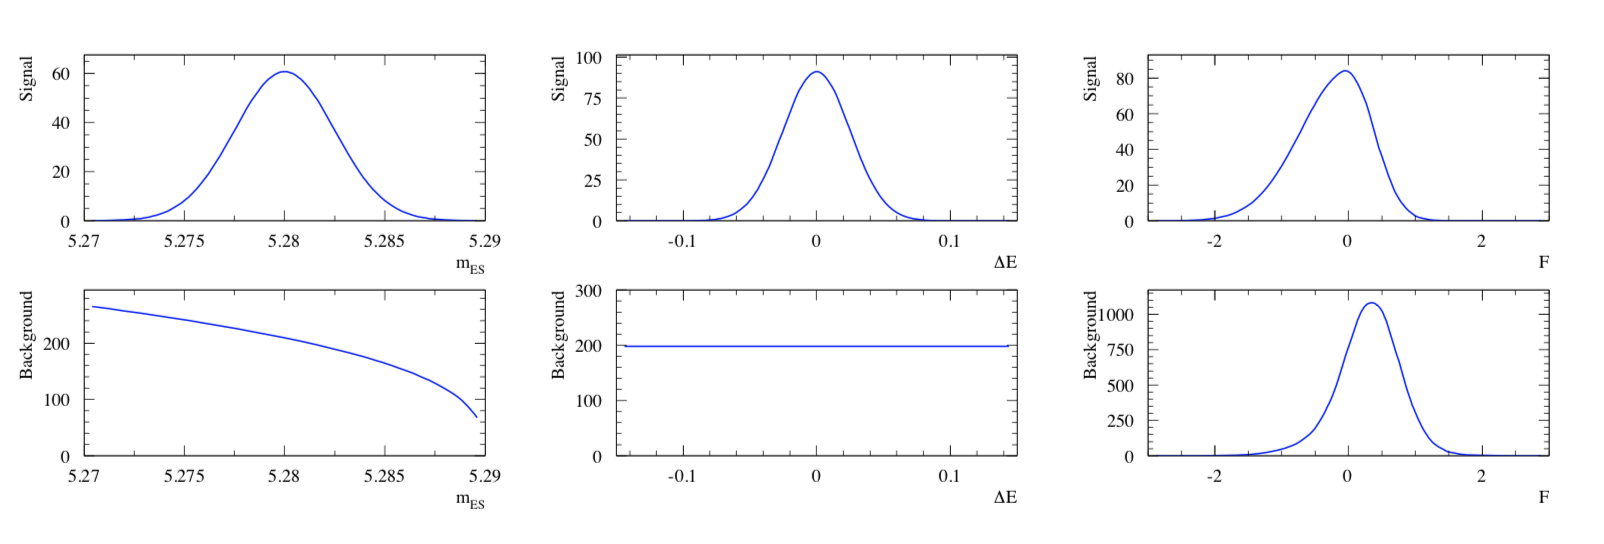
Distributions of the three discriminating variables available to perform the Likelihood fit: \({m_{\rm ES}}\) , \(\Delta E\) , \({\cal F}\) . Among the three variables, two are used to perform the fit while one is kept out of the fit to serve the purpose of a control variable. The three distributions on the top (resp. bottom) of the figure correspond to the signal (resp. background). The unit of the vertical axis is chosen such that it indicates the number of entries per bin, if one slices the histograms in 25 bins.
A data sample being built through a Monte Carlo simulation based on the distributions shown in Fig. 1, one obtains the three distributions of Fig. 2. Whereas the distribution of \(\Delta E\) clearly indicates the presence of the signal, the distribution of \({m_{\rm ES}}\) and \({\cal F}\) are less obviously populated by signal.
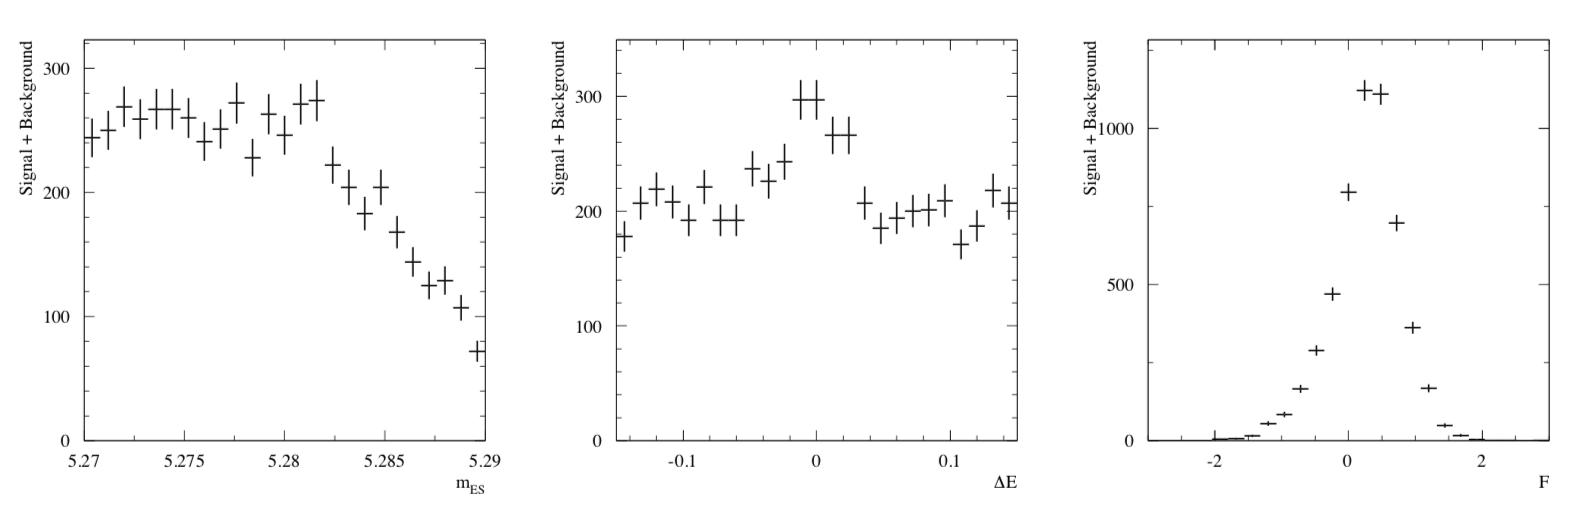
Distributions of the three discriminating variables for signal plus background. The three distributions are the ones obtained from a data sample obtained through a Monte Carlo simulation based on the distributions shown in Fig. 1. The data sample consists of 500 signal events and 5000 background events.
Choosing \(\Delta E\) and \({\cal F}\) as discriminating variables to determine \(N_1\) and \(N_2\) through a maximum Likelihood fit, one builds, for the control variable \({m_{\rm ES}}\) which is unknown to the fit, the two \(\hbox {$_s$}{\cal P}lots\) for signal and background shown in Fig. 3. One observes that the \(\hbox{$_s$}{\cal P}lot\) for signal reproduces correctly the PDF even where the latter vanishes, although the error bars remain sizeable. This results from the almost complete cancellation between positive and negative weights: the sum of weights is close to zero while the sum of weights squared is not. The occurrence of negative weights occurs through the appearance of the covariance matrix, and its negative components, in the definition of Eq. (2).
A word of caution is in order with respect to the error bars. Whereas their sum in quadrature is identical to the statistical uncertainties of the yields determined by the fit, and if, in addition, they are asymptotically correct, the error bars should be handled with care for low statistics and/or for too fine binning. This is because the error bars do not incorporate two known properties of the PDFs: PDFs are positive definite and can be non-zero in a given x-bin, even if in the particular data sample at hand, no event is observed in this bin. The latter limitation is not specific to \(\hbox {$_s$}{\cal P}lots\) , rather it is always present when one is willing to infer the PDF at the origin of an histogram, when, for some bins, the number of entries does not guaranty the applicability of the Gaussian regime. In such situations, a satisfactory practice is to attach allowed ranges to the histogram to indicate the upper and lower limits of the PDF value which are consistent with the actual observation, at a given confidence level.
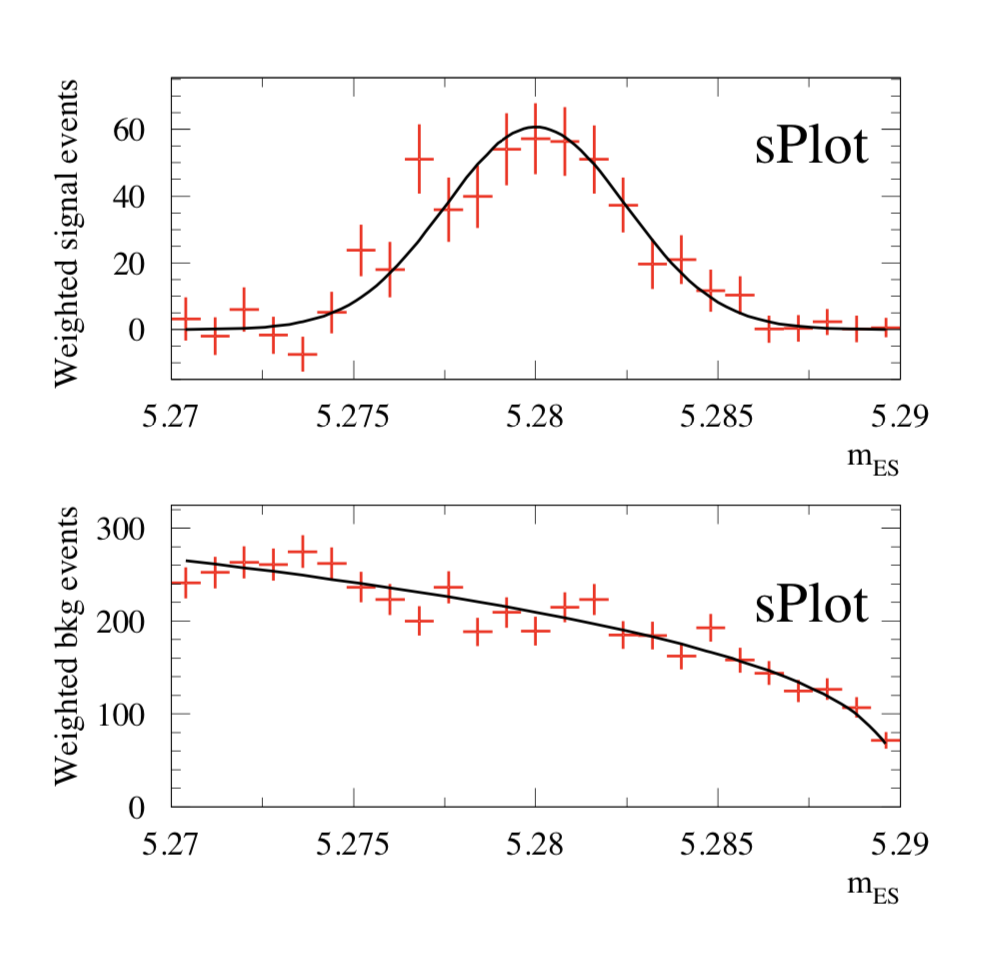
The \(\hbox {$_s$}{\cal P}lots\) (signal on top, background on bottom) obtained for \({m_{\rm ES}}\) are represented as dots with error bars. They are obtained from a fit using only information from \(\Delta E\) and \({\cal F}\)
Choosing \({m_{\rm ES}}\) and \(\Delta E\) as discriminating variables to determine \(N_1\) and \(N_2\) through a maximum Likelihood fit, one builds, for the control variable \({\cal F}\) which is unknown to the fit, the two \(\hbox {$_s$}{\cal P}lots\) for signal and background shown in Fig. 4. In the \(\hbox{$_s$}{\cal P}lot\) for signal one observes that error bars are the largest in the \(x\) regions where the background is the largest.
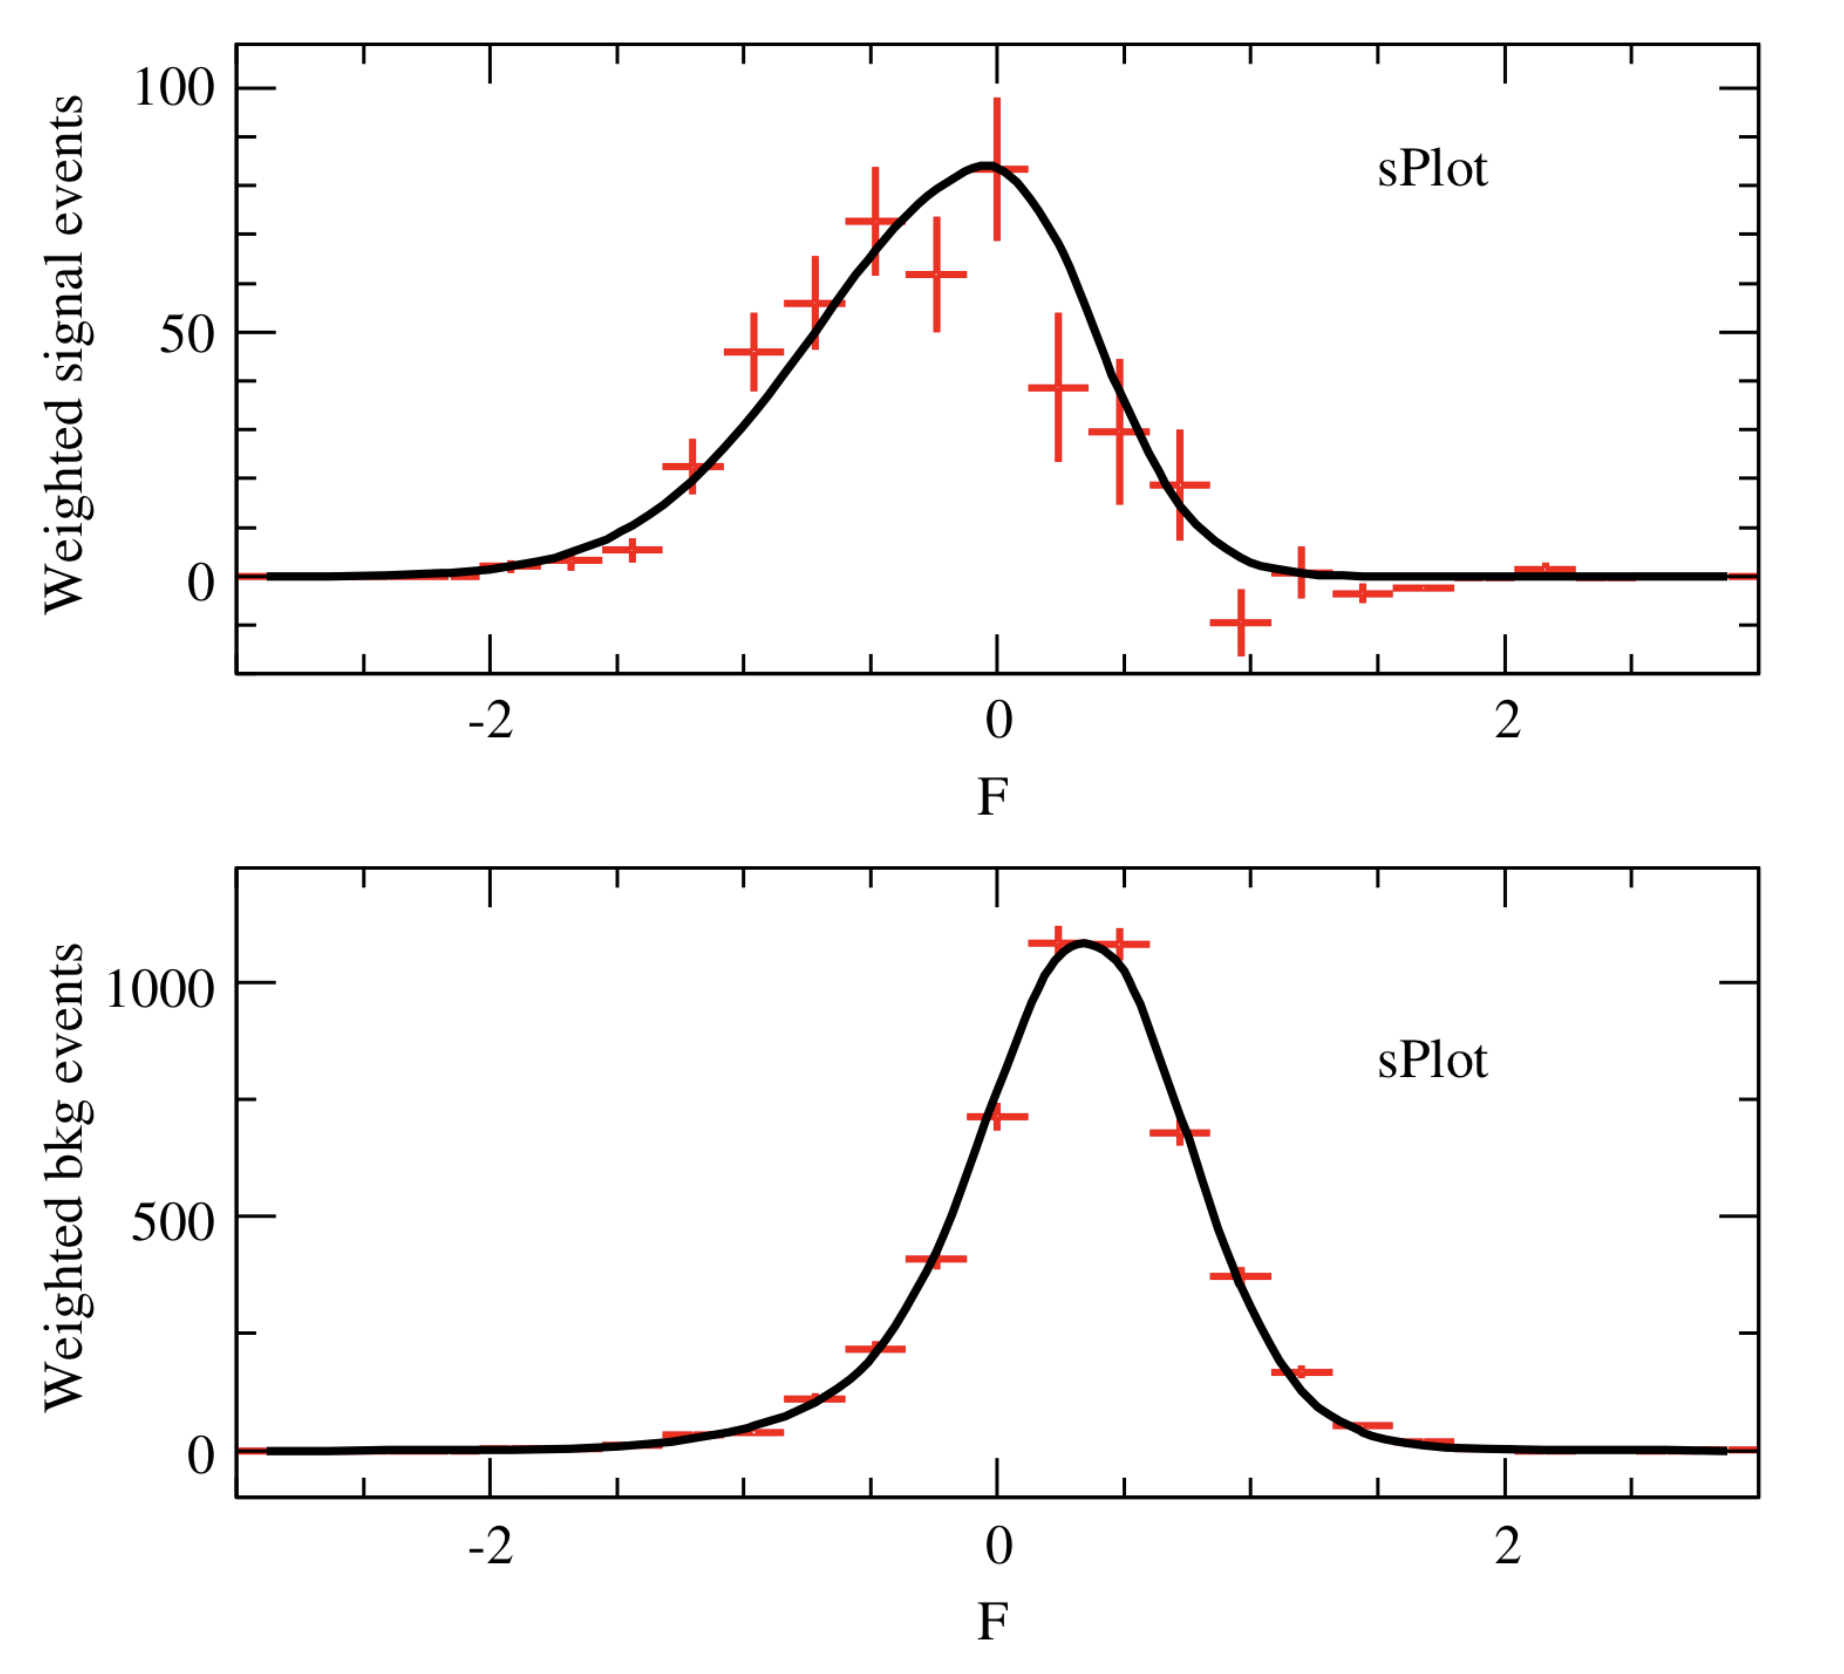
The \(\hbox {$_s$}{\cal P}lots\) (signal on top, background on bottom) obtained for \({\cal F}\) are represented as dots with error bars. They are obtained from a fit using only information from \({m_{\rm ES}}\) and \(\Delta E\)
The results above can be obtained by running the tutorial TestSPlot.C
Public Types | |
| enum | { kIsOnHeap = 0x01000000 , kNotDeleted = 0x02000000 , kZombie = 0x04000000 , kInconsistent = 0x08000000 , kBitMask = 0x00ffffff } |
| enum | { kSingleKey = (1ULL << ( 0 )) , kOverwrite = (1ULL << ( 1 )) , kWriteDelete = (1ULL << ( 2 )) } |
| enum | EDeprecatedStatusBits { kObjInCanvas = (1ULL << ( 3 )) } |
| enum | EStatusBits { kCanDelete = (1ULL << ( 0 )) , kMustCleanup = (1ULL << ( 3 )) , kIsReferenced = (1ULL << ( 4 )) , kHasUUID = (1ULL << ( 5 )) , kCannotPick = (1ULL << ( 6 )) , kNoContextMenu = (1ULL << ( 8 )) , kInvalidObject = (1ULL << ( 13 )) } |
Public Member Functions | |
| TSPlot () | |
| default constructor (used by I/O only) | |
| TSPlot (Int_t nx, Int_t ny, Int_t ne, Int_t ns, TTree *tree) | |
| Normal TSPlot constructor. | |
| ~TSPlot () override | |
| Destructor. | |
| void | AbstractMethod (const char *method) const |
| Call this function within a function that you don't want to define as purely virtual, in order not to force all users deriving from that class to implement that maybe (on their side) unused function; but at the same time, emit a run-time warning if they try to call it, telling that it is not implemented in the derived class: action must thus be taken on the user side to override it. | |
| virtual void | AppendPad (Option_t *option="") |
| Append graphics object to current pad. | |
| void | Browse (TBrowser *b) override |
| To browse the histograms. | |
| ULong_t | CheckedHash () |
| Check and record whether this class has a consistent Hash/RecursiveRemove setup (*) and then return the regular Hash value for this object. | |
| virtual const char * | ClassName () const |
| Returns name of class to which the object belongs. | |
| virtual void | Clear (Option_t *="") |
| virtual TObject * | Clone (const char *newname="") const |
| Make a clone of an object using the Streamer facility. | |
| virtual Int_t | Compare (const TObject *obj) const |
| Compare abstract method. | |
| virtual void | Copy (TObject &object) const |
| Copy this to obj. | |
| virtual void | Delete (Option_t *option="") |
| Delete this object. | |
| virtual Int_t | DistancetoPrimitive (Int_t px, Int_t py) |
| Computes distance from point (px,py) to the object. | |
| virtual void | Draw (Option_t *option="") |
| Default Draw method for all objects. | |
| virtual void | DrawClass () const |
| Draw class inheritance tree of the class to which this object belongs. | |
| virtual TObject * | DrawClone (Option_t *option="") const |
Draw a clone of this object in the current selected pad with: gROOT->SetSelectedPad(c1). | |
| virtual void | Dump () const |
| Dump contents of object on stdout. | |
| virtual void | Error (const char *method, const char *msgfmt,...) const |
| Issue error message. | |
| virtual void | Execute (const char *method, const char *params, Int_t *error=nullptr) |
| Execute method on this object with the given parameter string, e.g. | |
| virtual void | Execute (TMethod *method, TObjArray *params, Int_t *error=nullptr) |
| Execute method on this object with parameters stored in the TObjArray. | |
| virtual void | ExecuteEvent (Int_t event, Int_t px, Int_t py) |
| Execute action corresponding to an event at (px,py). | |
| virtual void | Fatal (const char *method, const char *msgfmt,...) const |
| Issue fatal error message. | |
| void | FillSWeightsHists (Int_t nbins=50) |
| The order of histograms in the array: | |
| void | FillXvarHists (Int_t nbins=100) |
| Fills the histograms of x variables (not weighted) with nbins. | |
| void | FillYpdfHists (Int_t nbins=100) |
| Fills the histograms of pdf-s of y variables with binning nbins. | |
| void | FillYvarHists (Int_t nbins=100) |
| Fill the histograms of y variables. | |
| virtual TObject * | FindObject (const char *name) const |
| Must be redefined in derived classes. | |
| virtual TObject * | FindObject (const TObject *obj) const |
| Must be redefined in derived classes. | |
| virtual Option_t * | GetDrawOption () const |
| Get option used by the graphics system to draw this object. | |
| virtual const char * | GetIconName () const |
| Returns mime type name of object. | |
| virtual const char * | GetName () const |
| Returns name of object. | |
| Int_t | GetNevents () |
| Int_t | GetNspecies () |
| virtual char * | GetObjectInfo (Int_t px, Int_t py) const |
| Returns string containing info about the object at position (px,py). | |
| virtual Option_t * | GetOption () const |
| void | GetSWeights (Double_t *weights) |
| Returns the matrix of sweights. | |
| void | GetSWeights (TMatrixD &weights) |
| Returns the matrix of sweights. | |
| TH1D * | GetSWeightsHist (Int_t ixvar, Int_t ispecies, Int_t iyexcl=-1) |
| Returns the histogram of a variable, weighted with sWeights. | |
| TObjArray * | GetSWeightsHists () |
| Returns an array of all histograms of variables, weighted with sWeights. | |
| virtual const char * | GetTitle () const |
| Returns title of object. | |
| TString * | GetTreeExpression () |
| TString * | GetTreeName () |
| TString * | GetTreeSelection () |
| virtual UInt_t | GetUniqueID () const |
| Return the unique object id. | |
| TH1D * | GetXvarHist (Int_t ixvar) |
| Returns the histogram of variable ixvar. | |
| TObjArray * | GetXvarHists () |
| Returns the array of histograms of x variables (not weighted). | |
| TH1D * | GetYpdfHist (Int_t iyvar, Int_t ispecies) |
Returns the histogram of the pdf of variable iyvar for species #ispecies, binning nbins. | |
| TObjArray * | GetYpdfHists () |
| Returns the array of histograms of pdf's of y variables with binning nbins. | |
| TH1D * | GetYvarHist (Int_t iyvar) |
| Returns the histogram of variable iyvar.If histograms have not already been filled, they are filled with default binning 100. | |
| TObjArray * | GetYvarHists () |
| Returns the array of histograms of y variables. | |
| virtual Bool_t | HandleTimer (TTimer *timer) |
| Execute action in response of a timer timing out. | |
| virtual ULong_t | Hash () const |
| Return hash value for this object. | |
| Bool_t | HasInconsistentHash () const |
| Return true is the type of this object is known to have an inconsistent setup for Hash and RecursiveRemove (i.e. | |
| virtual void | Info (const char *method, const char *msgfmt,...) const |
| Issue info message. | |
| virtual Bool_t | InheritsFrom (const char *classname) const |
| Returns kTRUE if object inherits from class "classname". | |
| virtual Bool_t | InheritsFrom (const TClass *cl) const |
| Returns kTRUE if object inherits from TClass cl. | |
| virtual void | Inspect () const |
| Dump contents of this object in a graphics canvas. | |
| void | InvertBit (UInt_t f) |
| TClass * | IsA () const override |
| Bool_t | IsDestructed () const |
| IsDestructed. | |
| virtual Bool_t | IsEqual (const TObject *obj) const |
| Default equal comparison (objects are equal if they have the same address in memory). | |
| Bool_t | IsFolder () const override |
| Returns kTRUE in case object contains browsable objects (like containers or lists of other objects). | |
| R__ALWAYS_INLINE Bool_t | IsOnHeap () const |
| virtual Bool_t | IsSortable () const |
| R__ALWAYS_INLINE Bool_t | IsZombie () const |
| virtual void | ls (Option_t *option="") const |
| The ls function lists the contents of a class on stdout. | |
| void | MakeSPlot (Option_t *option="v") |
| Calculates the sWeights. | |
| void | MayNotUse (const char *method) const |
| Use this method to signal that a method (defined in a base class) may not be called in a derived class (in principle against good design since a child class should not provide less functionality than its parent, however, sometimes it is necessary). | |
| virtual Bool_t | Notify () |
| This method must be overridden to handle object notification (the base implementation is no-op). | |
| void | Obsolete (const char *method, const char *asOfVers, const char *removedFromVers) const |
| Use this method to declare a method obsolete. | |
| void | operator delete (void *, size_t) |
| Operator delete for sized deallocation. | |
| void | operator delete (void *ptr) |
| Operator delete. | |
| void | operator delete (void *ptr, void *vp) |
| Only called by placement new when throwing an exception. | |
| void | operator delete[] (void *, size_t) |
| Operator delete [] for sized deallocation. | |
| void | operator delete[] (void *ptr) |
| Operator delete []. | |
| void | operator delete[] (void *ptr, void *vp) |
| Only called by placement new[] when throwing an exception. | |
| void * | operator new (size_t sz) |
| void * | operator new (size_t sz, void *vp) |
| void * | operator new[] (size_t sz) |
| void * | operator new[] (size_t sz, void *vp) |
| virtual void | Paint (Option_t *option="") |
| This method must be overridden if a class wants to paint itself. | |
| virtual void | Pop () |
| Pop on object drawn in a pad to the top of the display list. | |
| virtual void | Print (Option_t *option="") const |
| This method must be overridden when a class wants to print itself. | |
| virtual Int_t | Read (const char *name) |
| Read contents of object with specified name from the current directory. | |
| virtual void | RecursiveRemove (TObject *obj) |
| Recursively remove this object from a list. | |
| void | RefillHist (Int_t type, Int_t var, Int_t nbins, Double_t min, Double_t max, Int_t nspecies=-1) |
| The Fill...Hist() methods fill the histograms with the real limits on the variables This method allows to refill the specified histogram with user-set boundaries min and max. | |
| void | ResetBit (UInt_t f) |
| virtual void | SaveAs (const char *filename="", Option_t *option="") const |
| Save this object in the file specified by filename. | |
| virtual void | SavePrimitive (std::ostream &out, Option_t *option="") |
| Save a primitive as a C++ statement(s) on output stream "out". | |
| void | SetBit (UInt_t f) |
| void | SetBit (UInt_t f, Bool_t set) |
| Set or unset the user status bits as specified in f. | |
| virtual void | SetDrawOption (Option_t *option="") |
| Set drawing option for object. | |
| void | SetInitialNumbersOfSpecies (Int_t *numbers) |
| Set the initial number of events of each species - used as initial estimates in minuit. | |
| void | SetNEvents (Int_t ne) |
| void | SetNSpecies (Int_t ns) |
| void | SetNX (Int_t nx) |
| void | SetNY (Int_t ny) |
| void | SetTree (TTree *tree) |
| Set the input Tree. | |
| void | SetTreeSelection (const char *varexp="", const char *selection="", Long64_t firstentry=0) |
| Specifies the variables from the tree to be used for splot. | |
| virtual void | SetUniqueID (UInt_t uid) |
| Set the unique object id. | |
| void | Streamer (TBuffer &) override |
| Stream an object of class TObject. | |
| void | StreamerNVirtual (TBuffer &ClassDef_StreamerNVirtual_b) |
| virtual void | SysError (const char *method, const char *msgfmt,...) const |
| Issue system error message. | |
| R__ALWAYS_INLINE Bool_t | TestBit (UInt_t f) const |
| Int_t | TestBits (UInt_t f) const |
| virtual void | UseCurrentStyle () |
| Set current style settings in this object This function is called when either TCanvas::UseCurrentStyle or TROOT::ForceStyle have been invoked. | |
| virtual void | Warning (const char *method, const char *msgfmt,...) const |
| Issue warning message. | |
| virtual Int_t | Write (const char *name=nullptr, Int_t option=0, Int_t bufsize=0) |
| Write this object to the current directory. | |
| virtual Int_t | Write (const char *name=nullptr, Int_t option=0, Int_t bufsize=0) const |
| Write this object to the current directory. | |
Static Public Member Functions | |
| static TClass * | Class () |
| static const char * | Class_Name () |
| static constexpr Version_t | Class_Version () |
| static const char * | DeclFileName () |
| static Longptr_t | GetDtorOnly () |
| Return destructor only flag. | |
| static Bool_t | GetObjectStat () |
| Get status of object stat flag. | |
| static void | SetDtorOnly (void *obj) |
| Set destructor only flag. | |
| static void | SetObjectStat (Bool_t stat) |
| Turn on/off tracking of objects in the TObjectTable. | |
Protected Types | |
| enum | { kOnlyPrepStep = (1ULL << ( 3 )) } |
Protected Member Functions | |
| virtual void | DoError (int level, const char *location, const char *fmt, va_list va) const |
| Interface to ErrorHandler (protected). | |
| void | MakeZombie () |
| void | SPlots (Double_t *covmat, Int_t i_excl) |
| Computes the sWeights from the covariance matrix. | |
Static Protected Member Functions | |
| static void | SavePrimitiveConstructor (std::ostream &out, TClass *cl, const char *variable_name, const char *constructor_agrs="", Bool_t empty_line=kTRUE) |
| Save object constructor in the output stream "out". | |
| static void | SavePrimitiveDraw (std::ostream &out, const char *variable_name, Option_t *option=nullptr) |
| Save invocation of primitive Draw() method Skipped if option contains "nodraw" string. | |
| static TString | SavePrimitiveVector (std::ostream &out, const char *prefix, Int_t len, Double_t *arr, Int_t flag=0) |
| Save array in the output stream "out" as vector. | |
Protected Attributes | |
| TMatrixD | fMinmax |
| Int_t | fNevents |
| Int_t | fNSpecies |
| Double_t * | fNumbersOfEvents |
| Int_t | fNx |
| Int_t | fNy |
| TMatrixD | fPdfTot |
| ! | |
| TString * | fSelection = nullptr |
| TMatrixD | fSWeights |
| TObjArray | fSWeightsHists |
| TTree * | fTree = nullptr |
| ! | |
| TString * | fTreename = nullptr |
| TString * | fVarexp = nullptr |
| TMatrixD | fXvar |
| ! | |
| TObjArray | fXvarHists |
| TMatrixD | fYpdf |
| ! | |
| TObjArray | fYpdfHists |
| TMatrixD | fYvar |
| ! | |
| TObjArray | fYvarHists |
Static Private Member Functions | |
| static void | AddToTObjectTable (TObject *) |
| Private helper function which will dispatch to TObjectTable::AddObj. | |
Private Attributes | |
| UInt_t | fBits |
| bit field status word | |
| UInt_t | fUniqueID |
| object unique identifier | |
Static Private Attributes | |
| static Longptr_t | fgDtorOnly = 0 |
| object for which to call dtor only (i.e. no delete) | |
| static Bool_t | fgObjectStat = kTRUE |
| if true keep track of objects in TObjectTable | |
#include <TSPlot.h>
| Enumerator | |
|---|---|
| kOnlyPrepStep | Used to request that the class specific implementation of This is just for example by TBufferMerger to request that the TTree inside the file calls |
|
inherited |
|
inherited |
| Enumerator | |
|---|---|
| kCanDelete | if object in a list can be deleted |
| kMustCleanup | if object destructor must call RecursiveRemove() |
| kIsReferenced | |
| kHasUUID | if object has a TUUID (its fUniqueID=UUIDNumber) |
| kCannotPick | if object in a pad cannot be picked |
| kNoContextMenu | if object does not want context menu |
| kInvalidObject | if object ctor succeeded but object should not be used |
| TSPlot::TSPlot | ( | ) |
default constructor (used by I/O only)
Definition at line 291 of file TSPlot.cxx.
Normal TSPlot constructor.
Definition at line 308 of file TSPlot.cxx.
|
override |
Destructor.
Definition at line 326 of file TSPlot.cxx.
|
inherited |
Call this function within a function that you don't want to define as purely virtual, in order not to force all users deriving from that class to implement that maybe (on their side) unused function; but at the same time, emit a run-time warning if they try to call it, telling that it is not implemented in the derived class: action must thus be taken on the user side to override it.
In other word, this method acts as a "runtime purely virtual" warning instead of a "compiler purely virtual" error.
Definition at line 1149 of file TObject.cxx.
|
staticprivateinherited |
Private helper function which will dispatch to TObjectTable::AddObj.
Included here to avoid circular dependency between header files.
Definition at line 195 of file TObject.cxx.
|
virtualinherited |
Append graphics object to current pad.
In case no current pad is set yet, create a default canvas with the name "c1".
Definition at line 204 of file TObject.cxx.
|
overridevirtual |
|
inlineinherited |
Check and record whether this class has a consistent Hash/RecursiveRemove setup (*) and then return the regular Hash value for this object.
The intent is for this routine to be called instead of directly calling the function Hash during "insert" operations. See TObject::HasInconsistenTObjectHash();
(*) The setup is consistent when all classes in the class hierarchy that overload TObject::Hash do call ROOT::CallRecursiveRemoveIfNeeded in their destructor. i.e. it is safe to call the Hash virtual function during the RecursiveRemove operation.
|
virtualinherited |
Returns name of class to which the object belongs.
Definition at line 227 of file TObject.cxx.
Reimplemented in TMVA::ResultsClassification, TMVA::ResultsMulticlass, TMVA::ResultsRegression, TMVA::ResultsClassification, TMVA::ResultsMulticlass, TMVA::ResultsRegression, TMrbSubevent_Caen, TNotifyLinkBase, TRefTable, ROOT::TSchemaRule, TGTextEdit, TGTextView, TGView, TGHtml, TStreamerInfo, TMatrixT< Element >, TMatrixT< AReal >, TMatrixT< Double_t >, TMatrixTSparse< Element >, TMatrixTSparse< Double_t >, TMatrixTSym< Element >, TMatrixTSym< Double_t >, TVectorT< Element >, TVectorT< Double_t >, TVirtualStreamerInfo, TMVA::MinuitWrapper, RooLinkedList, TUsrHitBuffer, TFumili, TListOfEnums, TListOfEnumsWithLock, TDirectory, TFolder, TNamed, TProcessID, TTask, TBits, TBtree, TClonesArray, THashList, THashTable, TList, TMap, TObjArray, TOrdCollection, TRefArray, TDictAttributeMap, TListOfDataMembers, TListOfFunctions, TListOfFunctionTemplates, TViewPubDataMembers, TViewPubFunctions, TGeoRotation, TGeoCombiTrans, TGeoGenTrans, TGeoHMatrix, TCanvas, TPad, TLegend, TPaveText, TGTextEntry, TBackCompFitter, TFormula, TGraph2D, TMultiDimFit, TPrincipal, ROOT::v5::TFormula, TFitter, TLinearFitter, TBranchRef, TEventList, JetEvent, TVirtualPad, TCollection, TVirtualFitter, TMatrixTBase< Element >, TMatrixTBase< AReal >, and TMatrixTBase< Double_t >.
Make a clone of an object using the Streamer facility.
If the object derives from TNamed, this function is called by TNamed::Clone. TNamed::Clone uses the optional argument to set a new name to the newly created object.
If the object class has a DirectoryAutoAdd function, it will be called at the end of the function with the parameter gDirectory. This usually means that the object will be appended to the current ROOT directory.
Reimplemented in TMVA::MinuitWrapper, RooCatType, TImage, RooStudyPackage, RooLinkedList, RooStats::ModelConfig, TNamed, TCollection, TClass, TFunction, TFunctionTemplate, TMethod, TMethodCall, TASImage, TH1, TStreamerInfo, TMinuit, RooAbsStudy, RooDataHist, RooDataSet, RooWorkspace, TChainIndex, TTreeIndex, TF1, RooAbsArg, RooAbsBinning, RooAbsCollection, RooCmdArg, RooFitResult, RooTemplateProxy< T >, RooTemplateProxy< const RooHistFunc >, RooTemplateProxy< RooAbsCategory >, RooTemplateProxy< RooAbsPdf >, RooTemplateProxy< RooAbsReal >, RooTemplateProxy< RooAbsRealLValue >, RooTemplateProxy< RooMultiCategory >, RooTemplateProxy< RooRealVar >, and RooStats::HypoTestResult.
Definition at line 243 of file TObject.cxx.
Compare abstract method.
Must be overridden if a class wants to be able to compare itself with other objects. Must return -1 if this is smaller than obj, 0 if objects are equal and 1 if this is larger than obj.
Reimplemented in TEnvRec, TFileInfo, TNamed, TObjString, TParameter< AParamType >, TParameter< Long64_t >, TUrl, TCollection, TGeoBranchArray, TGeoOverlap, TStructNode, TStructNodeProperty, TGFSFrameElement, TGLBFrameElement, RooAbsArg, and RooDouble.
Definition at line 258 of file TObject.cxx.
|
virtualinherited |
Copy this to obj.
Reimplemented in TDirectory, TFolder, TSystemDirectory, TSystemFile, TGTextEdit, TGTextView, TDirectoryFile, TFile, TArc, TArrow, TAxis, TBox, TColor, TCrown, TEllipse, TF1, TFormula, TF12, TF2, TF3, ROOT::v5::TFormula, TFrame, TAxis3D, TH1, TH1C, TH1S, TH1I, TH1L, TH1F, TH1D, TH2, TH2C, TH2S, TH2I, TH2L, TH2F, TH2D, TH3, TH3C, TH3S, TH3I, TH3L, TH3F, TH3D, TProfile, TProfile2D, TProfile3D, TLine, TMarker, TNamed, TH2Poly, TLegend, TLegendEntry, TF1Convolution, TF1NormSum, TF1AbsComposition, TPaletteAxis, TPave, TPaveLabel, TPaveClass, TPolyLine, TPolyLine3D, TPolyMarker3D, TPolyMarker, TPieSlice, TStyle, TLatex, TMathText, TText, and TWbox.
Definition at line 159 of file TObject.cxx.
|
virtualinherited |
Delete this object.
Typically called as a command via the interpreter. Normally use "delete" operator when object has been allocated on the heap.
Reimplemented in TDirectory, TDirectoryFile, TFile, TSystemDirectory, TSystemFile, TTreeViewer, TGItemContext, TCanvas, TGFrame, TGTextEdit, TAxis, RooLinkedList, TExMap, TObjectTable, TProtoClass, TKeySQL, TKeyXML, TQCommand, TBtree, TClonesArray, THashList, THashTable, TList, TMap, TObjArray, TOrdCollection, TRefArray, TListOfDataMembers, TListOfEnums, TListOfEnumsWithLock, TListOfFunctions, TListOfFunctionTemplates, TViewPubDataMembers, TViewPubFunctions, TThread, TKey, TMVA::Results, TTree, and TCollection.
Definition at line 268 of file TObject.cxx.
Computes distance from point (px,py) to the object.
This member function must be implemented for each graphics primitive. This default function returns a big number (999999).
Reimplemented in TGeoTessellated, TStyle, TGeoBBox, TGeoCompositeShape, TGeoCone, TGeoConeSeg, TGeoEltu, TGeoHalfSpace, TGeoHype, TGeoNode, TGeoParaboloid, TGeoPcon, TGeoPgon, TGeoScaledShape, TGeoShapeAssembly, TGeoSphere, TGeoTorus, TGeoTube, TGeoTubeSeg, TGeoVolume, TGeoXtru, TGeoOverlap, TGeoTrack, TGeoVGShape, TASImage, TColorWheel, TPad, TBox, TCrown, TCurlyArc, TCurlyLine, TDiamond, TEllipse, TGraphPolargram, TLine, TMarker, TPave, TPie, TPolyLine, TText, TGraphEdge, TGraphNode, TAxis3D, TMarker3DBox, TPolyLine3D, TPolyMarker3D, TGL5DDataSet, TGLHistPainter, TGLParametricEquation, TGLTH3Composition, TGLViewer, TAxis, TEfficiency, TF1, TF2, TF3, TGraph, TGraph2D, TH1, THStack, TMultiGraph, TPolyMarker, TScatter, TScatter2D, TSpline, THistPainter, TPaletteAxis, TGenerator, TParticle, TPrimary, TFileDrawMap, TTreePerfStats, TParallelCoord, TParallelCoordRange, TParallelCoordVar, TSpider, TGeoShape, TPoints3DABC, TVirtualHistPainter, TPieSlice, and TGLScenePad.
Definition at line 284 of file TObject.cxx.
|
protectedvirtualinherited |
Interface to ErrorHandler (protected).
Reimplemented in TTreeViewer, and TThread.
Definition at line 1059 of file TObject.cxx.
|
virtualinherited |
Default Draw method for all objects.
Reimplemented in TClassTree, ROOT::RGeoPainter, TGListTree, TGPicture, TMultiDimFit, TRatioPlot, TGraph, TGraphTime, THStack, TMultiGraph, TChain, TTree, TFITSHDU, TEfficiency, RooStats::HypoTestInverterPlot, ROOT::Experimental::XRooFit::xRooNLLVar::xRooHypoPoint, ROOT::Experimental::XRooFit::xRooNLLVar::xRooHypoSpace, ROOT::Experimental::XRooFit::xRooNode, TGeoParallelWorld, TDirectory, TCollection, TBrowser, TClass, TGeoBatemanSol, TGeoNode, TGeoPhysicalNode, TGeoPolygon, TGeoShape, TGeoVolume, TGeoOverlap, TGeoPainter, TGeoTrack, TGeoVGShape, TASImage, TButton, TCanvas, TColorWheel, TPad, TArrow, TBox, TDiamond, TEllipse, TFrame, TLegend, TMarker, TPave, TPaveLabel, TPavesText, TPaveText, TPolyLine, TWbox, TGraphStruct, TEveGeoNode, TEveGeoTopNode, TPolyLine3D, TPolyMarker3D, TStructViewer, TStructViewerGUI, TF1, TF2, TF3, TH1, TPolyMarker, TSpline, TFile, TMatrixTBase< Element >, TMatrixTBase< AReal >, TMatrixTBase< Double_t >, TVectorT< Element >, TVectorT< Double_t >, TMultiLayerPerceptron, TGenerator, RooAbsData, TTreePerfStats, TParallelCoordVar, TGItemContext, TVirtualPad, TPie, TGraph2D, TGraphPolar, TGraphPolargram, TParallelCoord, TParallelCoordRange, TSpider, RooPlot, and RooStats::SamplingDistPlot.
Definition at line 293 of file TObject.cxx.
|
virtualinherited |
Draw class inheritance tree of the class to which this object belongs.
If a class B inherits from a class A, description of B is drawn on the right side of description of A. Member functions overridden by B are shown in class A with a blue line crossing-out the corresponding member function. The following picture is the class inheritance tree of class TPaveLabel:
Reimplemented in TSystemDirectory, TSystemFile, and TGFrame.
Definition at line 308 of file TObject.cxx.
Draw a clone of this object in the current selected pad with: gROOT->SetSelectedPad(c1).
If pad was not selected - gPad will be used.
Reimplemented in TSystemDirectory, TSystemFile, TGFrame, TAxis, and TCanvas.
Definition at line 319 of file TObject.cxx.
|
virtualinherited |
Dump contents of object on stdout.
Using the information in the object dictionary (class TClass) each data member is interpreted. If a data member is a pointer, the pointer value is printed
The following output is the Dump of a TArrow object:
Reimplemented in TSystemFile, TCollection, TClass, TGFrame, and TGPack.
Definition at line 367 of file TObject.cxx.
Issue error message.
Use "location" to specify the method where the error occurred. Accepts standard printf formatting arguments.
Reimplemented in TFitResult.
Definition at line 1098 of file TObject.cxx.
|
virtualinherited |
Execute method on this object with the given parameter string, e.g.
"3.14,1,\"text\"".
Reimplemented in TMethodCall, TCling, TInterpreter, and TContextMenu.
Definition at line 378 of file TObject.cxx.
|
virtualinherited |
Execute method on this object with parameters stored in the TObjArray.
The TObjArray should contain an argv vector like:
Reimplemented in TCling, TMethodCall, TInterpreter, and TContextMenu.
Definition at line 398 of file TObject.cxx.
Execute action corresponding to an event at (px,py).
This method must be overridden if an object can react to graphics events.
Reimplemented in TParallelCoord, TParallelCoordRange, TParallelCoordVar, TGeoManager, TGeoNode, TGeoShape, TGeoVolume, TGeoOverlap, TGeoTrack, TASImage, TASPaletteEditor::LimitLine, TButton, TCanvas, TGroupButton, TPad, TSliderBox, TBox, TCrown, TCurlyArc, TCurlyLine, TDiamond, TEllipse, TFrame, TGraphPolargram, TLine, TLink, TMarker, TPave, TPolyLine, TText, TWbox, TGraphEdge, TGraphNode, TAxis3D, TMarker3DBox, TPolyLine3D, TPolyMarker3D, TView3D, TGL5DDataSet, TGLEventHandler, TGLHistPainter, TGLParametricEquation, TGLTH3Composition, TGLViewer, TAxis, TEfficiency, TF1, TF2, TF3, TGraph, TGraph2D, TH1, TPolyMarker, TScatter, TScatter2D, TSpline, THistPainter, TPaletteAxis, TGenerator, TParticle, TPrimary, TTreePerfStats, TSpider, TView, TVirtualHistPainter, TPie, and TGLScenePad.
Definition at line 415 of file TObject.cxx.
Issue fatal error message.
Use "location" to specify the method where the fatal error occurred. Accepts standard printf formatting arguments.
Definition at line 1126 of file TObject.cxx.
| void TSPlot::FillSWeightsHists | ( | Int_t | nbins = 50 | ) |
The order of histograms in the array:
x0_species0, x0_species1,..., x1_species0, x1_species1,..., y0_species0, y0_species1,...
If the histograms have already been filled with a different binning, they are refilled and all histograms are deleted
Definition at line 684 of file TSPlot.cxx.
| void TSPlot::FillXvarHists | ( | Int_t | nbins = 100 | ) |
Fills the histograms of x variables (not weighted) with nbins.
Definition at line 515 of file TSPlot.cxx.
| void TSPlot::FillYpdfHists | ( | Int_t | nbins = 100 | ) |
Fills the histograms of pdf-s of y variables with binning nbins.
Definition at line 623 of file TSPlot.cxx.
| void TSPlot::FillYvarHists | ( | Int_t | nbins = 100 | ) |
Fill the histograms of y variables.
Definition at line 571 of file TSPlot.cxx.
Must be redefined in derived classes.
This function is typically used with TCollections, but can also be used to find an object by name inside this object.
Reimplemented in TListOfEnums, TMap, TDirectory, TFolder, TROOT, TListOfTypes, TListOfTypes, TBtree, TCollection, THashList, THashTable, TList, TObjArray, TListOfDataMembers, TListOfDataMembers, TListOfEnums, TListOfEnumsWithLock, TListOfFunctions, TListOfFunctionTemplates, TListOfFunctionTemplates, TViewPubDataMembers, TViewPubFunctions, TPad, THbookFile, TGraph, TGraph2D, TH1, RooAbsCollection, and RooLinkedList.
Definition at line 425 of file TObject.cxx.
Must be redefined in derived classes.
This function is typically used with TCollections, but can also be used to find an object inside this object.
Reimplemented in TMap, TDirectory, TFolder, TROOT, TListOfTypes, TBtree, TCollection, THashList, THashTable, TList, TObjArray, TListOfDataMembers, TListOfEnums, TListOfEnumsWithLock, TListOfFunctions, TListOfFunctionTemplates, TViewPubDataMembers, TViewPubFunctions, TPad, THbookFile, TGraph, TGraph2D, TH1, RooAbsCollection, and RooLinkedList.
Definition at line 435 of file TObject.cxx.
|
virtualinherited |
Get option used by the graphics system to draw this object.
Note that before calling object.GetDrawOption(), you must have called object.Draw(..) before in the current pad.
Reimplemented in TBrowser, TFitEditor, TGedFrame, TGFileBrowser, TRootBrowser, and TRootBrowserLite.
Definition at line 445 of file TObject.cxx.
|
staticinherited |
Return destructor only flag.
Definition at line 1196 of file TObject.cxx.
|
virtualinherited |
Returns mime type name of object.
Used by the TBrowser (via TGMimeTypes class). Override for class of which you would like to have different icons for objects of the same class.
Reimplemented in TSystemFile, TGeoVolume, TASImage, TGMainFrame, TKey, ROOT::Experimental::XRooFit::xRooNode, TBranch, TVirtualBranchBrowsable, TMethodBrowsable, and TBranchElement.
Definition at line 472 of file TObject.cxx.
|
virtualinherited |
Returns name of object.
This default method returns the class name. Classes that give objects a name should override this method.
Reimplemented in TSQLClassColumnInfo, TSQLClassInfo, TSQLColumnData, TEnvRec, TNamed, TObjString, TParameter< AParamType >, TParameter< Long64_t >, TQCommand, TQConnection, TQSlot, TCollection, TPair, TRealData, TGeoDecayChannel, TGeoShape, TVirtualGeoTrack, TGeoVGShape, TPad, TGaxis, TPave, TEveGeoNode, TPolyMarker3D, TGLEmbeddedViewer, TGLPShapeObj, TGLSAViewer, TStructNode, TGMenuEntry, TGMenuTitle, TGPicture, TGWindow, TIconBoxThumb, TArchiveMember, TMapFile, TXMLAttr, TStatistic, TParticle, TPrimary, RooAbsCollection, RooCatType, RooLinkedList, TMVA::DataSetInfo, TMVA::FitterBase, TMVA::MethodBase, TMVA::OptionBase, TMVA::PDF, TMVA::Reader, TMVA::VariableTransformBase, TTreePerfStats, TTVRecord, TTVSession, and TVirtualPad.
Definition at line 462 of file TObject.cxx.
Returns string containing info about the object at position (px,py).
This method is typically overridden by classes of which the objects can report peculiarities for different positions. Returned string will be re-used (lock in MT environment).
Reimplemented in TGeoNode, TGeoVolume, TGeoTrack, TASImage, TColorWheel, TAxis3D, TGL5DDataSet, TGLHistPainter, TGLParametricEquation, TGLTH3Composition, TF1, TF2, TGraph, TH1, THistPainter, TPaletteAxis, TFileDrawMap, TParallelCoordVar, and TVirtualHistPainter.
Definition at line 491 of file TObject.cxx.
|
staticinherited |
Get status of object stat flag.
Definition at line 1181 of file TObject.cxx.
Reimplemented in TGeoVolume, TArrow, TGaxis, TLegendEntry, TPave, TPolyLine, TAxis3D, TPolyLine3D, TPolyMarker3D, TH1, TPolyMarker, TFile, TMapFile, TPSocket, TSocket, TUDPSocket, TSelector, and TPoints3DABC.
| void TSPlot::GetSWeights | ( | Double_t * | weights | ) |
Returns the matrix of sweights.
It is assumed that the array passed in the argurment is big enough
Definition at line 503 of file TSPlot.cxx.
| void TSPlot::GetSWeights | ( | TMatrixD & | weights | ) |
Returns the matrix of sweights.
Definition at line 492 of file TSPlot.cxx.
Returns the histogram of a variable, weighted with sWeights.
Definition at line 820 of file TSPlot.cxx.
| TObjArray * TSPlot::GetSWeightsHists | ( | ) |
Returns an array of all histograms of variables, weighted with sWeights.
If histograms have not been already filled, they are filled with default binning 50 The order of histograms in the array:
x0_species0, x0_species1,..., x1_species0, x1_species1,..., y0_species0, y0_species1,...
Definition at line 734 of file TSPlot.cxx.
|
virtualinherited |
Returns title of object.
This default method returns the class title (i.e. description). Classes that give objects a title should override this method.
Reimplemented in TNamed, TQCommand, TPair, TClassMenuItem, TBaseClass, TASImage, TPad, TGaxis, TPaveLabel, TEveGeoNode, TEvePointSet, TGTextButton, TGGroupFrame, TGLabel, TGTextLBEntry, TGLVEntry, TGTextEntry, TRootIconList, TAxis, TKey, TMapFile, TParticle, TPrimary, Axis2, TParallelCoordSelect, and TVirtualPad.
Definition at line 507 of file TObject.cxx.
|
virtualinherited |
Return the unique object id.
Definition at line 480 of file TObject.cxx.
Returns the histogram of variable ixvar.
If histograms have not already been filled, they are filled with default binning 100.
Definition at line 557 of file TSPlot.cxx.
| TObjArray * TSPlot::GetXvarHists | ( | ) |
Returns the array of histograms of x variables (not weighted).
If histograms have not already been filled, they are filled with default binning 100.
Definition at line 542 of file TSPlot.cxx.
Returns the histogram of the pdf of variable iyvar for species #ispecies, binning nbins.
If histograms have not already been filled, they are filled with default binning 100.
Definition at line 667 of file TSPlot.cxx.
| TObjArray * TSPlot::GetYpdfHists | ( | ) |
Returns the array of histograms of pdf's of y variables with binning nbins.
If histograms have not already been filled, they are filled with default binning 100.
Definition at line 653 of file TSPlot.cxx.
Returns the histogram of variable iyvar.If histograms have not already been filled, they are filled with default binning 100.
Definition at line 610 of file TSPlot.cxx.
| TObjArray * TSPlot::GetYvarHists | ( | ) |
Returns the array of histograms of y variables.
If histograms have not already been filled, they are filled with default binning 100.
Definition at line 596 of file TSPlot.cxx.
Execute action in response of a timer timing out.
This method must be overridden if an object has to react to timers.
Reimplemented in TGWindow, TGuiBldDragManager, TGraphTime, TGLEventHandler, TGCommandPlugin, TGDNDManager, TGFileContainer, TGPopupMenu, TGScrollBar, TGShutter, TGTextEdit, TGTextEditor, TGTextEntry, TGTextView, TGToolTip, TGHtml, and TTreeViewer.
Definition at line 516 of file TObject.cxx.
|
virtualinherited |
Return hash value for this object.
Note: If this routine is overloaded in a derived class, this derived class should also add
Otherwise, when RecursiveRemove is called (by ~TObject or example) for this type of object, the transversal of THashList and THashTable containers will will have to be done without call Hash (and hence be linear rather than logarithmic complexity). You will also see warnings like
Reimplemented in TEnvRec, TNamed, TObjString, TParameter< AParamType >, TParameter< Long64_t >, TCollection, TPair, TASImagePlugin, TASPluginGS, TPad, TImagePlugin, TPave, TGObject, TGPicture, TIconBoxThumb, TStatistic, and RooLinkedList.
Definition at line 539 of file TObject.cxx.
|
inlineinherited |
Return true is the type of this object is known to have an inconsistent setup for Hash and RecursiveRemove (i.e.
missing call to RecursiveRemove in destructor).
Note: Since the consistency is only tested for during inserts, this routine will return true for object that have never been inserted whether or not they have a consistent setup. This has no negative side-effect as searching for the object with the right or wrong Hash will always yield a not-found answer (Since anyway no hash can be guaranteed unique, there is always a check)
Issue info message.
Use "location" to specify the method where the warning occurred. Accepts standard printf formatting arguments.
Definition at line 1072 of file TObject.cxx.
Returns kTRUE if object inherits from class "classname".
Reimplemented in TClass.
Definition at line 549 of file TObject.cxx.
Returns kTRUE if object inherits from TClass cl.
Reimplemented in TClass.
Definition at line 557 of file TObject.cxx.
|
virtualinherited |
Dump contents of this object in a graphics canvas.
Same action as Dump but in a graphical form. In addition pointers to other objects can be followed.
The following picture is the Inspect of a histogram object:

Reimplemented in TSystemFile, TInspectorObject, TGFrame, and ROOT::Experimental::XRooFit::xRooNode.
Definition at line 570 of file TObject.cxx.
|
inlineoverridevirtual |
|
inlineinherited |
IsDestructed.
Default equal comparison (objects are equal if they have the same address in memory).
More complicated classes might want to override this function.
Reimplemented in TObjString, TQCommand, TPair, and TGObject.
Definition at line 589 of file TObject.cxx.
|
inlineoverridevirtual |
|
inlineinherited |
Reimplemented in TFileInfo, TNamed, TObjString, TParameter< AParamType >, TParameter< Long64_t >, TUri, TUrl, TCollection, TGeoBranchArray, TGeoOverlap, TPave, TStructNode, TStructNodeProperty, TGFSFrameElement, TGLBFrameElement, RooAbsArg, and RooDouble.
|
inlineinherited |
|
virtualinherited |
The ls function lists the contents of a class on stdout.
Ls output is typically much less verbose then Dump().
Reimplemented in THbookFile, ROOT::Experimental::XRooFit::xRooBrowser, TParameter< AParamType >, TParameter< Long64_t >, TFree, TVirtualStreamerInfo, TQSlot, TClass, TStatistic, TApplication, TColor, TDirectory, TFolder, TNamed, TQCommand, TQUndoManager, TQConnection, TROOT, TQConnectionList, TCollection, TFunction, ROOT::TSchemaRule, ROOT::Detail::TSchemaRuleSet, TStreamerElement, TStreamerBase, TStreamerSTL, TGeoNode, TAnnotation, TCanvas, TClassTree, TPad, TBox, TEllipse, TImage, TLine, TMarker, TPave, TPolyLine, TText, TPolyLine3D, TPolyMarker3D, TGLayoutHints, TGFrameElement, THStack, TPolyMarker, TDirectoryFile, TFile, TKey, TMapFile, TStreamerInfo, TChain, TChainElement, TFriendElement, TVirtualPad, and TTask.
Definition at line 598 of file TObject.cxx.
| void TSPlot::MakeSPlot | ( | Option_t * | option = "v" | ) |
Calculates the sWeights.
The option controls the print level
#of events in species - defaultDefinition at line 391 of file TSPlot.cxx.
|
inherited |
Use this method to signal that a method (defined in a base class) may not be called in a derived class (in principle against good design since a child class should not provide less functionality than its parent, however, sometimes it is necessary).
Definition at line 1160 of file TObject.cxx.
|
virtualinherited |
This method must be overridden to handle object notification (the base implementation is no-op).
Different objects in ROOT use the Notify method for different purposes, in coordination with other objects that call this method at the appropriate time.
For example, TLeaf uses it to load class information; TBranchRef to load contents of referenced branches TBranchRef; most notably, based on Notify, TChain implements a callback mechanism to inform interested parties when it switches to a new sub-tree.
Reimplemented in TMessageHandler, TNotifyLink< Type >, TNotifyLink< RNoCleanupNotifierHelper >, TNotifyLink< ROOT::Detail::TBranchProxy >, TNotifyLink< TTreeReader >, TFileHandler, TSignalHandler, TStdExceptionHandler, TProcessEventTimer, TTimer, TIdleTimer, TSingleShotCleaner, TCollection, TRefTable, TBrowserTimer, TInterruptHandler, TTermInputHandler, TThreadTimer, TGLRedrawTimer, TViewTimer, TGContainerKeyboardTimer, TGContainerScrollTimer, TGInputHandler, TViewUpdateTimer, TPopupDelayTimer, TRepeatTimer, TSBRepeatTimer, TGTextEditHist, TInsCharCom, TDelCharCom, TBreakLineCom, TInsTextCom, TDelTextCom, TBlinkTimer, TTipDelayTimer, TGuiBldDragManagerRepeatTimer, TARInterruptHandler, TASLogHandler, TASInterruptHandler, TASSigPipeHandler, TASInputHandler, TSocketHandler, TTimeOutTimer, TBranchElement, TBranchRef, TLeafObject, TSelector, TTree, TSelectorDraw, TSelectorEntries, TTreeFormula, TTreeFormulaManager, TTreeReader, h1analysis, h1analysisTreeReader, and TSysEvtHandler.
Definition at line 618 of file TObject.cxx.
|
inherited |
Use this method to declare a method obsolete.
Specify as of which version the method is obsolete and as from which version it will be removed.
Definition at line 1169 of file TObject.cxx.
|
inherited |
Operator delete for sized deallocation.
Definition at line 1234 of file TObject.cxx.
|
inherited |
Operator delete.
Definition at line 1212 of file TObject.cxx.
|
inherited |
Only called by placement new when throwing an exception.
Definition at line 1266 of file TObject.cxx.
|
inherited |
Operator delete [] for sized deallocation.
Definition at line 1245 of file TObject.cxx.
|
inherited |
Operator delete [].
Definition at line 1223 of file TObject.cxx.
|
inherited |
Only called by placement new[] when throwing an exception.
Definition at line 1274 of file TObject.cxx.
|
inlineinherited |
|
inlineinherited |
|
inlineinherited |
|
virtualinherited |
This method must be overridden if a class wants to paint itself.
The difference between Paint() and Draw() is that when a object draws itself it is added to the display list of the pad in which it is drawn (and automatically redrawn whenever the pad is redrawn). While paint just draws the object without adding it to the pad display list.
Reimplemented in TPie, TSQLFile, TXMLFile, ROOT::RGeoPainter, TGaxis, TGraph, TGraphTime, THStack, TMultiGraph, TScatter, TScatter2D, TTreePerfStats, ROOT::Experimental::RTreeMapPainter, TEfficiency, TRatioPlot, TGeoBoolNode, TGeoUnion, TGeoIntersection, TGeoSubtraction, TMarker3DBox, TGL5DDataSet, TGLHistPainter, TGLParametricEquation, TGLTH3Composition, TGraph2DPainter, TSpectrum2Painter, TFileDrawMap, TDirectory, TExec, TMacro, TStyle, TBits, TCollection, TGeoNode, TGeoPhysicalNode, TGeoShape, TGeoVolume, TGeoOverlap, TGeoPainter, TGeoTrack, TGeoVGShape, TASImage, TASPaletteEditor::PaintPalette, TASPaletteEditor::LimitLine, TAnnotation, TButton, TCanvas, TClassTree, TColorWheel, TPad, TArrow, TBox, TCrown, TDiamond, TEllipse, TFrame, TLatex, TLegend, TLine, TMarker, TMathText, TPave, TPaveLabel, TPaveStats, TPavesText, TPaveText, TPolyLine, TText, TWbox, TGraphEdge, TGraphNode, TEveArrow, TEveCaloViz, TEveDigitSet, TEveGeoTopNode, TEveGeoShape, TEvePlot3D, TEvePointSet, TEveProjectionAxes, TEveScene, TEveShape, TEveStraightLineSet, TEveText, TEveTriangleSet, TAxis3D, TPolyLine3D, TPolyMarker3D, TF1, TF2, TF3, TGraph2D, TH1, TPolyMarker, TSpline, THistPainter, TPaletteAxis, TFile, TGenerator, TParticle, TPrimary, TParallelCoordVar, TVirtualPad, TVirtualGeoPainter, TVirtualGeoTrack, TVirtualHistPainter, TParallelCoordRange, TSpider, TGraphPolargram, and TParallelCoord.
Definition at line 631 of file TObject.cxx.
|
virtualinherited |
Pop on object drawn in a pad to the top of the display list.
I.e. it will be drawn last and on top of all other primitives.
Reimplemented in TPad, TFrame, and TVirtualPad.
Definition at line 640 of file TObject.cxx.
|
virtualinherited |
This method must be overridden when a class wants to print itself.
Reimplemented in RooCmdArg, TPad, TVirtualPad, RooLinkedList, TObjString, TParameter< AParamType >, TParameter< Long64_t >, TRootBrowserHistoryCursor, TRolke, TSQLFile, TXMLFile, TGTextEdit, TStreamerInfoActions::TActionSequence, TStatistic, TMVA::TNeuron, TBranchSTL, TGraph, TGraph2D, TGraph2DAsymmErrors, TGraph2DErrors, TGraphAsymmErrors, TGraphBentErrors, TGraphErrors, TGraphMultiErrors, THStack, TMultiGraph, TScatter, TScatter2D, TBenchmark, TMatrixTBase< Element >, TMatrixTBase< AReal >, TMatrixTBase< Double_t >, TGeoDecayChannel, TPluginHandler, TPluginManager, TQSlot, TDecompBase, TDecompBK, TDecompChol, TDecompLU, TDecompQRH, TDecompSparse, TDecompSVD, TQpDataDens, TQpDataSparse, TDatabasePDG, TParticleClassPDG, TParticlePDG, ROOT::Experimental::XRooFit::xRooNLLVar::xRooHypoPoint, ROOT::Experimental::XRooFit::xRooNLLVar::xRooHypoSpace, ROOT::Experimental::XRooFit::xRooNode, TPrincipal, TFoamCell, TFoamVect, TMVA::PDEFoamCell, TMVA::PDEFoamVect, TMVA::Event, TMVA::OptionBase, TMVA::Option< T >, TCling, TColor, TDirectory, TEnv, TFileCollection, TInetAddress, TMacro, TMessageHandler, TNamed, TStopwatch, TUri, TUrl, TBits, TClassTable, TCollection, THashTable, TObjectTable, TFunction, TGDMLMatrix, TGeoBranchArray, TGeoElement, TGeoIsotope, TGeoElementRN, TGeoBatemanSol, TGeoElementTable, TGeoMatrix, TGeoOpticalSurface, TGeoSkinSurface, TGeoBorderSurface, TGeoPhysicalNode, TGeoRegion, TGeoTessellated, TGeoVolume, TGeoVoxelFinder, TGeoOverlap, TGeoTrack, TAnnotation, TBox, TEllipse, TLegend, TLegendEntry, TLine, TMarker, TPave, TPaveText, TPolyLine, TText, TEveTrans, ROOT::Experimental::REveTrans, TPolyLine3D, TPolyMarker3D, TGFont, TGFontPool, TGFrame, TGCompositeFrame, TGGC, TGGCPool, TGLayoutHints, TGFrameElement, TGMimeTypes, TGPicture, TGPicturePool, TGWindow, THbookTree, TF1, TFitResult, TFormula, TH1, THnBase, TPolyMarker, ROOT::v5::TFormula, TSpectrum, TSpectrum2, TSpectrum3, TFile, TFileCacheRead, TFileCacheWrite, TKey, TMapFile, TMemFile, TZIPFile, TZIPMember, TSQLStructure, TVectorT< Element >, TVectorT< Double_t >, TLorentzVector, TQuaternion, TVector2, TVector3, TQpVar, TAttParticle, TParticle, TPrimary, TApplicationRemote, TSQLColumnInfo, TSQLTableInfo, RooStats::ModelConfig, TBranch, TBranchClones, TBranchElement, TBranchObject, TBranchRef, TChain, TEventList, TTree, TTreeCache, TTreeCacheUnzip, TTreeIndex, TTreePerfStats, TParallelCoordVar, TMultiDimFit, TParallelCoordRange, TFileInfo, TFileInfoMeta, Roo1DTable, RooAbsArg, RooAbsBinning, RooAbsCollection, RooAbsData, RooAbsDataStore, RooAbsGenContext, RooCurve, RooEllipse, RooCatType, RooFitResult, RooGenFitStudy, RooHist, RooMsgService, RooNumGenConfig, RooNumIntConfig, RooPlot, RooSharedProperties, and RooWorkspace.
Definition at line 661 of file TObject.cxx.
Read contents of object with specified name from the current directory.
First the key with the given name is searched in the current directory, next the key buffer is deserialized into the object. The object must have been created before via the default constructor. See TObject::Write().
Reimplemented in TKeyXML, TBuffer, TKey, and TKeySQL.
Definition at line 673 of file TObject.cxx.
|
virtualinherited |
Recursively remove this object from a list.
Typically implemented by classes that can contain multiple references to a same object.
Reimplemented in THistPainter, TCling, TDirectory, TFolder, TProcessID, TROOT, TCollection, THashList, TList, TObjArray, TBrowser, TObjectSpy, TObjectRefSpy, TListOfDataMembers, TListOfEnums, TListOfEnumsWithLock, TListOfFunctions, TListOfFunctionTemplates, ROOT::Internal::TCheckHashRecursiveRemoveConsistency, TViewPubDataMembers, TViewPubFunctions, TDialogCanvas, TInspectCanvas, TPad, TLegend, ROOT::RBrowserDataCleanup, TFitEditor, TGedEditor, TH1Editor, TH2Editor, TGFileBrowser, TRootBrowser, TRootBrowserLite, TRootContextMenu, TRootBrowserHistory, TEfficiency, TGraph, TGraph2D, TH1, THStack, TMultiGraph, TFileMerger, RooAbsCollection, RooAbsData, RooLinkedList, RooMCStudy, RooWorkspace, TChain, TFriendElement, TTree, TTreePlayer, and TVirtualPad.
Definition at line 684 of file TObject.cxx.
| void TSPlot::RefillHist | ( | Int_t | type, |
| Int_t | nvar, | ||
| Int_t | nbins, | ||
| Double_t | min, | ||
| Double_t | max, | ||
| Int_t | nspecies = -1 ) |
The Fill...Hist() methods fill the histograms with the real limits on the variables This method allows to refill the specified histogram with user-set boundaries min and max.
Parameters:
#nvar#nvar#nvar and species #nspeciestype = 4 - histogram of x variable#nvar, species#nspecies, WITH sWeightstype = 5 - histogram of y variable#nvar, species#nspecies`, WITH sWeights Definition at line 755 of file TSPlot.cxx.
Save this object in the file specified by filename.
otherwise the object is written to filename as a CINT/C++ script. The C++ code to rebuild this object is generated via SavePrimitive(). The "option" parameter is passed to SavePrimitive. By default it is an empty string. It can be used to specify the Draw option in the code generated by SavePrimitive.
The function is available via the object context menu.
Reimplemented in TSpline, TFolder, TGeoVolume, TClassTree, TPad, TPaveClass, TGObject, TSpline3, TSpline5, ROOT::Experimental::XRooFit::xRooNode, TTreePerfStats, TVirtualPad, TGraph, and TH1.
Definition at line 708 of file TObject.cxx.
|
virtualinherited |
Save a primitive as a C++ statement(s) on output stream "out".
Reimplemented in TGeoTessellated, TGraphEdge, TGraphNode, TGeoIdentity, TStyle, TCurlyArc, TCurlyLine, TGedMarkerSelect, TGedPatternSelect, TGColorSelect, TGFont, TGVerticalLayout, TGHorizontalLayout, TGRowLayout, TGColumnLayout, TGMatrixLayout, TGTileLayout, TGListLayout, TGListDetailsLayout, TGTextLBEntry, TGNumberEntryField, TGNumberEntry, TGTableLayoutHints, TGTableLayout, TGTextEdit, TGTextView, TGXYLayoutHints, TGXYLayout, TRootContainer, TGHtml, TEfficiency, TExec, TMacro, TGeoArb8, TGeoTrap, TGeoGtra, TGeoBBox, TGeoBoolNode, TGeoUnion, TGeoIntersection, TGeoSubtraction, TGeoCompositeShape, TGeoCone, TGeoConeSeg, TGeoElementRN, TGeoDecayChannel, TGeoEltu, TGeoHalfSpace, TGeoHype, TGeoMaterial, TGeoMixture, TGeoTranslation, TGeoRotation, TGeoCombiTrans, TGeoHMatrix, TGeoMedium, TGeoPara, TGeoParaboloid, TGeoPatternX, TGeoPatternY, TGeoPatternZ, TGeoPatternParaX, TGeoPatternParaY, TGeoPatternParaZ, TGeoPatternTrapZ, TGeoPatternCylR, TGeoPatternCylPhi, TGeoPatternSphR, TGeoPatternSphTheta, TGeoPatternSphPhi, TGeoPcon, TGeoPgon, TGeoScaledShape, TGeoShapeAssembly, TGeoSphere, TGeoTorus, TGeoTrd1, TGeoTrd2, TGeoTube, TGeoTubeSeg, TGeoCtub, TGeoVolume, TGeoXtru, TASImage, TAnnotation, TButton, TCanvas, TGroupButton, TPad, TPaveClass, TSlider, TSliderBox, TArc, TArrow, TBox, TCrown, TCutG, TDiamond, TEllipse, TFrame, TGaxis, TGraphPolar, TGraphPolargram, TLatex, TLegend, TLine, TMarker, TMathText, TPave, TPaveLabel, TPaveStats, TPavesText, TPaveText, TPolyLine, TText, TWbox, TGraphStruct, TAxis3D, TMarker3DBox, TPolyLine3D, TPolyMarker3D, TGHorizontal3DLine, TGVertical3DLine, TGButton, TGTextButton, TGPictureButton, TGCheckButton, TGRadioButton, TGButtonGroup, TGVButtonGroup, TGHButtonGroup, TGContainer, TGCanvas, TGComboBox, TGLineStyleComboBox, TGLineWidthComboBox, TGDockableFrame, TGDoubleVSlider, TGDoubleHSlider, TGFrame, TGCompositeFrame, TGVerticalFrame, TGHorizontalFrame, TGMainFrame, TGTransientFrame, TGGroupFrame, TGFSComboBox, TGFileContainer, TGGC, TGIcon, TGLabel, TGLayoutHints, TGListBox, TGListTree, TGListView, TGLVContainer, TGMdiFrame, TGMdiMainFrame, TGMdiMenuBar, TGPopupMenu, TGMenuTitle, TGMenuBar, TGProgressBar, TGHProgressBar, TGVProgressBar, TGHScrollBar, TGVScrollBar, TGShapedFrame, TGShutterItem, TGShutter, TGVSlider, TGHSlider, TGSplitFrame, TGVSplitter, TGHSplitter, TGVFileSplitter, TGStatusBar, TGTabLayout, TGTab, TGTextEntry, TGToolBar, TGTripleVSlider, TGTripleHSlider, TRootEmbeddedCanvas, TF1, TF12, TF2, TF3, TGraph, TGraph2D, TGraph2DAsymmErrors, TGraph2DErrors, TGraphAsymmErrors, TGraphBentErrors, TGraphErrors, TGraphMultiErrors, TH1, TH2Poly, THStack, TMultiGraph, TPolyMarker, TProfile, TProfile2D, TProfile3D, TScatter, TScatter2D, TSpline3, TSpline5, TPaletteAxis, TChain, TTreePerfStats, TParallelCoord, TParallelCoordVar, TPie, and TPieSlice.
Definition at line 858 of file TObject.cxx.
|
staticprotectedinherited |
Save object constructor in the output stream "out".
Can be used as first statement when implementing SavePrimitive() method for the object
Definition at line 777 of file TObject.cxx.
|
staticprotectedinherited |
Save invocation of primitive Draw() method Skipped if option contains "nodraw" string.
Definition at line 845 of file TObject.cxx.
|
staticprotectedinherited |
Save array in the output stream "out" as vector.
Create unique variable name based on prefix value Returns name of vector which can be used in constructor or in other places of C++ code If flag === kTRUE, just add empty line If flag === 111, check if array is empty and return nullptr or <vectorname>.data()
Definition at line 796 of file TObject.cxx.
Set or unset the user status bits as specified in f.
Definition at line 888 of file TObject.cxx.
|
virtualinherited |
Set drawing option for object.
This option only affects the drawing style and is stored in the option field of the TObjOptLink supporting a TPad's primitive list (TList). Note that it does not make sense to call object.SetDrawOption(option) before having called object.Draw().
Reimplemented in TSystemDirectory, TSystemFile, TPad, TGFrame, TAxis, TBrowser, TPaveStats, TGedFrame, TRootBrowserLite, and RooPlot.
Definition at line 871 of file TObject.cxx.
|
staticinherited |
Set destructor only flag.
Definition at line 1204 of file TObject.cxx.
| void TSPlot::SetInitialNumbersOfSpecies | ( | Int_t * | numbers | ) |
Set the initial number of events of each species - used as initial estimates in minuit.
Definition at line 375 of file TSPlot.cxx.
|
staticinherited |
Turn on/off tracking of objects in the TObjectTable.
Definition at line 1188 of file TObject.cxx.
| void TSPlot::SetTree | ( | TTree * | tree | ) |
Set the input Tree.
Definition at line 838 of file TSPlot.cxx.
| void TSPlot::SetTreeSelection | ( | const char * | varexp = "", |
| const char * | selection = "", | ||
| Long64_t | firstentry = 0 ) |
Specifies the variables from the tree to be used for splot.
Variables fNx, fNy, fNSpecies and fNEvents should already be set!
In the 1st parameter it is assumed that first fNx variables are x(control variables), then fNy y variables (discriminating variables), then fNy*fNSpecies ypdf variables (probability distribution functions of discriminating variables for different species). The order of pdfs should be: species0_y0, species0_y1,... species1_y0, species1_y1,...species[fNSpecies-1]_y0... The 2nd parameter allows to make a cut TTree::Draw method description contains more details on specifying expression and selection
Definition at line 856 of file TSPlot.cxx.
|
virtualinherited |
Set the unique object id.
Definition at line 899 of file TObject.cxx.
Computes the sWeights from the covariance matrix.
Definition at line 471 of file TSPlot.cxx.
|
overridevirtual |
|
inline |
Issue system error message.
Use "location" to specify the method where the system error occurred. Accepts standard printf formatting arguments.
Definition at line 1112 of file TObject.cxx.
|
inlineinherited |
|
virtualinherited |
Set current style settings in this object This function is called when either TCanvas::UseCurrentStyle or TROOT::ForceStyle have been invoked.
Reimplemented in TCanvas, TPad, TFrame, TPaveStats, TPaveText, TAxis3D, TGraph, TH1, and TTree.
Definition at line 909 of file TObject.cxx.
Issue warning message.
Use "location" to specify the method where the warning occurred. Accepts standard printf formatting arguments.
Definition at line 1084 of file TObject.cxx.
|
virtualinherited |
Write this object to the current directory.
For more see the const version of this method.
Reimplemented in TSQLFile, TXMLFile, TDirectory, TBuffer, ROOT::TBufferMergerFile, TDirectoryFile, TFile, TParallelMergingFile, TCollection, TMap, and TTree.
Definition at line 989 of file TObject.cxx.
|
virtualinherited |
Write this object to the current directory.
The data structure corresponding to this object is serialized. The corresponding buffer is written to the current directory with an associated key with name "name".
Writing an object to a file involves the following steps:
Bufsize can be given to force a given buffer size to write this object. By default, the buffersize will be taken from the average buffer size of all objects written to the current file so far.
If a name is specified, it will be the name of the key. If name is not given, the name of the key will be the name as returned by GetName().
The option can be a combination of: kSingleKey, kOverwrite or kWriteDelete Using the kOverwrite option a previous key with the same name is overwritten. The previous key is deleted before writing the new object. Using the kWriteDelete option a previous key with the same name is deleted only after the new object has been written. This option is safer than kOverwrite but it is slower. NOTE: Neither kOverwrite nor kWriteDelete reduces the size of a TFile– the space is simply freed up to be overwritten; in the case of a TTree, it is more complicated. If one opens a TTree, appends some entries, then writes it out, the behaviour is effectively the same. If, however, one creates a new TTree and writes it out in this way, only the metadata is replaced, effectively making the old data invisible without deleting it. TTree::Delete() can be used to mark all disk space occupied by a TTree as free before overwriting its metadata this way. The kSingleKey option is only used by TCollection::Write() to write a container with a single key instead of each object in the container with its own key.
An object is read from the file into memory via TKey::Read() or via TObject::Read().
The function returns the total number of bytes written to the file. It returns 0 if the object cannot be written.
Reimplemented in TSQLFile, TXMLFile, TDirectory, TBuffer, TDirectoryFile, TFile, TParallelMergingFile, TCollection, TMap, and TTree.
Definition at line 964 of file TObject.cxx.
|
privateinherited |
|
staticprivateinherited |
if true keep track of objects in TObjectTable
|
privateinherited |

