

 This tutorial demonstrates how to create simple graphs in ROOT.
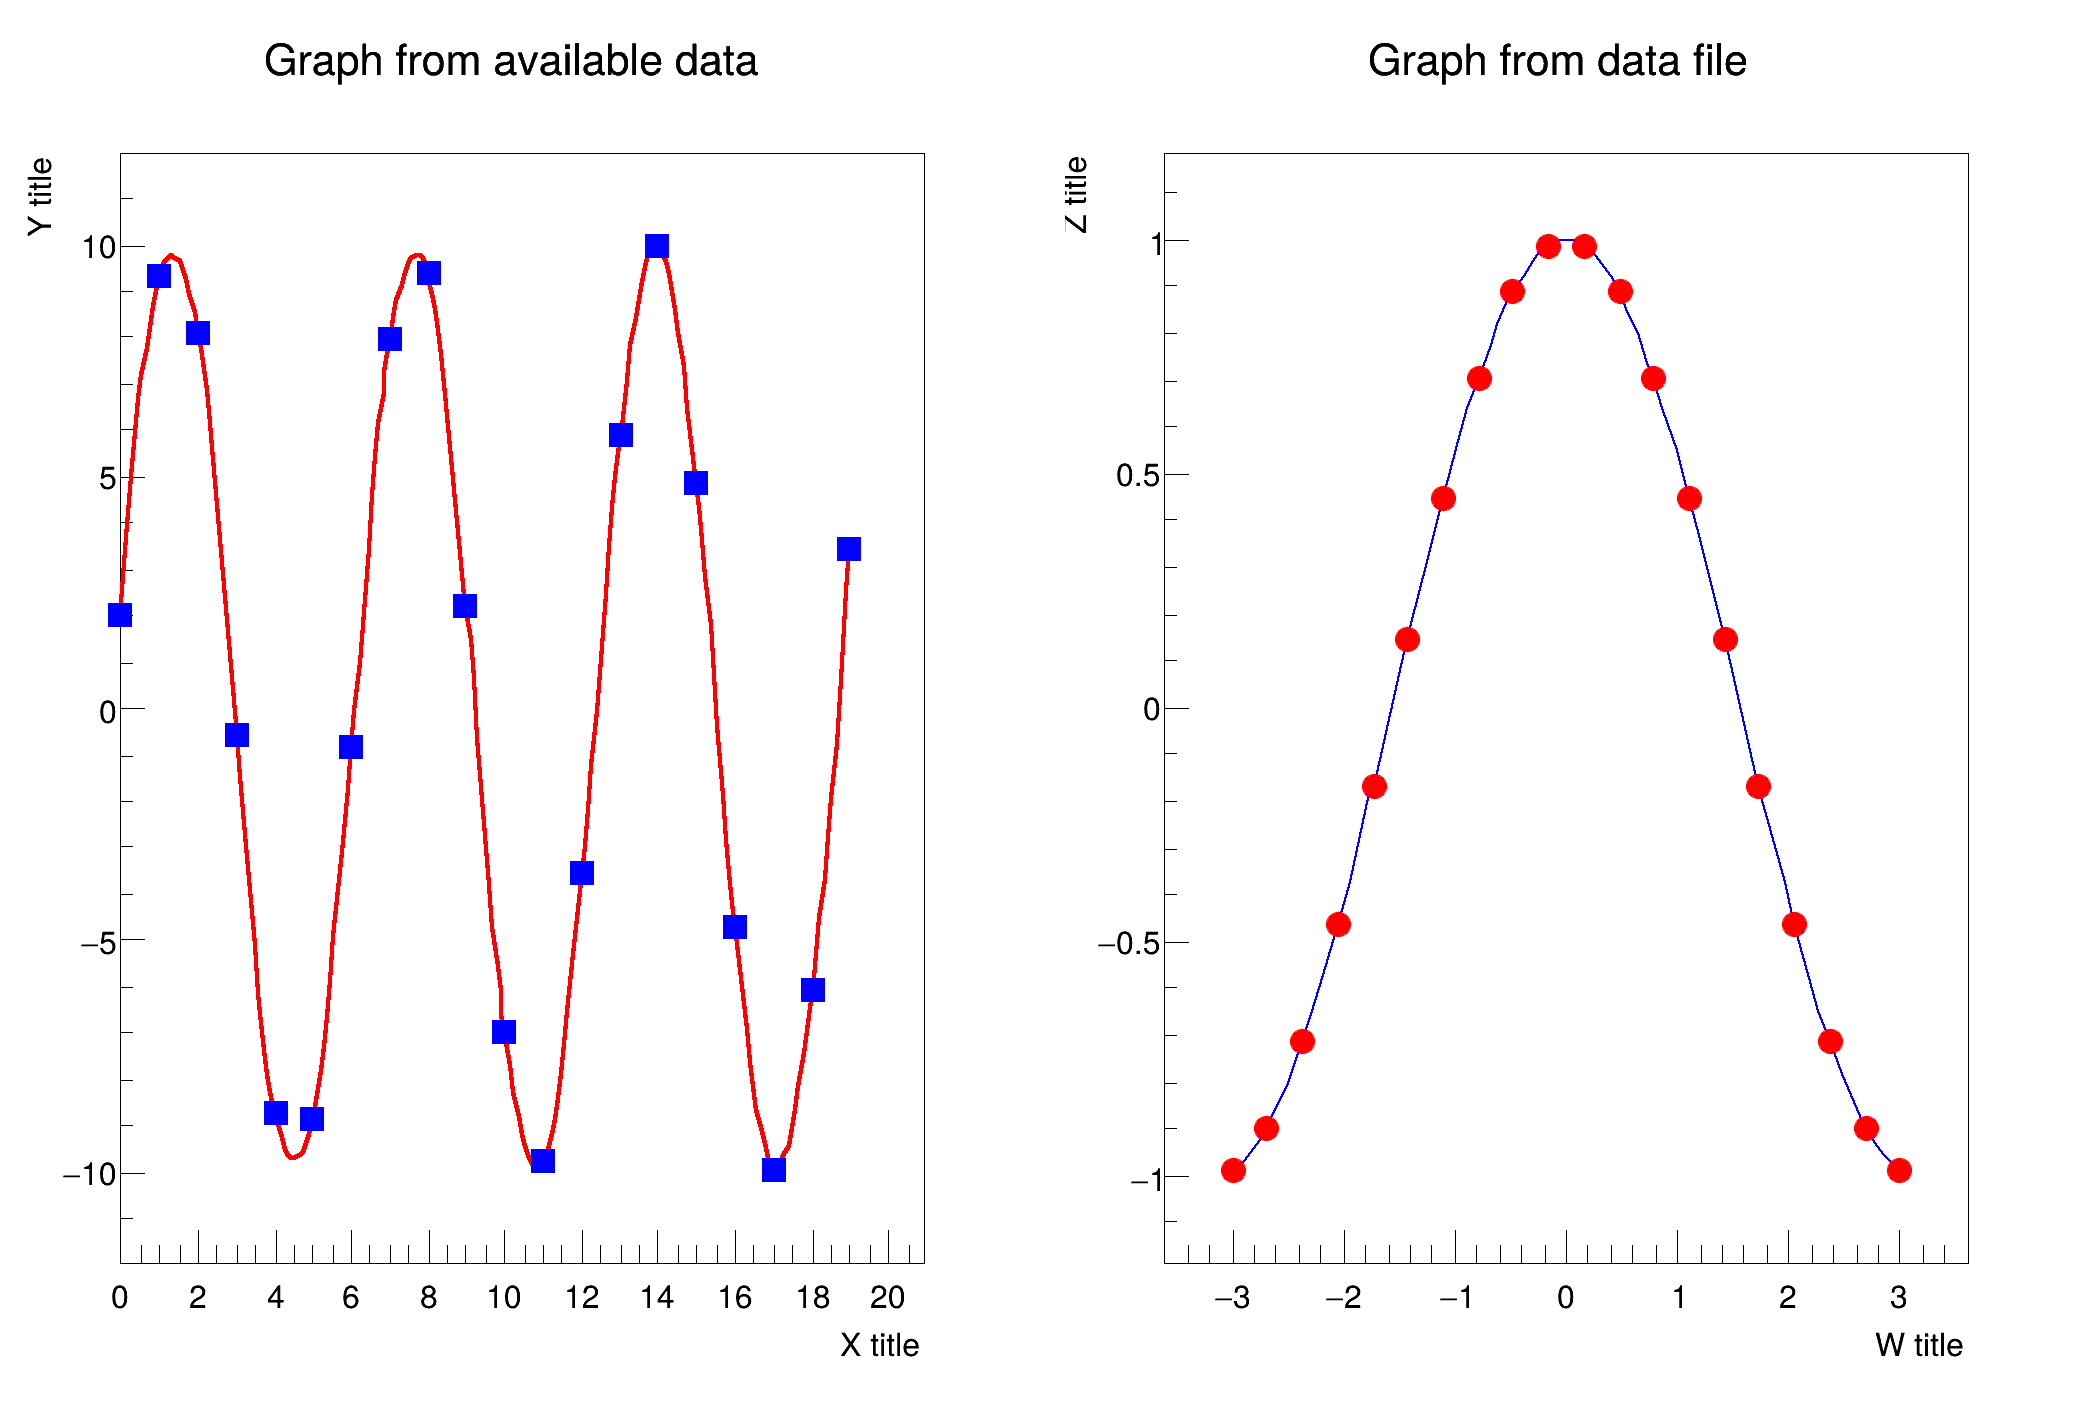
The example is divided into two sections:
- The first section plots data generated from arrays.
- The second section plots data read from a text file.
import re
import numpy as np
import ROOT
c1 =
ROOT.TCanvas(
"c1",
"Two simple graphs", 200, 10, 700, 500)
2, 1
)
n = 20
"ACP"
)
with open(f"{ROOT.gROOT.GetTutorialDir()}/visualisation/graphs/data_basic.txt") as file:
for line in file:
w_str, z_str =
re.split(
r"\s+", line)[:2]
ROOT::Detail::TRangeCast< T, true > TRangeDynCast
TRangeDynCast is an adapter class that allows the typed iteration through a TCollection.
Option_t Option_t TPoint TPoint const char GetTextMagnitude GetFillStyle GetLineColor GetLineWidth GetMarkerStyle GetTextAlign GetTextColor GetTextSize void char Point_t Rectangle_t WindowAttributes_t Float_t Float_t Float_t Int_t Int_t UInt_t UInt_t Rectangle_t Int_t Int_t Window_t TString Int_t GCValues_t GetPrimarySelectionOwner GetDisplay GetScreen GetColormap GetNativeEvent const char const char dpyName wid window const char font_name cursor keysym reg const char only_if_exist regb h Point_t winding char text const char depth char const char Int_t count const char ColorStruct_t color const char Pixmap_t Pixmap_t PictureAttributes_t attr const char char ret_data h unsigned char height h Atom_t Int_t ULong_t ULong_t unsigned char prop_list Atom_t Atom_t Atom_t Time_t UChar_t len
- Author
- Rene Brun, Jamie Gooding
Definition in file gr001_simple.py.


