Loading [MathJax]/extensions/tex2jax.js
Logo ROOT  
Reference Guide
All Classes Namespaces Files Functions Variables Typedefs Enumerations Enumerator Properties Friends Macros Modules Pages
candleplotstack.C File Reference

Detailed Description

View in nbviewer Open in SWAN Example showing how a THStack with candle plot option.

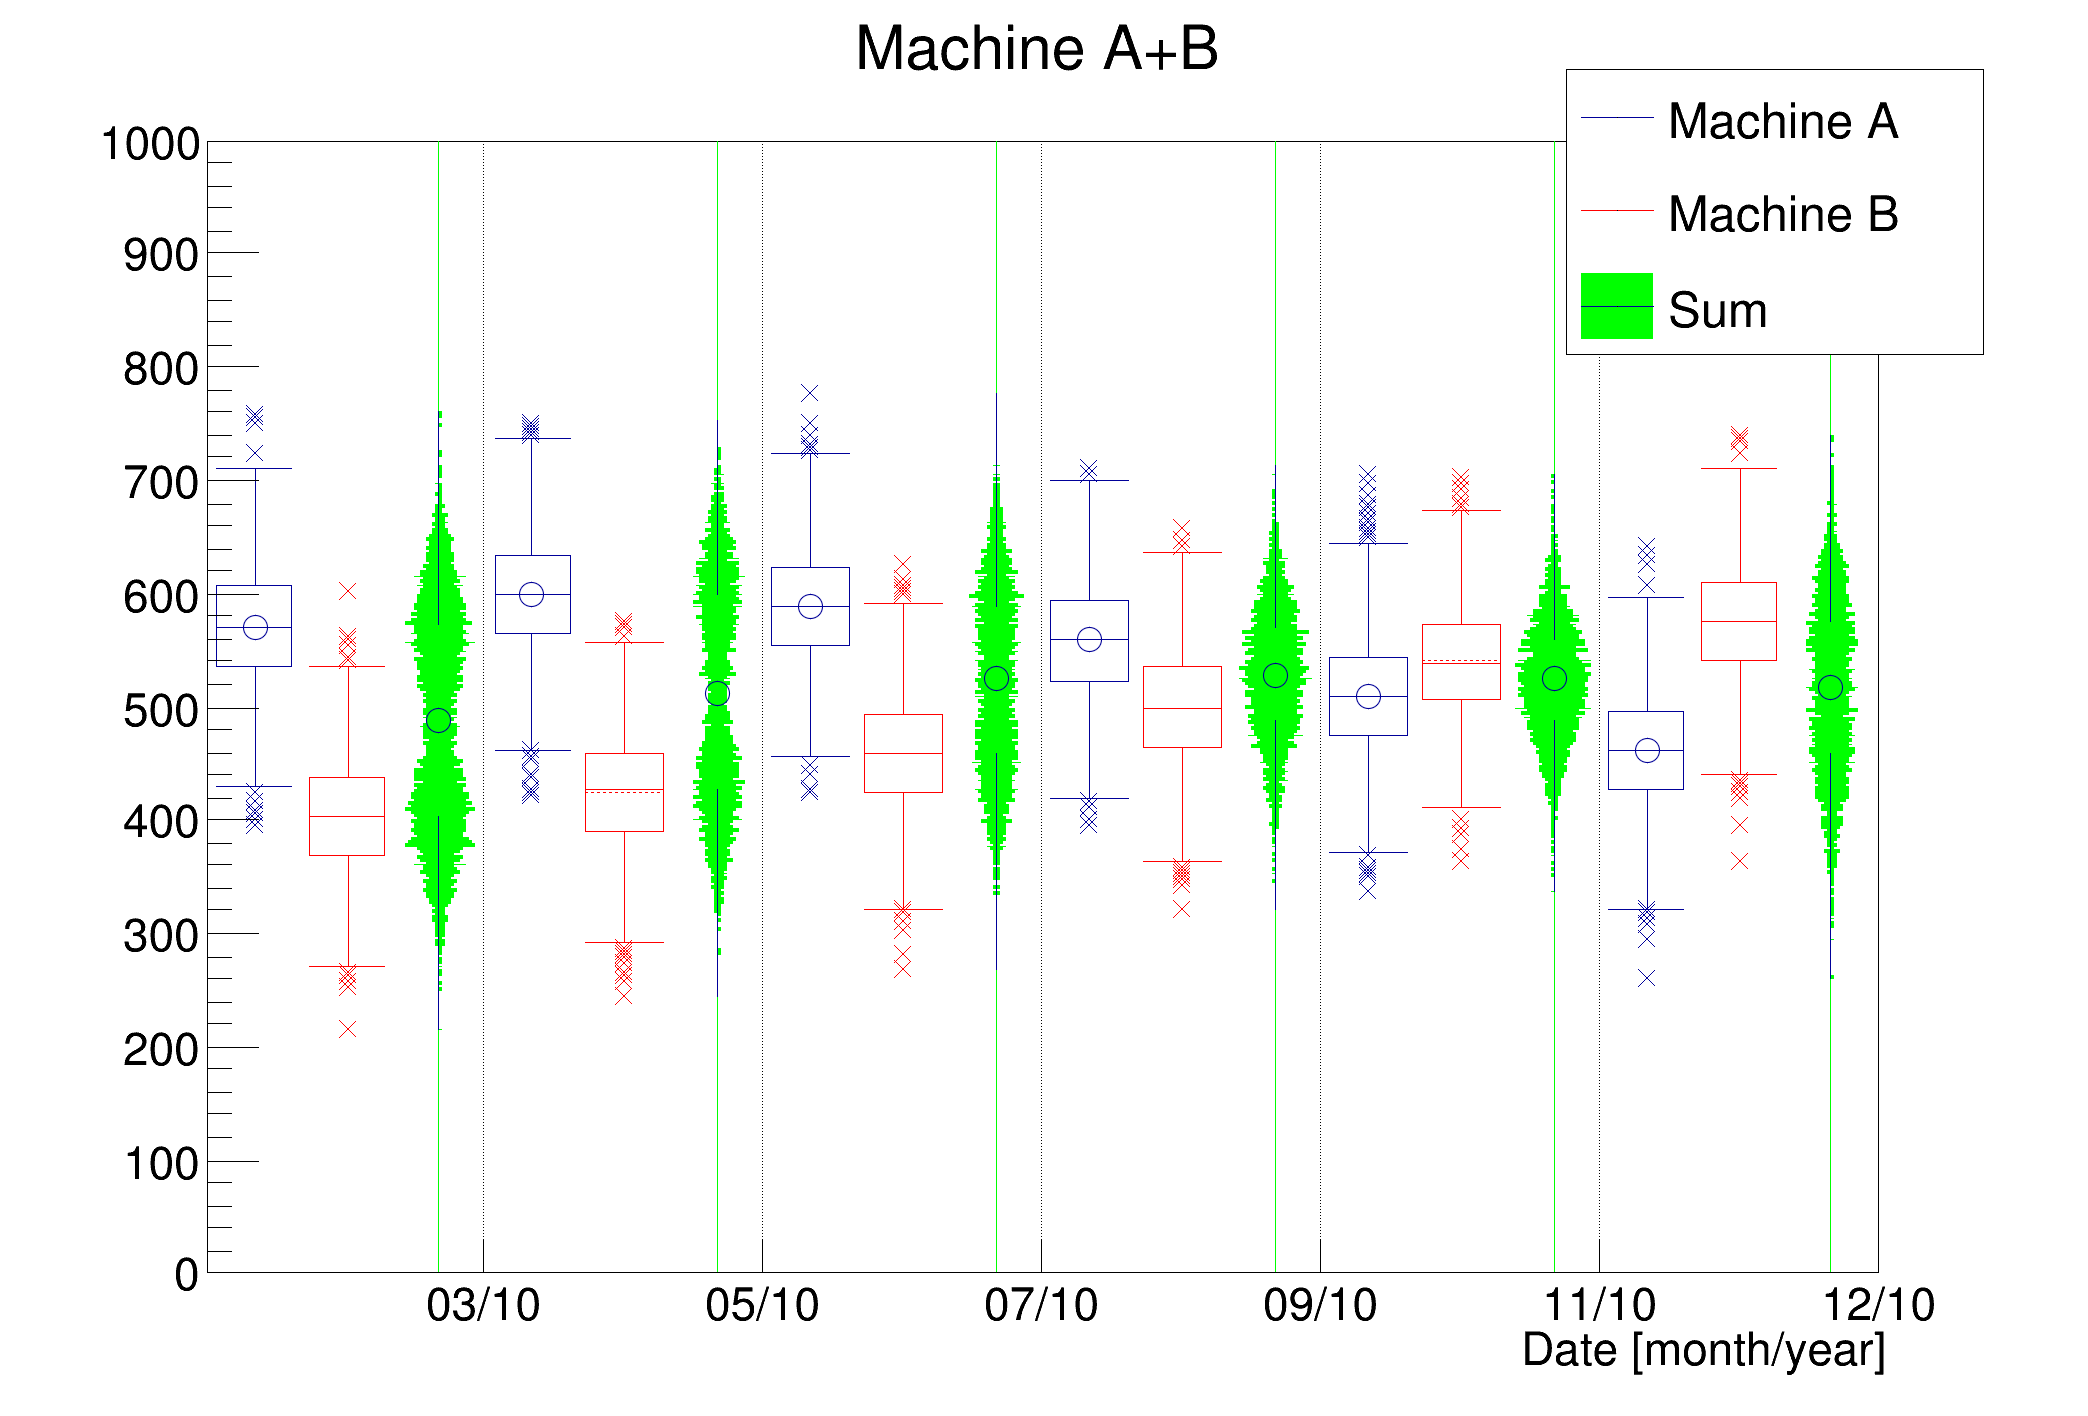
void candleplotstack()
{
TRandom *rng = new TRandom();
TDatime *dateBegin = new TDatime(2010,1,1,0,0,0);
TDatime *dateEnd = new TDatime(2011,1,1,0,0,0);
int bins = 1000;
TH2I *h1 = new TH2I("h1","Machine A",6,dateBegin->Convert(),dateEnd->Convert(),bins,0,1000);
TH2I *h2 = new TH2I("h2","Machine B",6,dateBegin->Convert(),dateEnd->Convert(),bins,0,1000);
TH2I *hsum = new TH2I("h4","Sum",6,dateBegin->Convert(),dateEnd->Convert(),bins,0,1000);
float Rand;
for (int i = dateBegin->Convert(); i < dateEnd->Convert(); i+=86400*30) {
for (int j = 0; j < 1000; j++) {
Rand = rng->Gaus(500+sin(i/10000000.)*100,50); h1->Fill(i,Rand); hsum->Fill(i,Rand);
Rand = rng->Gaus(500+sin(i/12000000.)*100,50); h2->Fill(i,Rand); hsum->Fill(i,Rand);
}
}
hsum->SetFillColor(kGreen);
TCanvas *c1 = new TCanvas();
THStack *hs = new THStack("hs","Machine A+B");
hs->Add(h1);
hs->Add(h2,"candle2");
hs->Add(hsum, "violin1");
hs->Draw("candle3");
hs->GetXaxis()->SetNdivisions(410);
gPad->SetGrid(1,0);
hs->GetXaxis()->SetTimeFormat("%m/%y");
hs->GetXaxis()->SetTitle("Date [month/year]");
c1->Modified();
gPad->BuildLegend(0.75,0.75,0.95,0.95,"");
}
@ kRed
Definition: Rtypes.h:64
@ kGreen
Definition: Rtypes.h:64
double sin(double)
R__EXTERN TStyle * gStyle
Definition: TStyle.h:410
#define gPad
Definition: TVirtualPad.h:287
virtual void SetNdivisions(Int_t n=510, Bool_t optim=kTRUE)
Set the number of divisions for this axis.
Definition: TAttAxis.cxx:229
virtual void SetLineColor(Color_t lcolor)
Set the line color.
Definition: TAttLine.h:40
virtual void SetTimeDisplay(Int_t value)
Definition: TAxis.h:161
virtual void SetTimeFormat(const char *format="")
Change the format used for time plotting.
Definition: TAxis.cxx:1013
The Canvas class.
Definition: TCanvas.h:27
This class stores the date and time with a precision of one second in an unsigned 32 bit word (950130...
Definition: TDatime.h:37
UInt_t Convert(Bool_t toGMT=kFALSE) const
Convert fDatime from TDatime format to the standard time_t format.
Definition: TDatime.cxx:181
virtual Int_t Fill(Double_t x)
Increment bin with abscissa X by 1.
Definition: TH1.cxx:3275
2-D histogram with an int per channel (see TH1 documentation)}
Definition: TH2.h:212
Int_t Fill(Double_t)
Invalid Fill method.
Definition: TH2.cxx:294
The Histogram stack class.
Definition: THStack.h:31
virtual void Draw(Option_t *chopt="")
Draw this multihist with its current attributes.
Definition: THStack.cxx:445
virtual void Add(TH1 *h, Option_t *option="")
add a new histogram to the list Only 1-d and 2-d histograms currently supported.
Definition: THStack.cxx:359
TAxis * GetXaxis() const
Get x axis of the histogram used to draw the stack.
Definition: THStack.cxx:601
virtual void SetTitle(const char *title="")
Set the title of the TNamed.
Definition: TNamed.cxx:164
This is the base class for the ROOT Random number generators.
Definition: TRandom.h:27
virtual Double_t Gaus(Double_t mean=0, Double_t sigma=1)
Samples a random number from the standard Normal (Gaussian) Distribution with the given mean and sigm...
Definition: TRandom.cxx:263
void SetTimeOffset(Double_t toffset)
Change the time offset for time plotting.
Definition: TStyle.cxx:1801
return c1
Definition: legend1.C:41
TH1F * h1
Definition: legend1.C:5
Definition: hsum.py:1
Authors
Georg Troska, Olivier Couet

Definition in file candleplotstack.C.