Logo ROOT  
Reference Guide
fitslicesy.C File Reference

Detailed Description

View in nbviewer Open in SWAN Illustrates how to use the TH1::FitSlicesY function It uses the TH2F histogram generated in macro hsimple.C It invokes FitSlicesY and draw the fitted "mean" and "sigma" in 2 sepate pads.

This macro shows also how to annotate a picture, change some pad parameters.

void fitslicesy() {
// Change some default parameters in the current style
gStyle->SetLabelSize(0.06,"x");
gStyle->SetLabelSize(0.06,"y");
// Connect the input file and get the 2-d histogram in memory
TString dir = gROOT->GetTutorialDir();
dir.Append("/hsimple.C");
dir.ReplaceAll("/./","/");
if (!gInterpreter->IsLoaded(dir.Data())) gInterpreter->LoadMacro(dir.Data());
TFile *hsimpleFile = (TFile*)gROOT->ProcessLineFast("hsimple(1)");
if (!hsimpleFile) return;
TH2F *hpxpy = (TH2F*)hsimpleFile->Get("hpxpy");
// Create a canvas and divide it
TCanvas *c1 = new TCanvas("c1","c1",700,500);
c1->SetFillColor(42);
c1->Divide(2,1);
TPad *leftPad = (TPad*)c1->cd(1);;
leftPad->Divide(1,2);
// Draw 2-d original histogram
leftPad->cd(1);
gPad->SetTopMargin(0.12);
gPad->SetFillColor(33);
hpxpy->Draw();
hpxpy->GetXaxis()->SetLabelSize(0.06);
hpxpy->GetYaxis()->SetLabelSize(0.06);
// Fit slices projected along Y fron bins in X [7,32] with more than 20 bins in Y filled
hpxpy->FitSlicesY(0,7,32,20);
// Show fitted "mean" for each slice
leftPad->cd(2);
gPad->SetFillColor(33);
TH2F *hpxpy_0 = (TH2F*)hsimpleFile->Get("hpxpy_0");
hpxpy_0->Draw();
TPad *rightPad = (TPad*)c1->cd(2);
rightPad->Divide(1,2);
rightPad->cd(1);
gPad->SetTopMargin(0.12);
gPad->SetLeftMargin(0.15);
gPad->SetFillColor(33);
TH2F *hpxpy_1 = (TH2F*)hsimpleFile->Get("hpxpy_1");
hpxpy_1->Draw();
// Show fitted "sigma" for each slice
rightPad->cd(2);
gPad->SetTopMargin(0.12);
gPad->SetLeftMargin(0.15);
gPad->SetFillColor(33);
TH2F *hpxpy_2 = (TH2F*)hsimpleFile->Get("hpxpy_2");
hpxpy_2->SetMinimum(0.8);
hpxpy_2->Draw();
//attributes
hpxpy_0->SetLineColor(5);
hpxpy_1->SetLineColor(5);
hpxpy_2->SetLineColor(5);
hpxpy_0->SetMarkerColor(2);
hpxpy_1->SetMarkerColor(2);
hpxpy_2->SetMarkerColor(2);
hpxpy_0->SetMarkerStyle(21);
hpxpy_1->SetMarkerStyle(21);
hpxpy_2->SetMarkerStyle(21);
hpxpy_0->SetMarkerSize(0.6);
hpxpy_1->SetMarkerSize(0.6);
hpxpy_2->SetMarkerSize(0.6);
}
@ kYellow
Definition: Rtypes.h:64
#define gInterpreter
Definition: TInterpreter.h:556
#define gROOT
Definition: TROOT.h:406
R__EXTERN TStyle * gStyle
Definition: TStyle.h:410
#define gPad
Definition: TVirtualPad.h:287
virtual void SetLabelSize(Float_t size=0.04)
Set size of axis labels.
Definition: TAttAxis.cxx:204
virtual void SetLineColor(Color_t lcolor)
Set the line color.
Definition: TAttLine.h:40
virtual void SetMarkerColor(Color_t mcolor=1)
Set the marker color.
Definition: TAttMarker.h:38
virtual void SetMarkerStyle(Style_t mstyle=1)
Set the marker style.
Definition: TAttMarker.h:40
virtual void SetMarkerSize(Size_t msize=1)
Set the marker size.
Definition: TAttMarker.h:41
The Canvas class.
Definition: TCanvas.h:27
TObject * Get(const char *namecycle) override
Return pointer to object identified by namecycle.
A ROOT file is a suite of consecutive data records (TKey instances) with a well defined format.
Definition: TFile.h:53
TAxis * GetXaxis()
Get the behaviour adopted by the object about the statoverflows. See EStatOverflows for more informat...
Definition: TH1.h:316
TAxis * GetYaxis()
Definition: TH1.h:317
virtual void SetMinimum(Double_t minimum=-1111)
Definition: TH1.h:395
virtual void Draw(Option_t *option="")
Draw this histogram with options.
Definition: TH1.cxx:2998
2-D histogram with a float per channel (see TH1 documentation)}
Definition: TH2.h:251
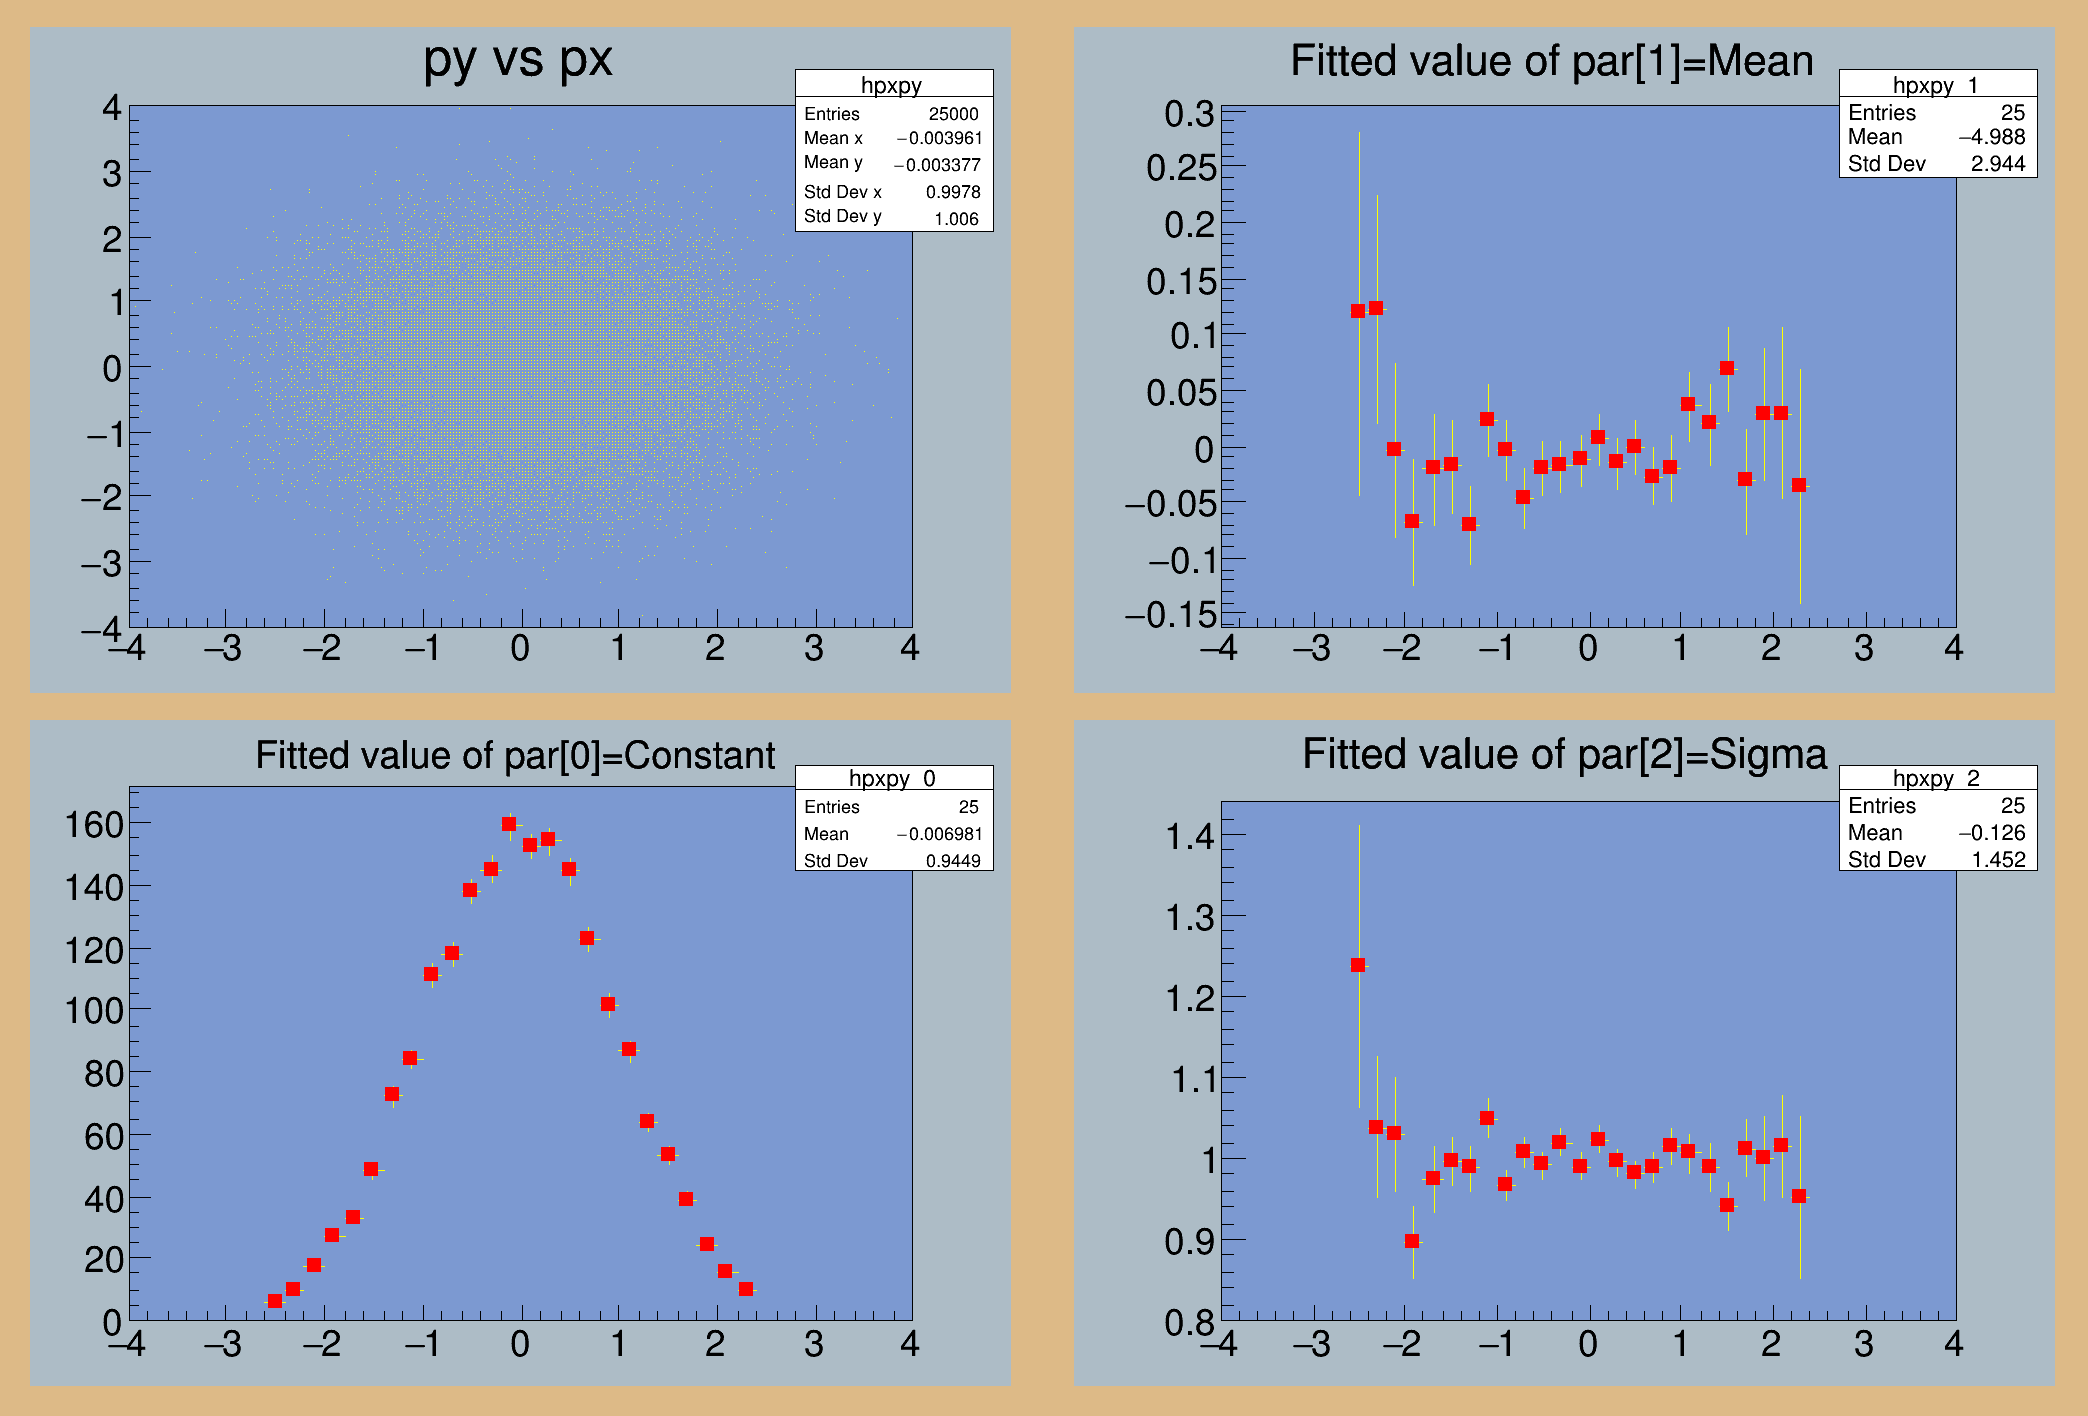
virtual void FitSlicesY(TF1 *f1=0, Int_t firstxbin=0, Int_t lastxbin=-1, Int_t cut=0, Option_t *option="QNR", TObjArray *arr=0)
Project slices along Y in case of a 2-D histogram, then fit each slice with function f1 and make a hi...
Definition: TH2.cxx:962
The most important graphics class in the ROOT system.
Definition: TPad.h:29
virtual void Divide(Int_t nx=1, Int_t ny=1, Float_t xmargin=0.01, Float_t ymargin=0.01, Int_t color=0)
Automatic pad generation by division.
Definition: TPad.cxx:1165
TVirtualPad * cd(Int_t subpadnumber=0)
Set Current pad.
Definition: TPad.cxx:593
Basic string class.
Definition: TString.h:131
const char * Data() const
Definition: TString.h:364
TString & ReplaceAll(const TString &s1, const TString &s2)
Definition: TString.h:687
TString & Append(const char *cs)
Definition: TString.h:559
void SetFrameFillColor(Color_t color=1)
Definition: TStyle.h:353
void SetTitleW(Float_t w=0)
Definition: TStyle.h:396
void SetTitleH(Float_t h=0)
Definition: TStyle.h:397
void SetLabelSize(Float_t size=0.04, Option_t *axis="X")
Set size of axis labels.
Definition: TStyle.cxx:1393
return c1
Definition: legend1.C:41
Author
Rene Brun

Definition in file fitslicesy.C.