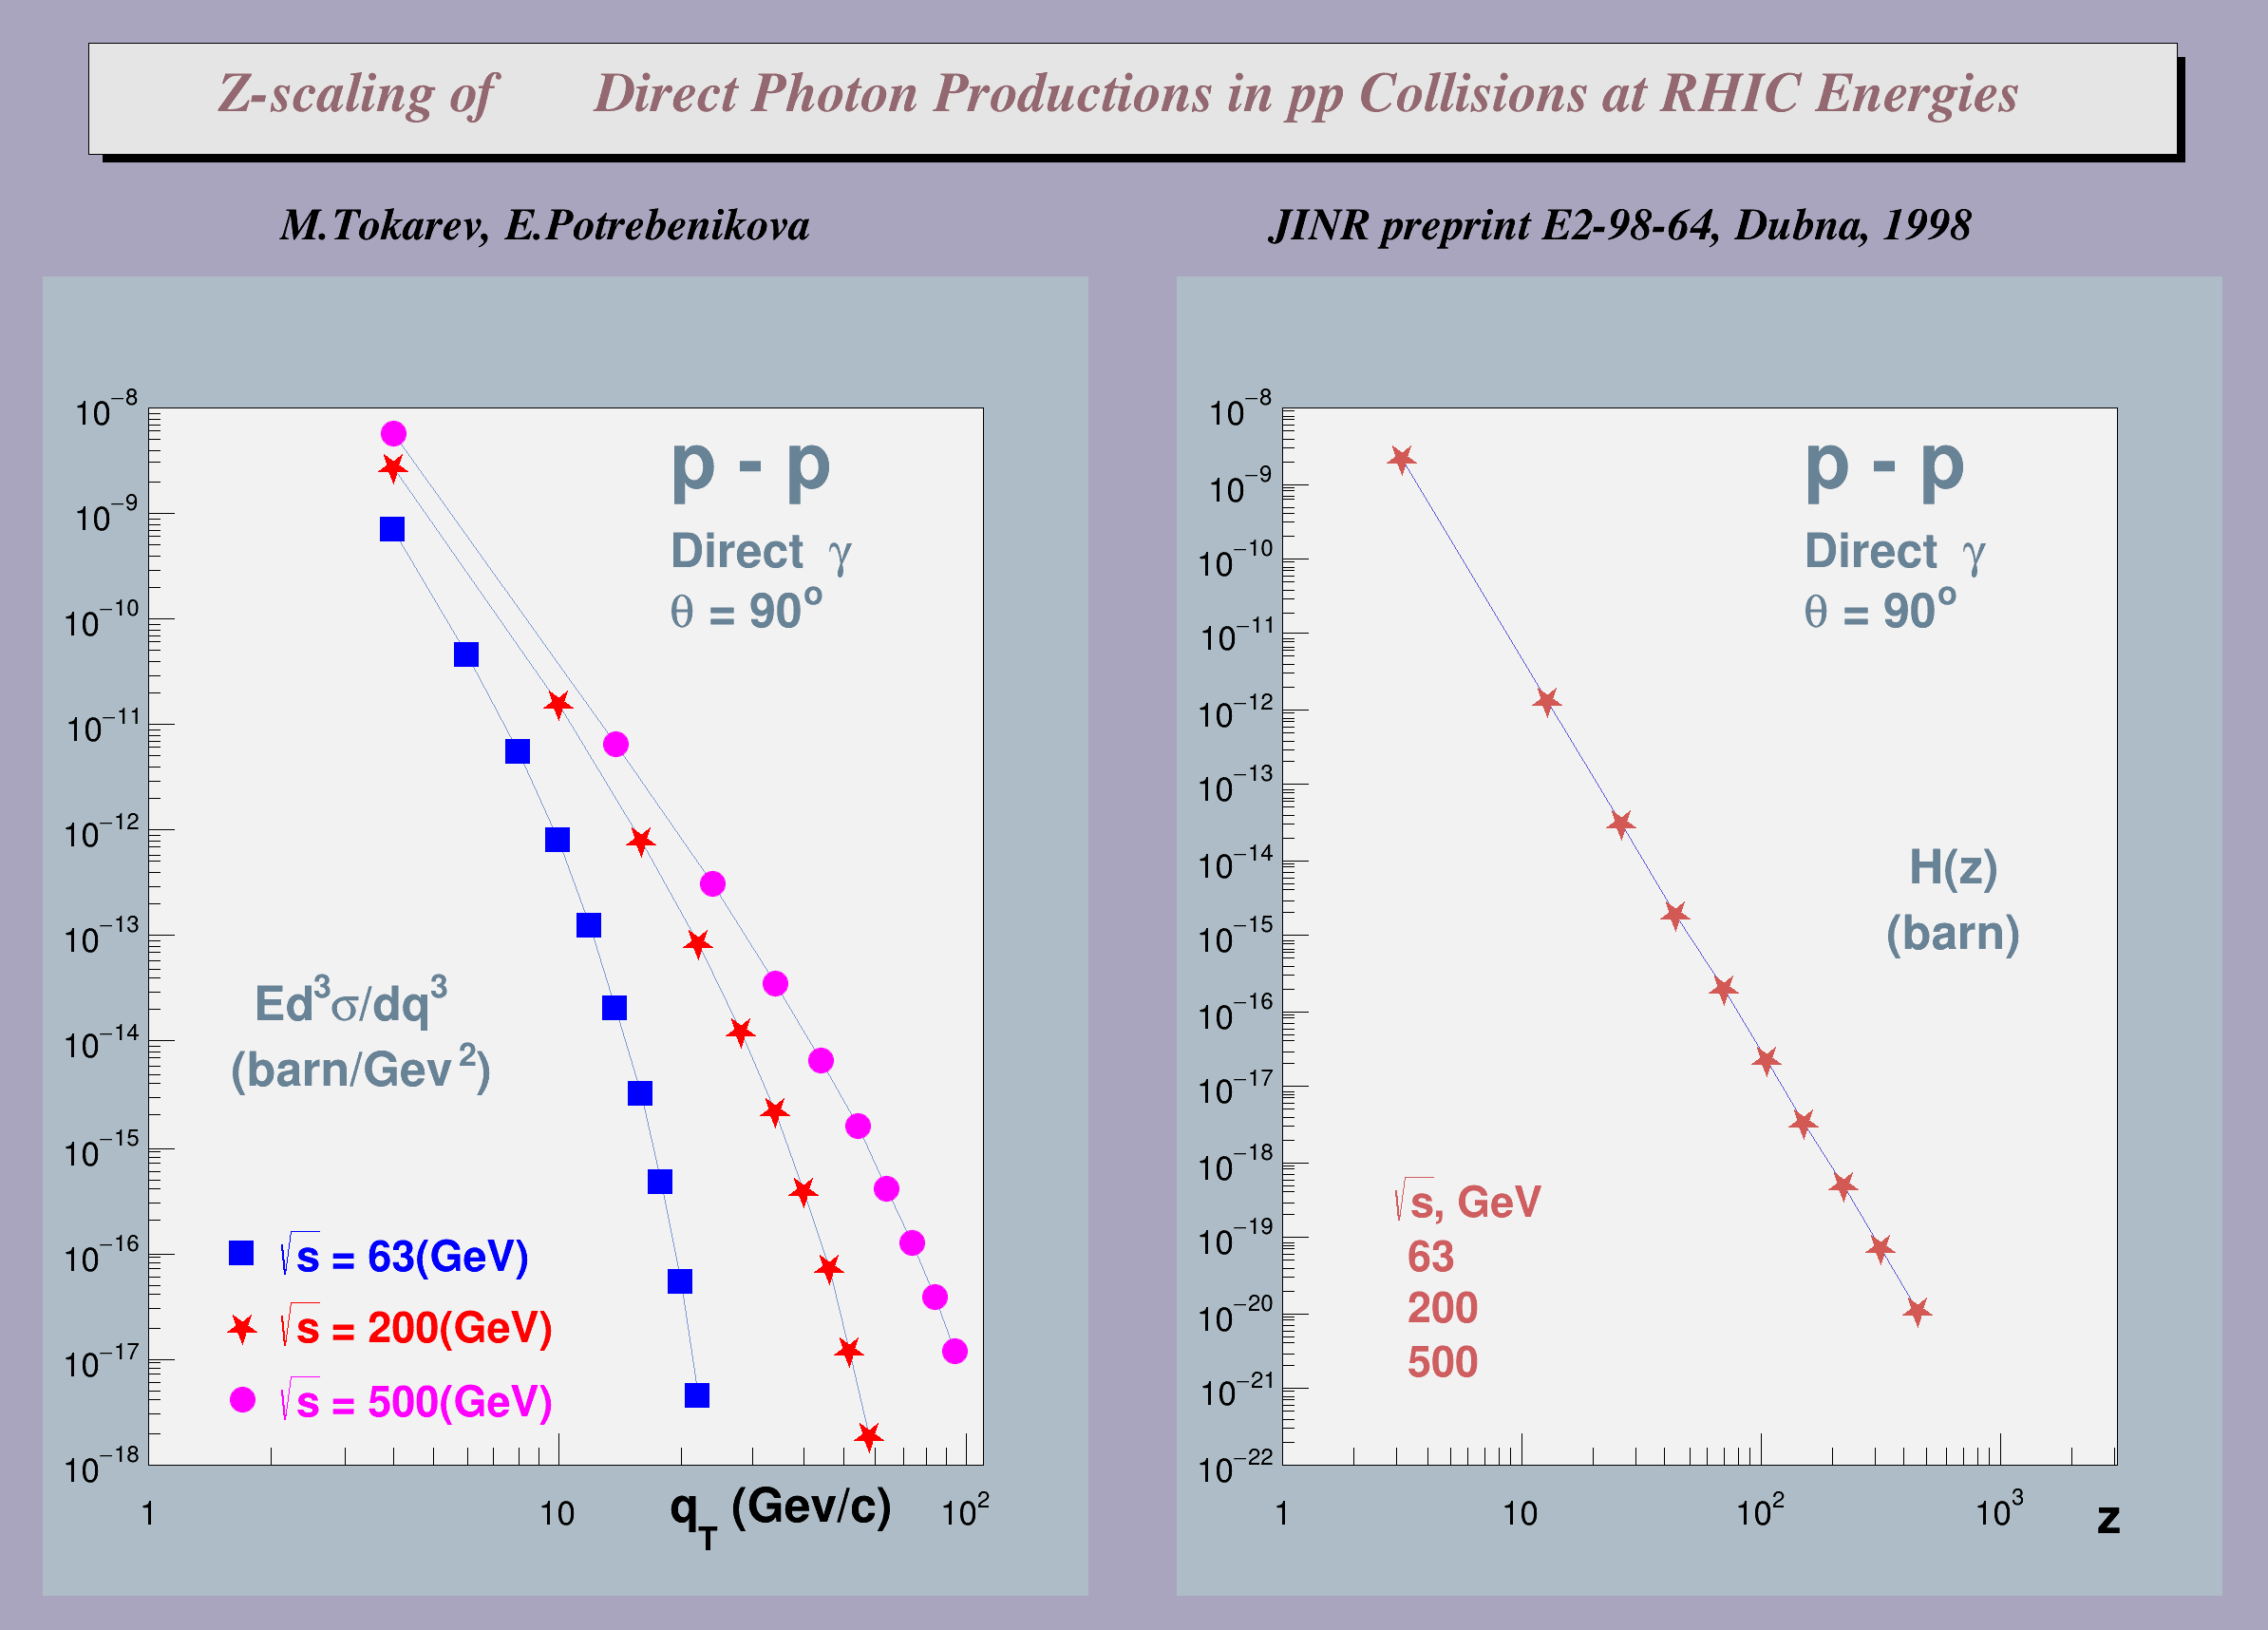
The presented results are predictions of invariant cross-section of Direct Photons produced at RHIC energies, based on the universality of scaling function H(z).
These Figures were published in JINR preprint E2-98-64, Dubna, 1998 and submitted to CPC.
Note that the way greek symbols, super/subscripts are obtained illustrate the current limitations of Root in this area.
#ifdef HZ
#undef HZ
#endif
Float_t Z[NMAX], HZ[NMAX], PT[NMAX], INVSIG[NMAX];
{
"Monte Carlo Study of Z scaling",10,40,800,600);
Direct Photon Productions in pp Collisions at RHIC Energies","br");
t->
DrawLatex(3.1,15.5,
"M.Tokarev, E.Potrebenikova ");
t->
DrawLatex(14.,15.5,
"JINR preprint E2-98-64, Dubna, 1998 ");
TPad *pad1 =
new TPad(
"pad1",
"This is pad1",0.02,0.02,0.48,0.83,33);
TPad *pad2 =
new TPad(
"pad2",
"This is pad2",0.52,0.02,0.98,0.83,33);
energ = 63;
dens = 1.766;
tgrad = 90.;
ptmin = 4.;
ptmax = 24.;
delp = 2.;
hz_calc(energ, dens, tgrad, ptmin, ptmax, delp);
pad1->
Range(-0.255174,-19.25,2.29657,-6.75);
t->
DrawLatex(0.20,0.45,
"Ed^{3}#sigma/dq^{3}");
t->
DrawLatex(0.22,0.260,
"#sqrt{s} = 63(GeV)");
t->
DrawLatex(0.22,0.205,
"#sqrt{s} = 200(GeV)");
t->
DrawLatex(0.22,0.15,
"#sqrt{s} = 500(GeV)");
energ = 200;
dens = 2.25;
tgrad = 90.;
ptmin = 4.;
ptmax = 64.;
delp = 6.;
hz_calc(energ, dens, tgrad, ptmin, ptmax, delp);
energ = 500;
dens = 2.73;
tgrad = 90.;
ptmin = 4.;
ptmax = 104.;
delp = 10.;
hz_calc(energ, dens, tgrad, ptmin, ptmax, delp);
graph->SetMarkerStyle(21);
graph->SetMarkerSize(1.1);
graph->SetPoint(0,1.7,1.e-16);
graph->SetMarkerStyle(29);
graph->SetMarkerSize(1.5);
graph->SetPoint(0,1.7,2.e-17);
graph->SetMarkerColor(6);
graph->SetMarkerStyle(8);
graph->SetMarkerSize(1.1);
graph->SetPoint(0,1.7,4.e-18);
pad2->
Range(-0.43642,-23.75,3.92778,-6.25);
}
{
Float_t EB1, EB2, PB1, PB2, MB1, MB2, M1, M2;
Float_t Y1, Y2,
S, SMIN, SX1, SX2, SX1X2, DELM;
Float_t Y1X1, Y1X2, Y2X1, Y2X2, Y2X1X2, Y1X1X2;
DNDETA= DENS;
MB1 = MN*A1;
MB2 = MN*A2;
EB1 = ENERG/2.*A1;
EB2 = ENERG/2.*A2;
M1 = GM1;
M2 = GM2;
NLOOP = (PTMAX-PTMIN)/DELP;
ETOT =
sqrt(M1*M1 + PTOT*PTOT);
PB1 =
sqrt(EB1*EB1 - MB1*MB1);
PB2 =
sqrt(EB2*EB2 - MB2*MB2);
P2P3 = EB2*ETOT+PB2*PTOT*
cos(THET);
P1P2 = EB2*EB1+PB2*PB1;
P1P3 = EB1*ETOT-PB1*PTOT*
cos(THET);
X1 = P2P3/P1P2;
X2 = P1P3/P1P2;
Y1 = X1+
sqrt(X1*X2*(1.-X1)/(1.-X2));
Y2 = X2+
sqrt(X1*X2*(1.-X2)/(1.-X1));
S = (MB1*MB1)+2.*P1P2+(MB2*MB2);
SMIN = 4.*((MB1*MB1)*(X1*X1) +2.*X1*X2*P1P2+(MB2*MB2)*(X2*X2));
SX1 = 4.*( 2*(MB1*MB1)*X1+2*X2*P1P2);
SX2 = 4.*( 2*(MB2*MB2)*X2+2*X1*P1P2);
SX1X2= 4.*(2*P1P2);
DELM =
pow((1.-Y1)*(1.-Y2),ALX);
Z[
I] =
sqrt(SMIN)/DELM/
pow(DNDETA,BETA);
Y1X1 = 1. +X2*(1-2.*X1)/(2.*(Y1-X1)*(1.-X2));
Y1X2 = X1*(1-X1)/(2.*(Y1-X1)*(1.-X2)*(1.-X2));
Y2X1 = X2*(1-X2)/(2.*(Y2-X2)*(1.-X1)*(1.-X1));
Y2X2 = 1. +X1*(1-2.*X2)/(2.*(Y2-X2)*(1.-X1));
Y2X1X2= Y2X1*( (1.-2.*X2)/(X2*(1-X2)) -( Y2X2-1.)/(Y2-X2));
Y1X1X2= Y1X2*( (1.-2.*X1)/(X1*(1-X1)) -( Y1X1-1.)/(Y1-X1));
KX1=-DELM*(Y1X1*ALX/(1.-Y1) + Y2X1*ALX/(1.-Y2));
KX2=-DELM*(Y2X2*ALX/(1.-Y2) + Y1X2*ALX/(1.-Y1));
ZX1=Z[
I]*(SX1/(2.*SMIN)-KX1/DELM);
ZX2=Z[
I]*(SX2/(2.*SMIN)-KX2/DELM);
H1=ZX1*ZX2;
INVSIG[
I]=(HZ[
I]*H1*16.)/
S;
}
}
double pow(double, double)
virtual void SetFillColor(Color_t fcolor)
Set the fill area color.
virtual void SetLineColor(Color_t lcolor)
Set the line color.
virtual void SetMarkerColor(Color_t mcolor=1)
Set the marker color.
virtual void SetMarkerStyle(Style_t mstyle=1)
Set the marker style.
virtual void SetMarkerSize(Size_t msize=1)
Set the marker size.
virtual void SetTextAlign(Short_t align=11)
Set the text alignment.
virtual void SetTextColor(Color_t tcolor=1)
Set the text color.
virtual void SetTextFont(Font_t tfont=62)
Set the text font.
virtual void SetTextSize(Float_t tsize=1)
Set the text size.
A TGraph is an object made of two arrays X and Y with npoints each.
virtual void SetTitle(const char *title="")
Change (i.e.
virtual void Draw(Option_t *chopt="")
Draw this graph with its current attributes.
To draw Mathematical Formula.
TLatex * DrawLatex(Double_t x, Double_t y, const char *text)
Make a copy of this object with the new parameters And copy object attributes.
The most important graphics class in the ROOT system.
virtual void SetLogy(Int_t value=1)
Set Lin/Log scale for Y.
TH1F * DrawFrame(Double_t xmin, Double_t ymin, Double_t xmax, Double_t ymax, const char *title="")
Draw an empty pad frame with X and Y axis.
virtual void SetLogx(Int_t value=1)
Set Lin/Log scale for X.
virtual void Draw(Option_t *option="")
Draw Pad in Current pad (re-parent pad if necessary).
virtual void Range(Double_t x1, Double_t y1, Double_t x2, Double_t y2)
Set world coordinate system for the pad.
TVirtualPad * cd(Int_t subpadnumber=0)
Set Current pad.
TFrame * GetFrame()
Get frame.
A Pave (see TPave) with a text centered in the Pave.
virtual void Draw(Option_t *option="")
Draw this pavelabel with its current attributes.
virtual void SetNDC(Bool_t isNDC=kTRUE)
Set NDC mode on if isNDC = kTRUE, off otherwise.
RooArgSet S(const RooAbsArg &v1)