ROOT
tags/v6-34-10
Reference Guide
Loading...
Searching...
No Matches
multigraph.C File Reference
Tutorials
»
Graphs tutorials
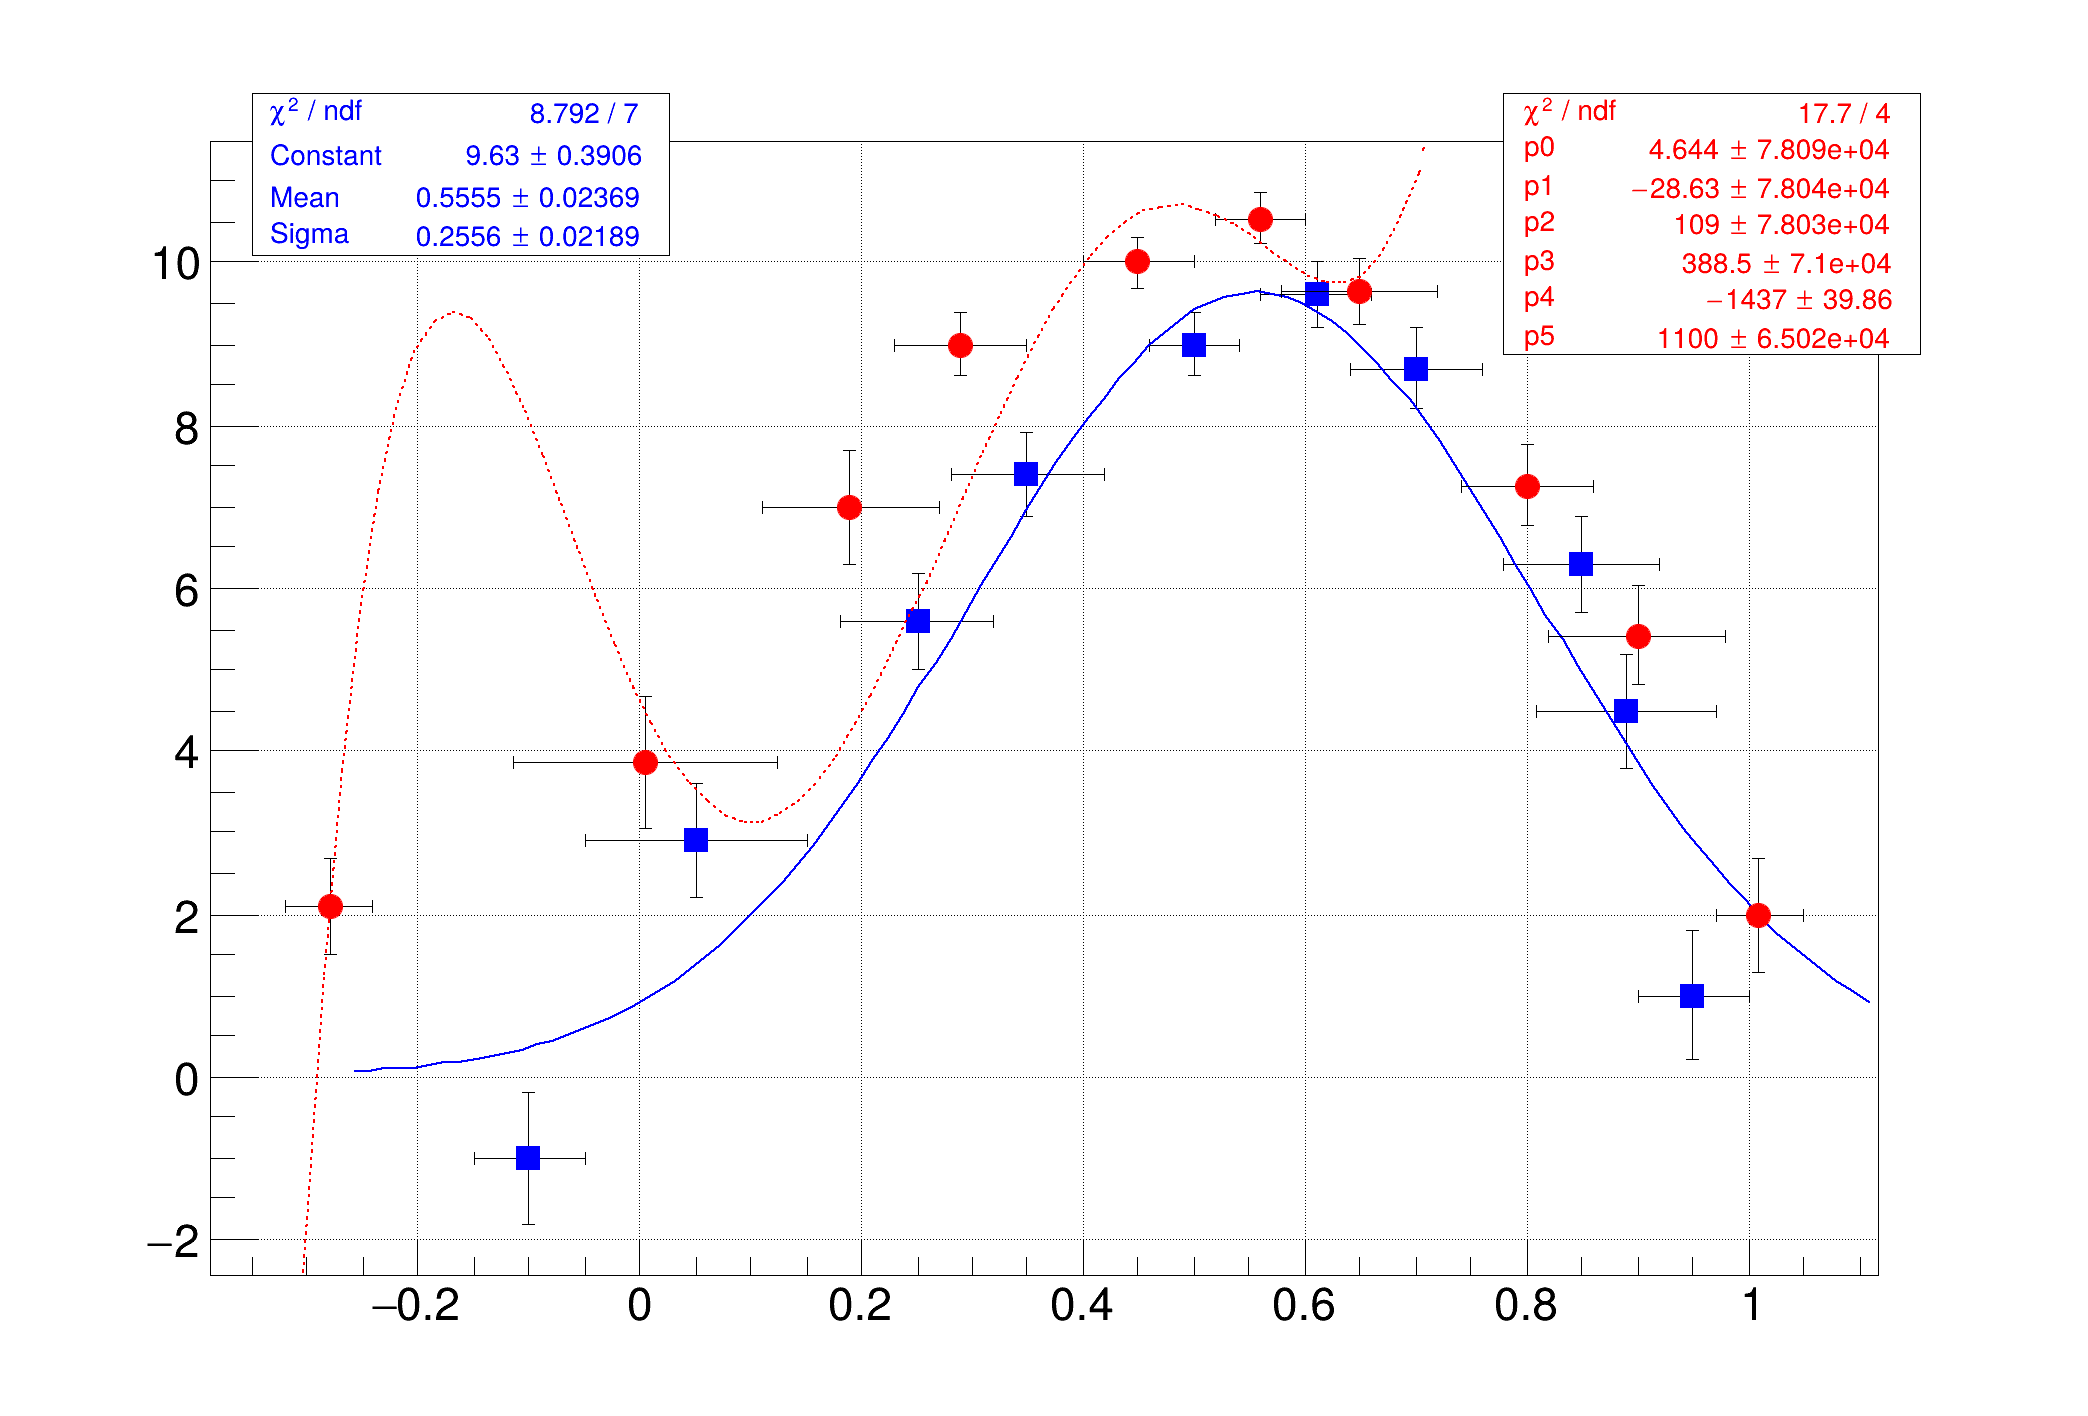
Detailed Description
Create and Draw a
TMultiGraph
.
void
multigraph
()
{
gStyle
->
SetOptFit
();
auto
c1
=
new
TCanvas
(
"c1"
,
"multigraph"
,700,500);
c1
->SetGrid();
// draw a frame to define the range
auto
mg =
new
TMultiGraph
();
// create first graph
const
Int_t
n1
= 10;
Double_t
px1[] = {-0.1, 0.05, 0.25, 0.35, 0.5, 0.61,0.7,0.85,0.89,0.95};
Double_t
py1[] = {-1,2.9,5.6,7.4,9,9.6,8.7,6.3,4.5,1};
Double_t
ex1
[] = {.05,.1,.07,.07,.04,.05,.06,.07,.08,.05};
Double_t
ey1
[] = {.8,.7,.6,.5,.4,.4,.5,.6,.7,.8};
auto
gr1
=
new
TGraphErrors
(
n1
,px1,py1,
ex1
,
ey1
);
gr1
->SetMarkerColor(
kBlue
);
gr1
->SetMarkerStyle(21);
gr1
->Fit(
"gaus"
,
"q"
);
auto
func1
= (
TF1
*)
gr1
->GetListOfFunctions()->FindObject(
"gaus"
);
func1
->SetLineColor(
kBlue
);
mg->Add(
gr1
);
// create second graph
const
Int_t
n2
= 10;
Float_t
x2
[] = {-0.28, 0.005, 0.19, 0.29, 0.45, 0.56,0.65,0.80,0.90,1.01};
Float_t
y2
[] = {2.1,3.86,7,9,10,10.55,9.64,7.26,5.42,2};
Float_t
ex2
[] = {.04,.12,.08,.06,.05,.04,.07,.06,.08,.04};
Float_t
ey2
[] = {.6,.8,.7,.4,.3,.3,.4,.5,.6,.7};
auto
gr2
=
new
TGraphErrors
(
n2
,
x2
,
y2
,
ex2
,
ey2
);
gr2
->SetMarkerColor(
kRed
);
gr2
->SetMarkerStyle(20);
gr2
->Fit(
"pol5"
,
"q"
);
auto
func2
= (
TF1
*)
gr2
->GetListOfFunctions()->FindObject(
"pol5"
);
func2
->SetLineColor(
kRed
);
func2
->SetLineStyle(2);
mg->Add(
gr2
);
mg->Draw(
"ap"
);
//force drawing of canvas to generate the fit TPaveStats
c1
->Update();
auto
stats1
= (
TPaveStats
*)
gr1
->GetListOfFunctions()->FindObject(
"stats"
);
auto
stats2
= (
TPaveStats
*)
gr2
->GetListOfFunctions()->FindObject(
"stats"
);
if
(
stats1
&&
stats2
) {
stats1
->SetTextColor(
kBlue
);
stats2
->SetTextColor(
kRed
);
stats1
->SetX1NDC(0.12);
stats1
->SetX2NDC(0.32);
stats1
->SetY1NDC(0.82);
stats2
->SetX1NDC(0.72);
stats2
->SetX2NDC(0.92);
stats2
->SetY1NDC(0.75);
c1
->Modified();
}
}
Int_t
int Int_t
Definition
RtypesCore.h:45
Float_t
float Float_t
Definition
RtypesCore.h:57
Double_t
double Double_t
Definition
RtypesCore.h:59
kRed
@ kRed
Definition
Rtypes.h:66
kBlue
@ kBlue
Definition
Rtypes.h:66
TRangeDynCast
ROOT::Detail::TRangeCast< T, true > TRangeDynCast
TRangeDynCast is an adapter class that allows the typed iteration through a TCollection.
Definition
TCollection.h:358
x2
Option_t Option_t TPoint TPoint const char x2
Definition
TGWin32VirtualXProxy.cxx:70
y2
Option_t Option_t TPoint TPoint const char y2
Definition
TGWin32VirtualXProxy.cxx:70
gStyle
R__EXTERN TStyle * gStyle
Definition
TStyle.h:436
ROOT::Detail::TRangeCast
Definition
TCollection.h:311
TCanvas
The Canvas class.
Definition
TCanvas.h:23
TF1
1-Dim function class
Definition
TF1.h:233
TGraphErrors
A TGraphErrors is a TGraph with error bars.
Definition
TGraphErrors.h:26
TMultiGraph
A TMultiGraph is a collection of TGraph (or derived) objects.
Definition
TMultiGraph.h:34
TPaveStats
The histogram statistics painter class.
Definition
TPaveStats.h:18
TStyle::SetOptFit
void SetOptFit(Int_t fit=1)
The type of information about fit parameters printed in the histogram statistics box can be selected ...
Definition
TStyle.cxx:1593
c1
return c1
Definition
legend1.C:41
Author
Rene Brun
Definition in file
multigraph.C
.
tutorials
graphs
multigraph.C
ROOT tags/v6-34-10 - Reference Guide Generated on Mon Jun 30 2025 10:56:44 (GVA Time) using Doxygen 1.10.0