Logo ROOT  
Reference Guide
 
Loading...
Searching...
No Matches
ratioplotOld.C File Reference

Detailed Description

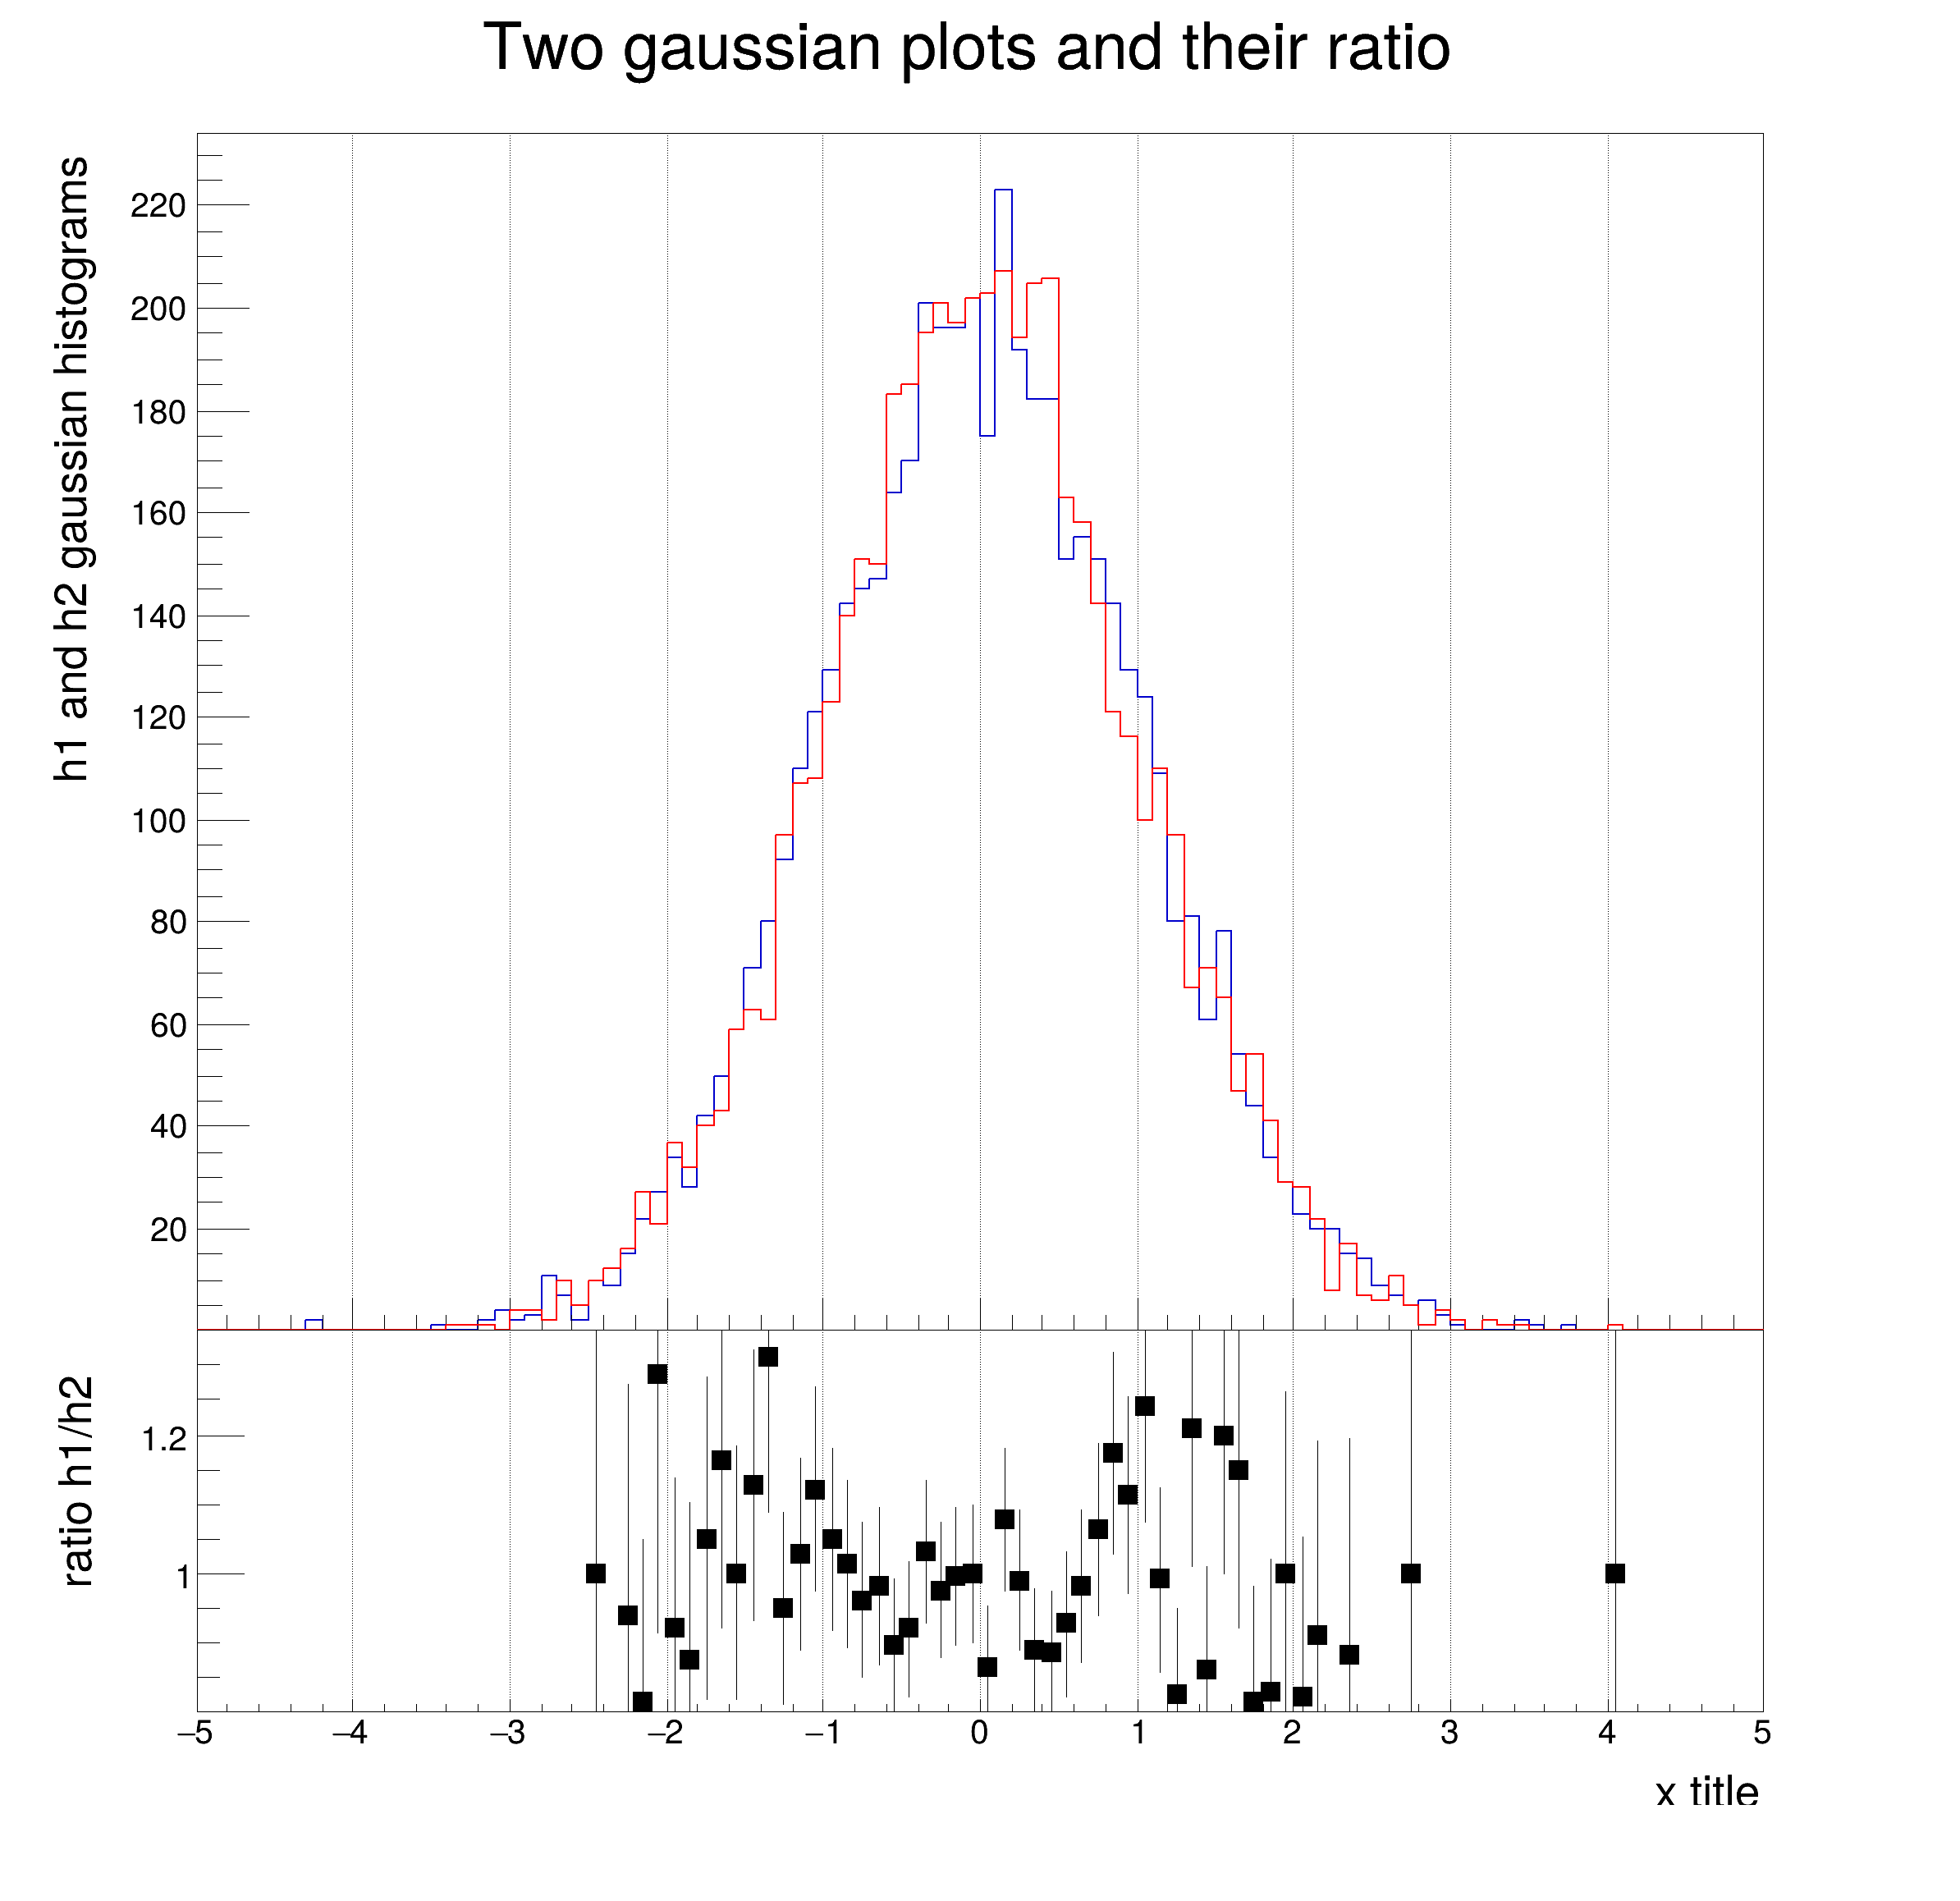
Example displaying two histograms and their ratio.

This macro does not use the class TRatioPlot. For ROOT version >= 6.08 TRatioPlot should be used. See the other ratio plots examples in this folder.

void ratioplotOld( ) {
// Define two gaussian histograms. Note the X and Y title are defined
// at booking time using the convention "Hist_title ; X_title ; Y_title"
TH1F *h1 = new TH1F("h1", "Two gaussian plots and their ratio;x title; h1 and h2 gaussian histograms", 100, -5, 5);
TH1F *h2 = new TH1F("h2", "h2", 100, -5, 5);
h1->FillRandom("gaus");
h2->FillRandom("gaus");
// Define the Canvas
TCanvas *c = new TCanvas("c", "canvas", 800, 800);
// Upper plot will be in pad1
TPad *pad1 = new TPad("pad1", "pad1", 0, 0.3, 1, 1.0);
pad1->SetBottomMargin(0); // Upper and lower plot are joined
pad1->SetGridx(); // Vertical grid
pad1->Draw(); // Draw the upper pad: pad1
pad1->cd(); // pad1 becomes the current pad
h1->SetStats(0); // No statistics on upper plot
h1->Draw(); // Draw h1
h2->Draw("same"); // Draw h2 on top of h1
#if ROOT_VERSION_CODE >= ROOT_VERSION(6,8,0)
// Avoid the first label (0) to be clipped.
TAxis *axis = h1->GetYaxis();
axis->ChangeLabel(1, -1, -1, -1, -1, -1, " ");
axis->SetLabelFont(43); // Absolute font size in pixel (precision 3)
axis->SetLabelSize(15);
#else
// Do not draw the Y axis label on the upper plot and redraw a small
// axis instead, in order to avoid the first label (0) to be clipped.
TGaxis *axis = new TGaxis( -5, 20, -5, 220, 20,220,510,"");
axis->SetLabelFont(43); // Absolute font size in pixel (precision 3)
axis->SetLabelSize(15);
axis->Draw();
#endif
// lower plot will be in pad
c->cd(); // Go back to the main canvas before defining pad2
TPad *pad2 = new TPad("pad2", "pad2", 0, 0.05, 1, 0.3);
pad2->SetTopMargin(0);
pad2->SetBottomMargin(0.2);
pad2->SetGridx(); // vertical grid
pad2->Draw();
pad2->cd(); // pad2 becomes the current pad
// Define the ratio plot
TH1F *h3 = (TH1F*)h1->Clone("h3");
h3->SetLineColor(kBlack);
h3->SetMinimum(0.8); // Define Y ..
h3->SetMaximum(1.35); // .. range
h3->Sumw2();
h3->SetStats(0); // No statistics on lower plot
h3->Divide(h2);
h3->SetMarkerStyle(21);
h3->Draw("ep"); // Draw the ratio plot
// h1 settings
// Y axis h1 plot settings
// h2 settings
h2->SetLineColor(kRed);
h2->SetLineWidth(2);
// Ratio plot (h3) settings
h3->SetTitle(""); // Remove the ratio title
// Y axis ratio plot settings
h3->GetYaxis()->SetTitle("ratio h1/h2 ");
h3->GetYaxis()->SetNdivisions(505);
h3->GetYaxis()->SetTitleSize(20);
h3->GetYaxis()->SetTitleFont(43);
h3->GetYaxis()->SetTitleOffset(1.55);
h3->GetYaxis()->SetLabelFont(43); // Absolute font size in pixel (precision 3)
h3->GetYaxis()->SetLabelSize(15);
// X axis ratio plot settings
h3->GetXaxis()->SetTitleSize(20);
h3->GetXaxis()->SetTitleFont(43);
h3->GetXaxis()->SetTitleOffset(1);
h3->GetXaxis()->SetLabelFont(43); // Absolute font size in pixel (precision 3)
h3->GetXaxis()->SetLabelSize(15);
}
#define c(i)
Definition RSha256.hxx:101
@ kRed
Definition Rtypes.h:66
@ kBlack
Definition Rtypes.h:65
@ kBlue
Definition Rtypes.h:66
virtual void SetTitleOffset(Float_t offset=1)
Set distance between the axis and the axis title.
Definition TAttAxis.cxx:298
virtual void SetLabelSize(Float_t size=0.04)
Set size of axis labels.
Definition TAttAxis.cxx:203
virtual void SetTitleFont(Style_t font=62)
Set the title font.
Definition TAttAxis.cxx:327
virtual void SetLabelFont(Style_t font=62)
Set labels' font.
Definition TAttAxis.cxx:180
virtual void SetTitleSize(Float_t size=0.04)
Set size of axis title.
Definition TAttAxis.cxx:309
virtual void SetLineWidth(Width_t lwidth)
Set the line width.
Definition TAttLine.h:43
virtual void SetLineColor(Color_t lcolor)
Set the line color.
Definition TAttLine.h:40
virtual void SetBottomMargin(Float_t bottommargin)
Set Pad bottom margin in fraction of the pad height.
Definition TAttPad.cxx:99
virtual void SetTopMargin(Float_t topmargin)
Set Pad top margin in fraction of the pad height.
Definition TAttPad.cxx:129
Class to manage histogram axis.
Definition TAxis.h:31
void ChangeLabel(Int_t labNum=0, Double_t labAngle=-1., Double_t labSize=-1., Int_t labAlign=-1, Int_t labColor=-1, Int_t labFont=-1, const TString &labText="")
Define new text attributes for the label number "labNum".
Definition TAxis.cxx:961
The Canvas class.
Definition TCanvas.h:23
The axis painter class.
Definition TGaxis.h:24
void SetLabelFont(Int_t labelfont)
Definition TGaxis.h:105
void SetLabelSize(Float_t labelsize)
Definition TGaxis.h:107
1-D histogram with a float per channel (see TH1 documentation)
Definition TH1.h:621
virtual void FillRandom(const char *fname, Int_t ntimes=5000, TRandom *rng=nullptr)
Fill histogram following distribution in function fname.
Definition TH1.cxx:3519
TAxis * GetYaxis()
Definition TH1.h:325
void Draw(Option_t *option="") override
Draw this histogram with options.
Definition TH1.cxx:3066
TObject * Clone(const char *newname="") const override
Make a complete copy of the underlying object.
Definition TH1.cxx:2752
virtual void SetStats(Bool_t stats=kTRUE)
Set statistics option on/off.
Definition TH1.cxx:8958
virtual void Draw(Option_t *option="")
Default Draw method for all objects.
Definition TObject.cxx:274
The most important graphics class in the ROOT system.
Definition TPad.h:28
void SetGridx(Int_t value=1) override
Definition TPad.h:333
TVirtualPad * cd(Int_t subpadnumber=0) override
Set Current pad.
Definition TPad.cxx:597
void Draw(Option_t *option="") override
Draw Pad in Current pad (re-parent pad if necessary).
Definition TPad.cxx:1268
TH1F * h1
Definition legend1.C:5
Author
Olivier Couet

Definition in file ratioplotOld.C.