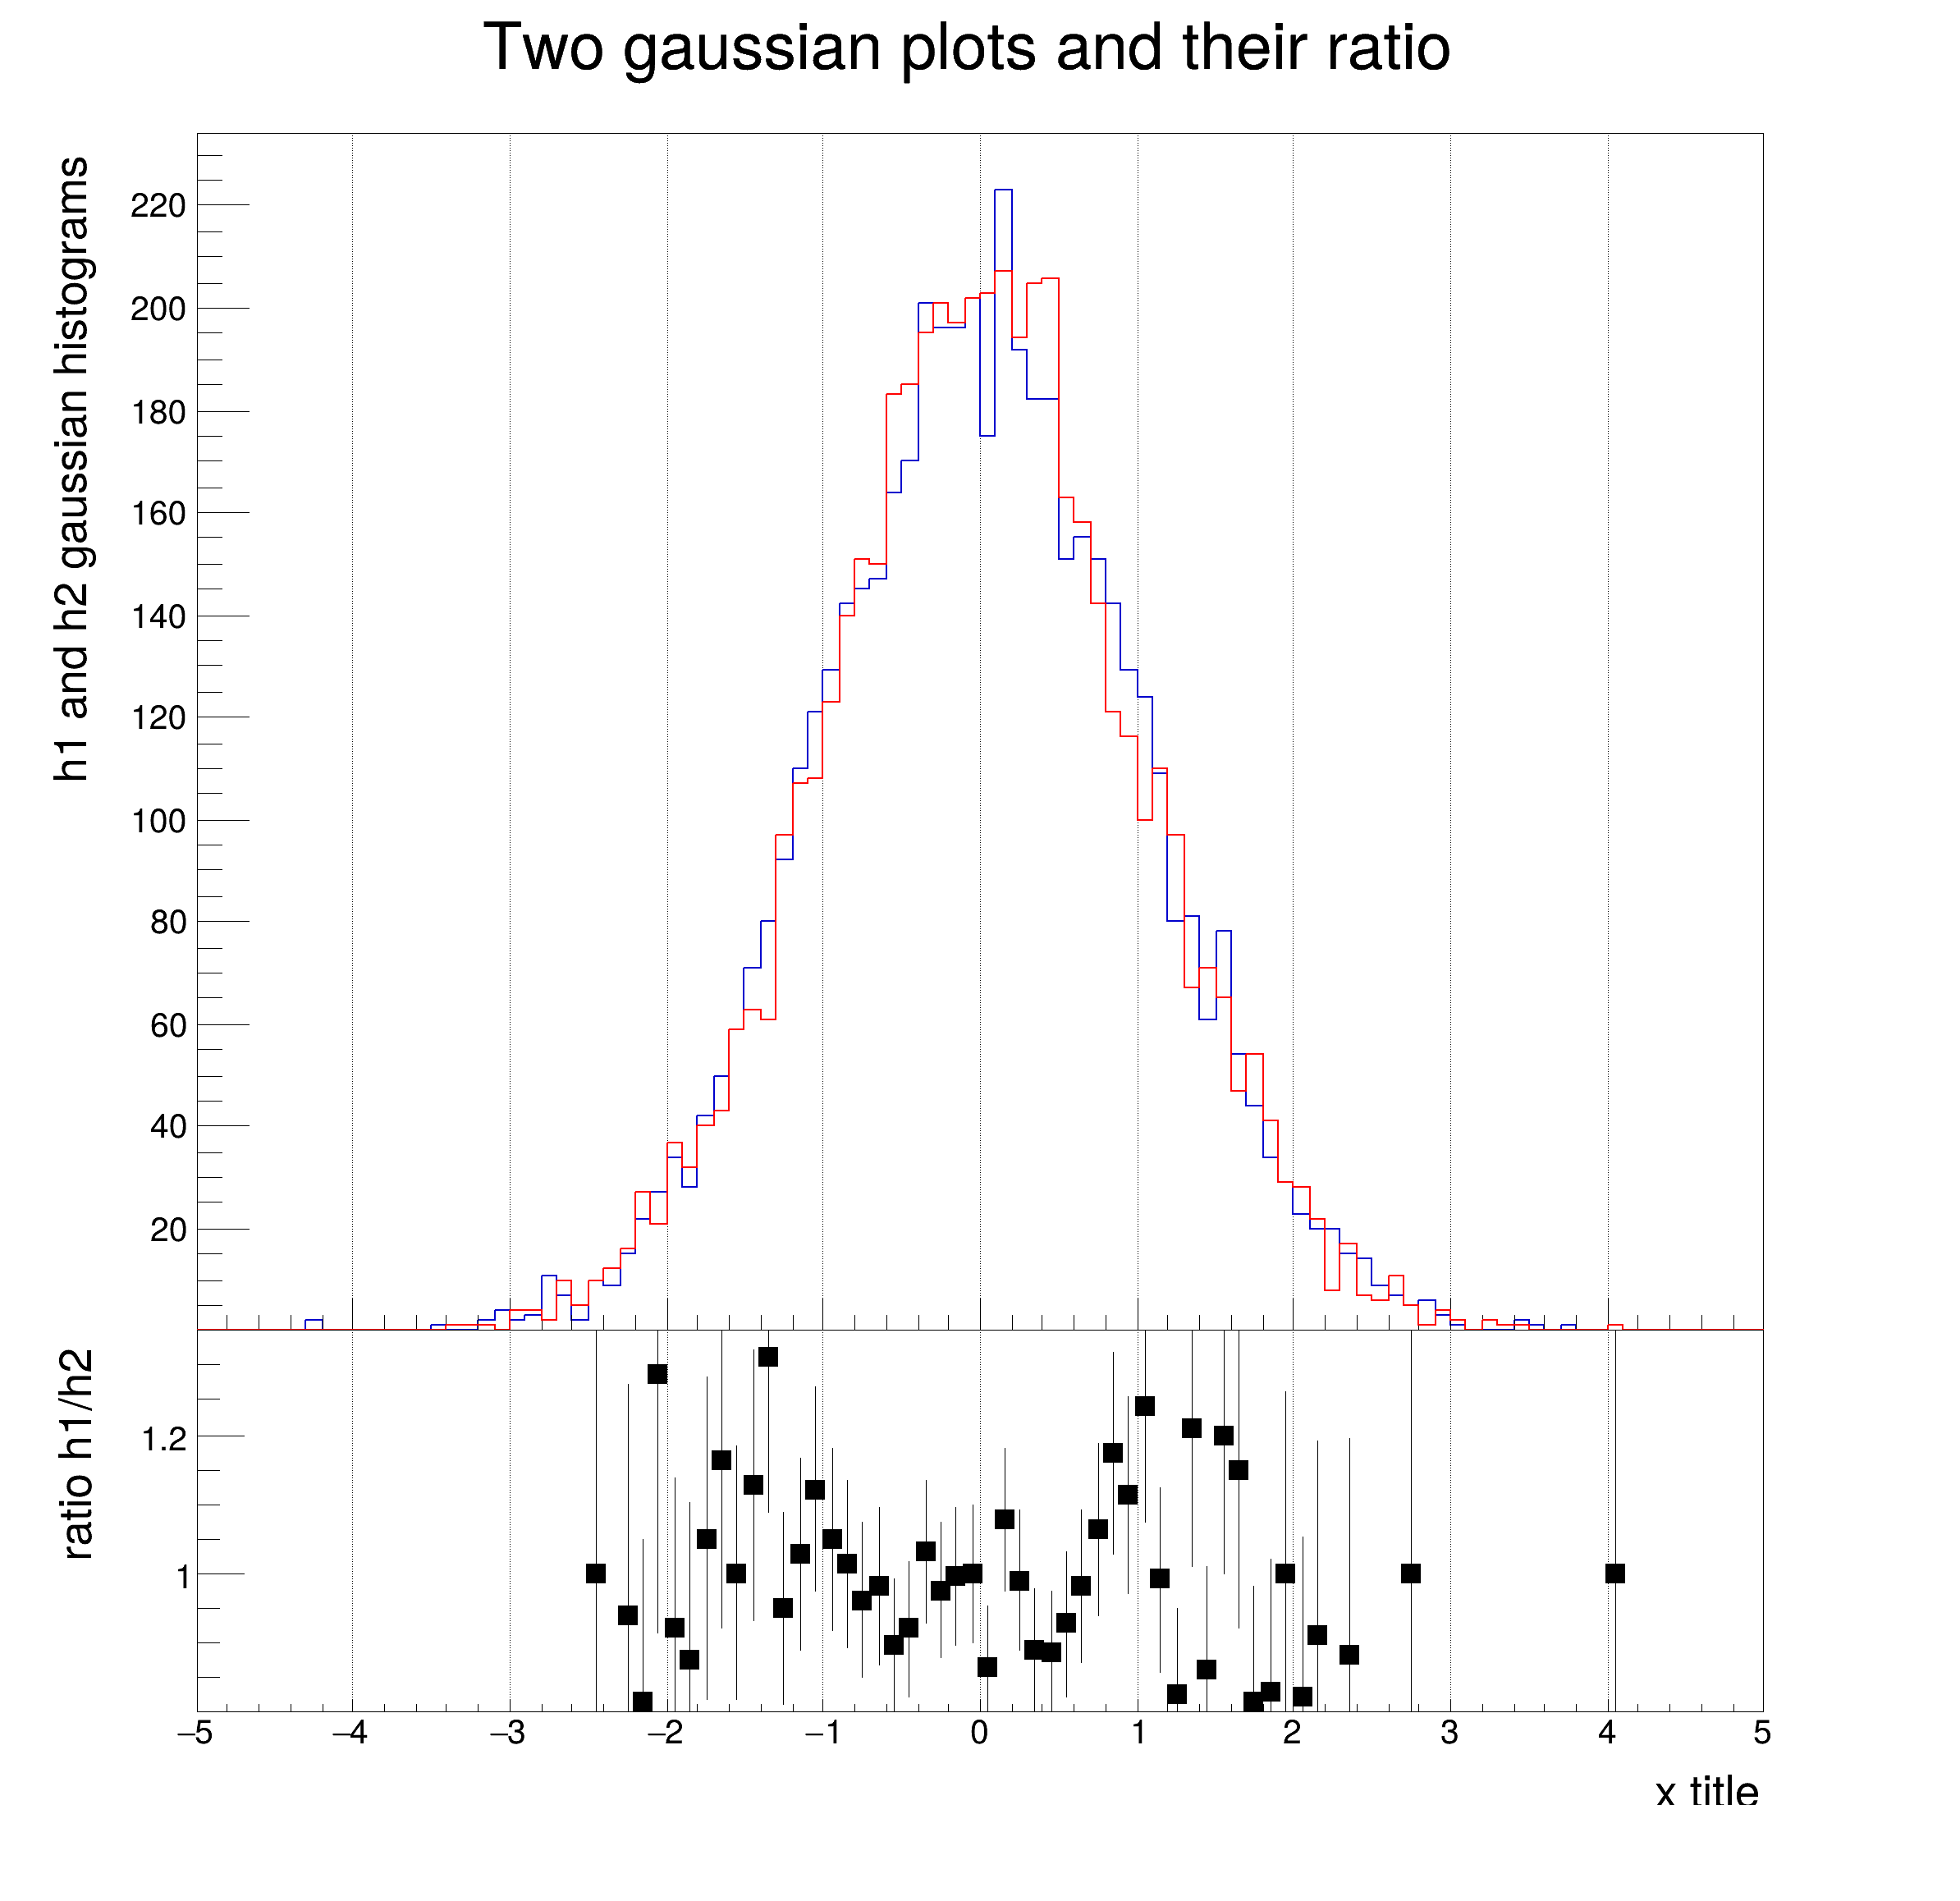
Example displaying two histograms and their ratio.
void ratioplot()
{
TH1F *
h1 =
new TH1F(
"h1",
"Two gaussian plots and their ratio;x title; h1 and h2 gaussian histograms", 100, -5, 5);
TH1F *h2 =
new TH1F(
"h2",
"h2", 100, -5, 5);
h2->FillRandom("gaus");
pad1->SetBottomMargin(0);
h2->Draw("same");
#if ROOT_VERSION_CODE >= ROOT_VERSION(6, 8, 0)
#else
TGaxis *axis =
new TGaxis(-5, 20, -5, 220, 20, 220, 510,
"");
#endif
pad2->SetBottomMargin(0.2);
h3->SetMinimum(0.8);
h3->SetMaximum(1.35);
h3->Sumw2();
h3->SetStats(0);
h3->Divide(h2);
h3->SetMarkerStyle(21);
h3->Draw("ep");
h2->SetLineWidth(2);
h3->SetTitle("");
h3->GetYaxis()->SetTitle("ratio h1/h2 ");
h3->GetYaxis()->SetNdivisions(505);
h3->GetYaxis()->SetTitleSize(20);
h3->GetYaxis()->SetTitleFont(43);
h3->GetYaxis()->SetTitleOffset(1.55);
h3->GetYaxis()->SetLabelFont(43);
h3->GetYaxis()->SetLabelSize(15);
h3->GetXaxis()->SetTitleSize(20);
h3->GetXaxis()->SetTitleFont(43);
h3->GetXaxis()->SetTitleOffset(1);
h3->GetXaxis()->SetLabelFont(43);
h3->GetXaxis()->SetLabelSize(15);
}
virtual void SetTitleOffset(Float_t offset=1)
Set distance between the axis and the axis title.
virtual void SetLabelSize(Float_t size=0.04)
Set size of axis labels.
virtual void SetTitleFont(Style_t font=62)
Set the title font.
virtual void SetLabelFont(Style_t font=62)
Set labels' font.
virtual void SetTitleSize(Float_t size=0.04)
Set size of axis title.
virtual void SetLineWidth(Width_t lwidth)
Set the line width.
virtual void SetLineColor(Color_t lcolor)
Set the line color.
Class to manage histogram axis.
void ChangeLabel(Int_t labNum=0, Double_t labAngle=-1., Double_t labSize=-1., Int_t labAlign=-1, Int_t labColor=-1, Int_t labFont=-1, const TString &labText="")
Define new text attributes for the label number "labNum".
void SetLabelFont(Int_t labelfont)
void SetLabelSize(Float_t labelsize)
1-D histogram with a float per channel (see TH1 documentation)
virtual void FillRandom(TF1 *f1, Int_t ntimes=5000, TRandom *rng=nullptr)
void Draw(Option_t *option="") override
Draw this histogram with options.
TObject * Clone(const char *newname="") const override
Make a complete copy of the underlying object.
virtual void SetStats(Bool_t stats=kTRUE)
Set statistics option on/off.
virtual void Draw(Option_t *option="")
Default Draw method for all objects.
The most important graphics class in the ROOT system.
