Logo ROOT  
Reference Guide
 
Loading...
Searching...
No Matches
rf608_fitresultaspdf.C File Reference

Detailed Description

View in nbviewer Open in SWAN
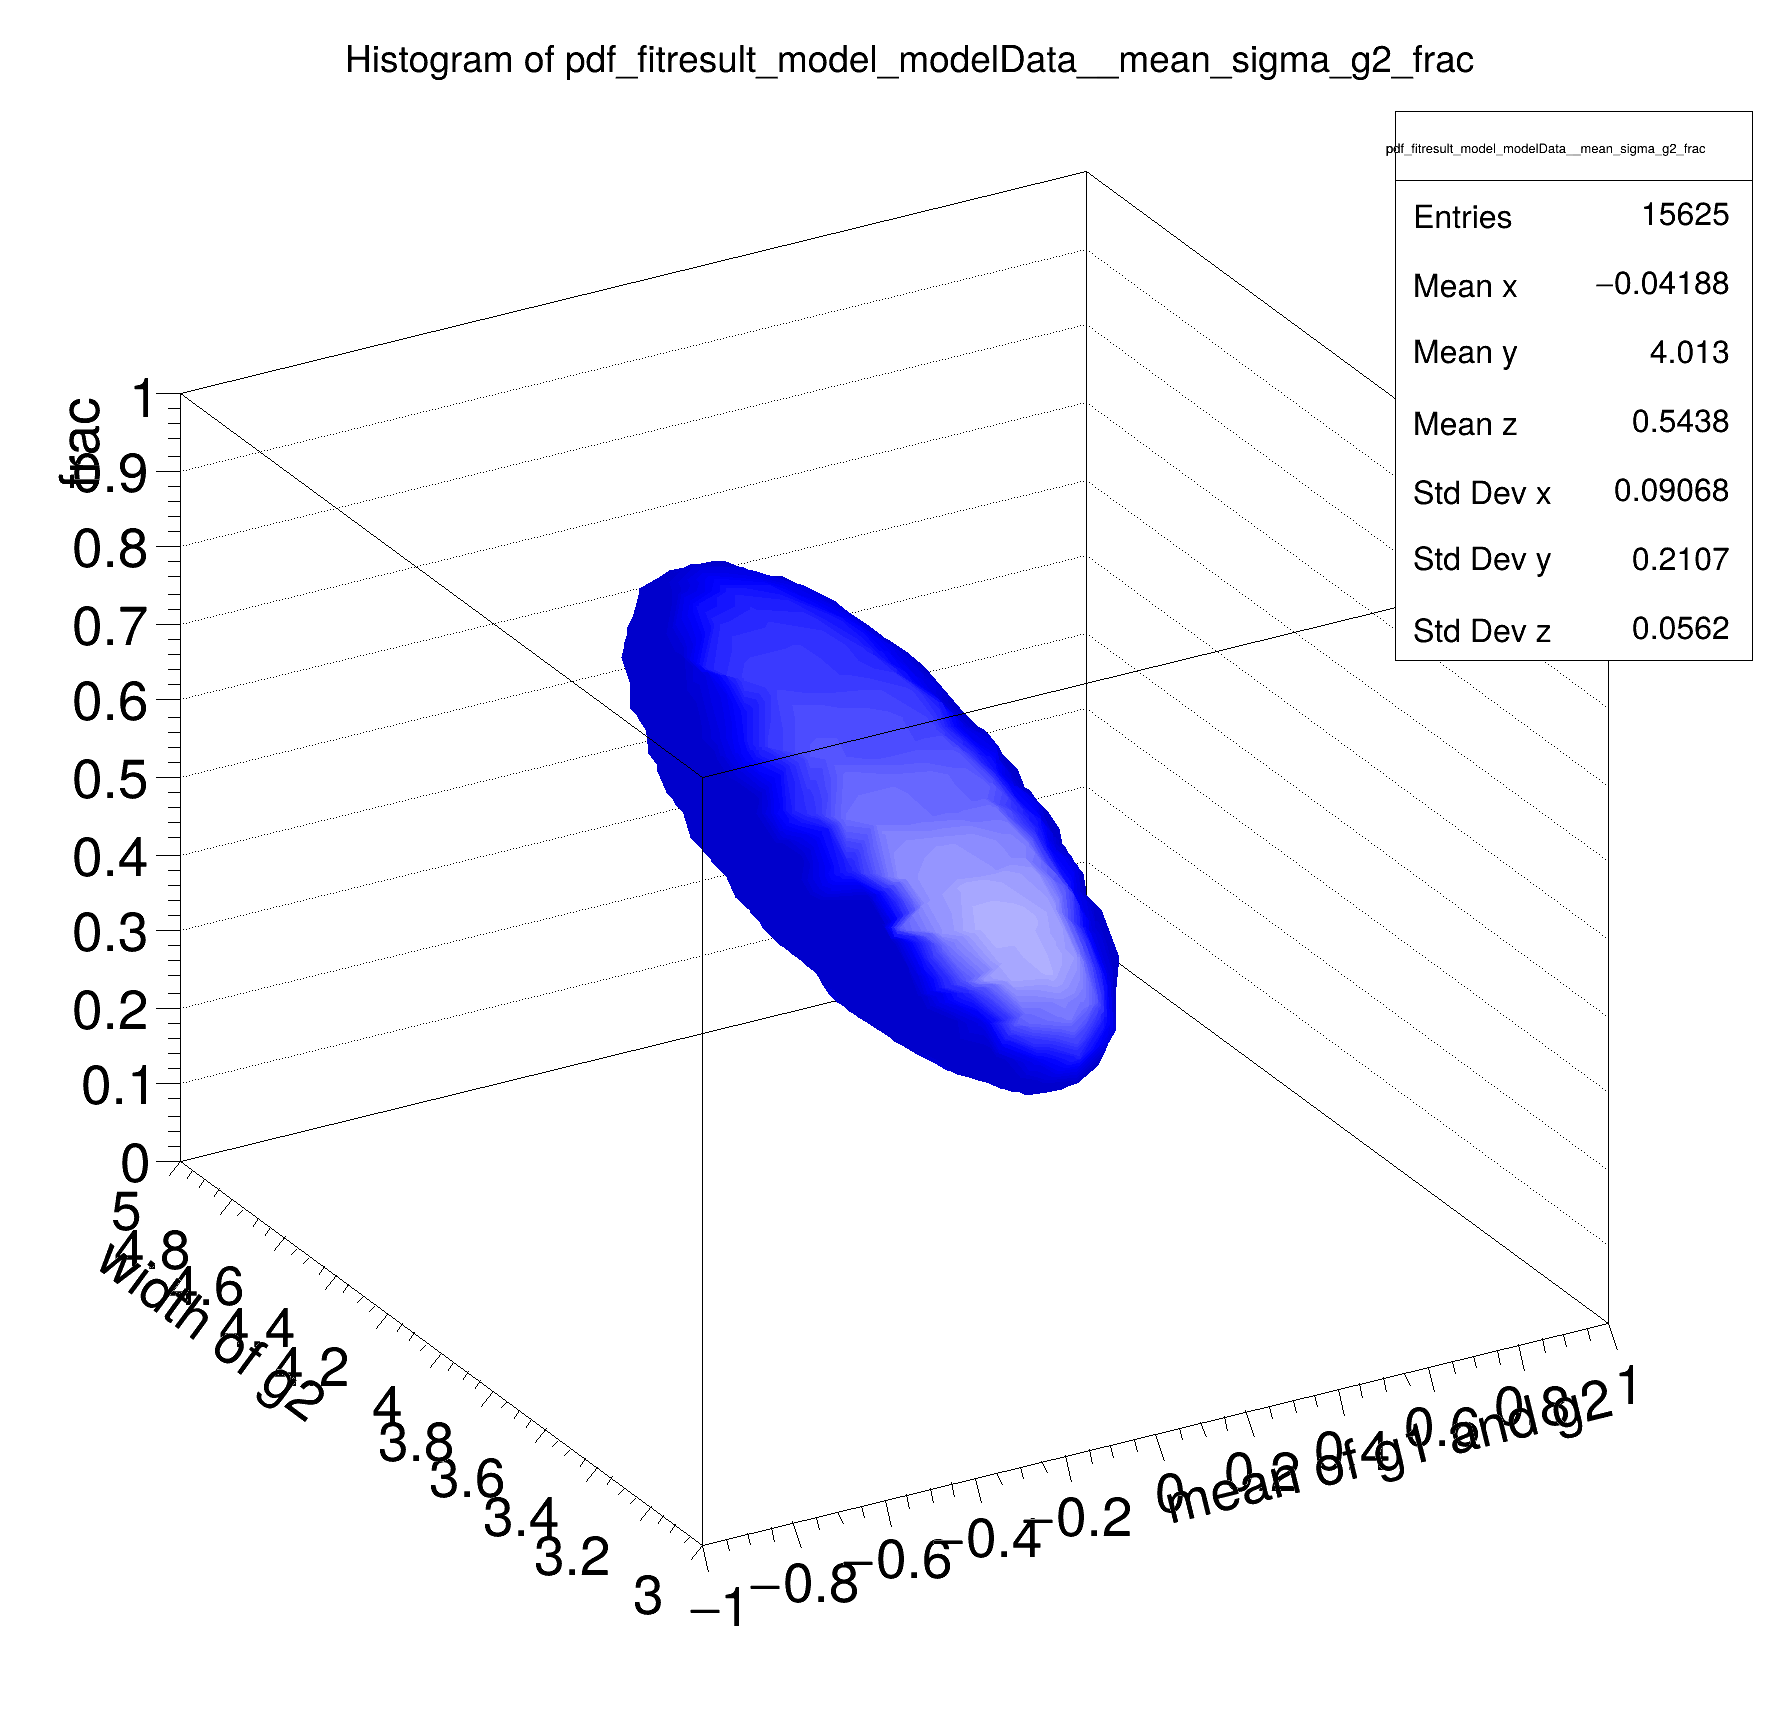
Likelihood and minimization: representing the parabolic approximation of the fit as a multi-variate Gaussian on the parameters of the fitted pdf

#include "RooRealVar.h"
#include "RooDataSet.h"
#include "RooGaussian.h"
#include "RooAddPdf.h"
#include "RooChebychev.h"
#include "RooFitResult.h"
#include "TCanvas.h"
#include "TAxis.h"
#include "RooPlot.h"
#include "TFile.h"
#include "TStyle.h"
#include "TH2.h"
#include "TH3.h"
using namespace RooFit;
{
// C r e a t e m o d e l a n d d a t a s e t
// -----------------------------------------------
// Observable
RooRealVar x("x", "x", -20, 20);
// Model (intentional strong correlations)
RooRealVar mean("mean", "mean of g1 and g2", 0, -1, 1);
RooRealVar sigma_g1("sigma_g1", "width of g1", 2);
RooGaussian g1("g1", "g1", x, mean, sigma_g1);
RooRealVar sigma_g2("sigma_g2", "width of g2", 4, 3.0, 5.0);
RooGaussian g2("g2", "g2", x, mean, sigma_g2);
RooRealVar frac("frac", "frac", 0.5, 0.0, 1.0);
RooAddPdf model("model", "model", RooArgList(g1, g2), frac);
// Generate 1000 events
std::unique_ptr<RooDataSet> data{model.generate(x, 1000)};
// F i t m o d e l t o d a t a
// ----------------------------------
std::unique_ptr<RooFitResult> r{model.fitTo(*data, Save(), PrintLevel(-1))};
// C r e a t e M V G a u s s i a n p d f o f f i t t e d p a r a m e t e r s
// ------------------------------------------------------------------------------------
RooAbsPdf *parabPdf = r->createHessePdf(RooArgSet(frac, mean, sigma_g2));
// S o m e e x e c e r c i s e s w i t h t h e p a r a m e t e r p d f
// -----------------------------------------------------------------------------
// Generate 100K points in the parameter space, sampled from the MVGaussian pdf
std::unique_ptr<RooDataSet> d{parabPdf->generate({mean, sigma_g2, frac}, 100000)};
// Sample a 3-D histogram of the pdf to be visualized as an error ellipsoid using the GLISO draw option
TH3 *hh_3d = (TH3 *)parabPdf->createHistogram("mean,sigma_g2,frac", 25, 25, 25);
// Project 3D parameter pdf down to 3 permutations of two-dimensional pdfs
// The integrations corresponding to these projections are performed analytically
// by the MV Gaussian pdf
RooAbsPdf *pdf_sigmag2_frac = parabPdf->createProjection(mean);
RooAbsPdf *pdf_mean_frac = parabPdf->createProjection(sigma_g2);
RooAbsPdf *pdf_mean_sigmag2 = parabPdf->createProjection(frac);
// Make 2D plots of the 3 two-dimensional pdf projections
TH2 *hh_sigmag2_frac = (TH2 *)pdf_sigmag2_frac->createHistogram("sigma_g2,frac", 50, 50);
TH2 *hh_mean_frac = (TH2 *)pdf_mean_frac->createHistogram("mean,frac", 50, 50);
TH2 *hh_mean_sigmag2 = (TH2 *)pdf_mean_sigmag2->createHistogram("mean,sigma_g2", 50, 50);
hh_mean_frac->SetLineColor(kBlue);
hh_sigmag2_frac->SetLineColor(kBlue);
hh_mean_sigmag2->SetLineColor(kBlue);
// Draw the 'sigar'
new TCanvas("rf608_fitresultaspdf_1", "rf608_fitresultaspdf_1", 600, 600);
hh_3d->Draw("iso");
// Draw the 2D projections of the 3D pdf
TCanvas *c2 = new TCanvas("rf608_fitresultaspdf_2", "rf608_fitresultaspdf_2", 900, 600);
c2->Divide(3, 2);
c2->cd(1);
gPad->SetLeftMargin(0.15);
hh_mean_sigmag2->GetZaxis()->SetTitleOffset(1.4);
hh_mean_sigmag2->Draw("surf3");
c2->cd(2);
gPad->SetLeftMargin(0.15);
hh_sigmag2_frac->GetZaxis()->SetTitleOffset(1.4);
hh_sigmag2_frac->Draw("surf3");
c2->cd(3);
gPad->SetLeftMargin(0.15);
hh_mean_frac->GetZaxis()->SetTitleOffset(1.4);
hh_mean_frac->Draw("surf3");
// Draw the distributions of parameter points sampled from the pdf
TH1 *tmp1 = d->createHistogram("mean,sigma_g2", Binning(50), Binning(50));
TH1 *tmp2 = d->createHistogram("sigma_g2,frac", Binning(50), Binning(50));
TH1 *tmp3 = d->createHistogram("mean,frac", Binning(50), Binning(50));
c2->cd(4);
gPad->SetLeftMargin(0.15);
tmp1->GetZaxis()->SetTitleOffset(1.4);
tmp1->Draw("lego3");
c2->cd(5);
gPad->SetLeftMargin(0.15);
tmp2->GetZaxis()->SetTitleOffset(1.4);
tmp2->Draw("lego3");
c2->cd(6);
gPad->SetLeftMargin(0.15);
tmp3->GetZaxis()->SetTitleOffset(1.4);
tmp3->Draw("lego3");
}
#define d(i)
Definition RSha256.hxx:102
@ kBlue
Definition Rtypes.h:66
Option_t Option_t TPoint TPoint const char GetTextMagnitude GetFillStyle GetLineColor GetLineWidth GetMarkerStyle GetTextAlign GetTextColor GetTextSize void data
Option_t Option_t TPoint TPoint const char GetTextMagnitude GetFillStyle GetLineColor GetLineWidth GetMarkerStyle GetTextAlign GetTextColor GetTextSize void char Point_t Rectangle_t WindowAttributes_t Float_t r
#define gPad
Abstract interface for all probability density functions.
Definition RooAbsPdf.h:40
RooFit::OwningPtr< RooDataSet > generate(const RooArgSet &whatVars, Int_t nEvents, const RooCmdArg &arg1, const RooCmdArg &arg2={}, const RooCmdArg &arg3={}, const RooCmdArg &arg4={}, const RooCmdArg &arg5={})
See RooAbsPdf::generate(const RooArgSet&,const RooCmdArg&,const RooCmdArg&,const RooCmdArg&,...
Definition RooAbsPdf.h:57
virtual RooAbsPdf * createProjection(const RooArgSet &iset)
Return a p.d.f that represent a projection of this p.d.f integrated over given observables.
TH1 * createHistogram(RooStringView varNameList, Int_t xbins=0, Int_t ybins=0, Int_t zbins=0) const
Create and fill a ROOT histogram TH1, TH2 or TH3 with the values of this function for the variables w...
Efficient implementation of a sum of PDFs of the form.
Definition RooAddPdf.h:33
RooArgList is a container object that can hold multiple RooAbsArg objects.
Definition RooArgList.h:22
RooArgSet is a container object that can hold multiple RooAbsArg objects.
Definition RooArgSet.h:55
Plain Gaussian p.d.f.
Definition RooGaussian.h:24
Variable that can be changed from the outside.
Definition RooRealVar.h:37
virtual void SetTitleOffset(Float_t offset=1)
Set distance between the axis and the axis title.
Definition TAttAxis.cxx:298
virtual void SetFillColor(Color_t fcolor)
Set the fill area color.
Definition TAttFill.h:37
virtual void SetLineColor(Color_t lcolor)
Set the line color.
Definition TAttLine.h:40
The Canvas class.
Definition TCanvas.h:23
TH1 is the base class of all histogram classes in ROOT.
Definition TH1.h:59
TAxis * GetZaxis()
Definition TH1.h:326
void Draw(Option_t *option="") override
Draw this histogram with options.
Definition TH1.cxx:3066
Service class for 2-D histogram classes.
Definition TH2.h:30
The 3-D histogram classes derived from the 1-D histogram classes.
Definition TH3.h:31
RooCmdArg Binning(const RooAbsBinning &binning)
Double_t x[n]
Definition legend1.C:17
return c2
Definition legend2.C:14
The namespace RooFit contains mostly switches that change the behaviour of functions of PDFs (or othe...
Definition JSONIO.h:26
[#0] WARNING:InputArguments -- The parameter 'sigma_g1' with range [-inf, inf] of the RooGaussian 'g1' exceeds the safe range of (0, inf). Advise to limit its range.
[#1] INFO:Fitting -- RooAbsPdf::fitTo(model) fixing normalization set for coefficient determination to observables in data
[#1] INFO:Fitting -- using CPU computation library compiled with -mavx2
[#1] INFO:Fitting -- RooAddition::defaultErrorLevel(nll_model_modelData) Summation contains a RooNLLVar, using its error level
[#1] INFO:Minimization -- RooAbsMinimizerFcn::setOptimizeConst: activating const optimization
[#1] INFO:Minimization -- RooAbsMinimizerFcn::setOptimizeConst: deactivating const optimization
Date
July 2008
Author
Wouter Verkerke

Definition in file rf608_fitresultaspdf.C.