
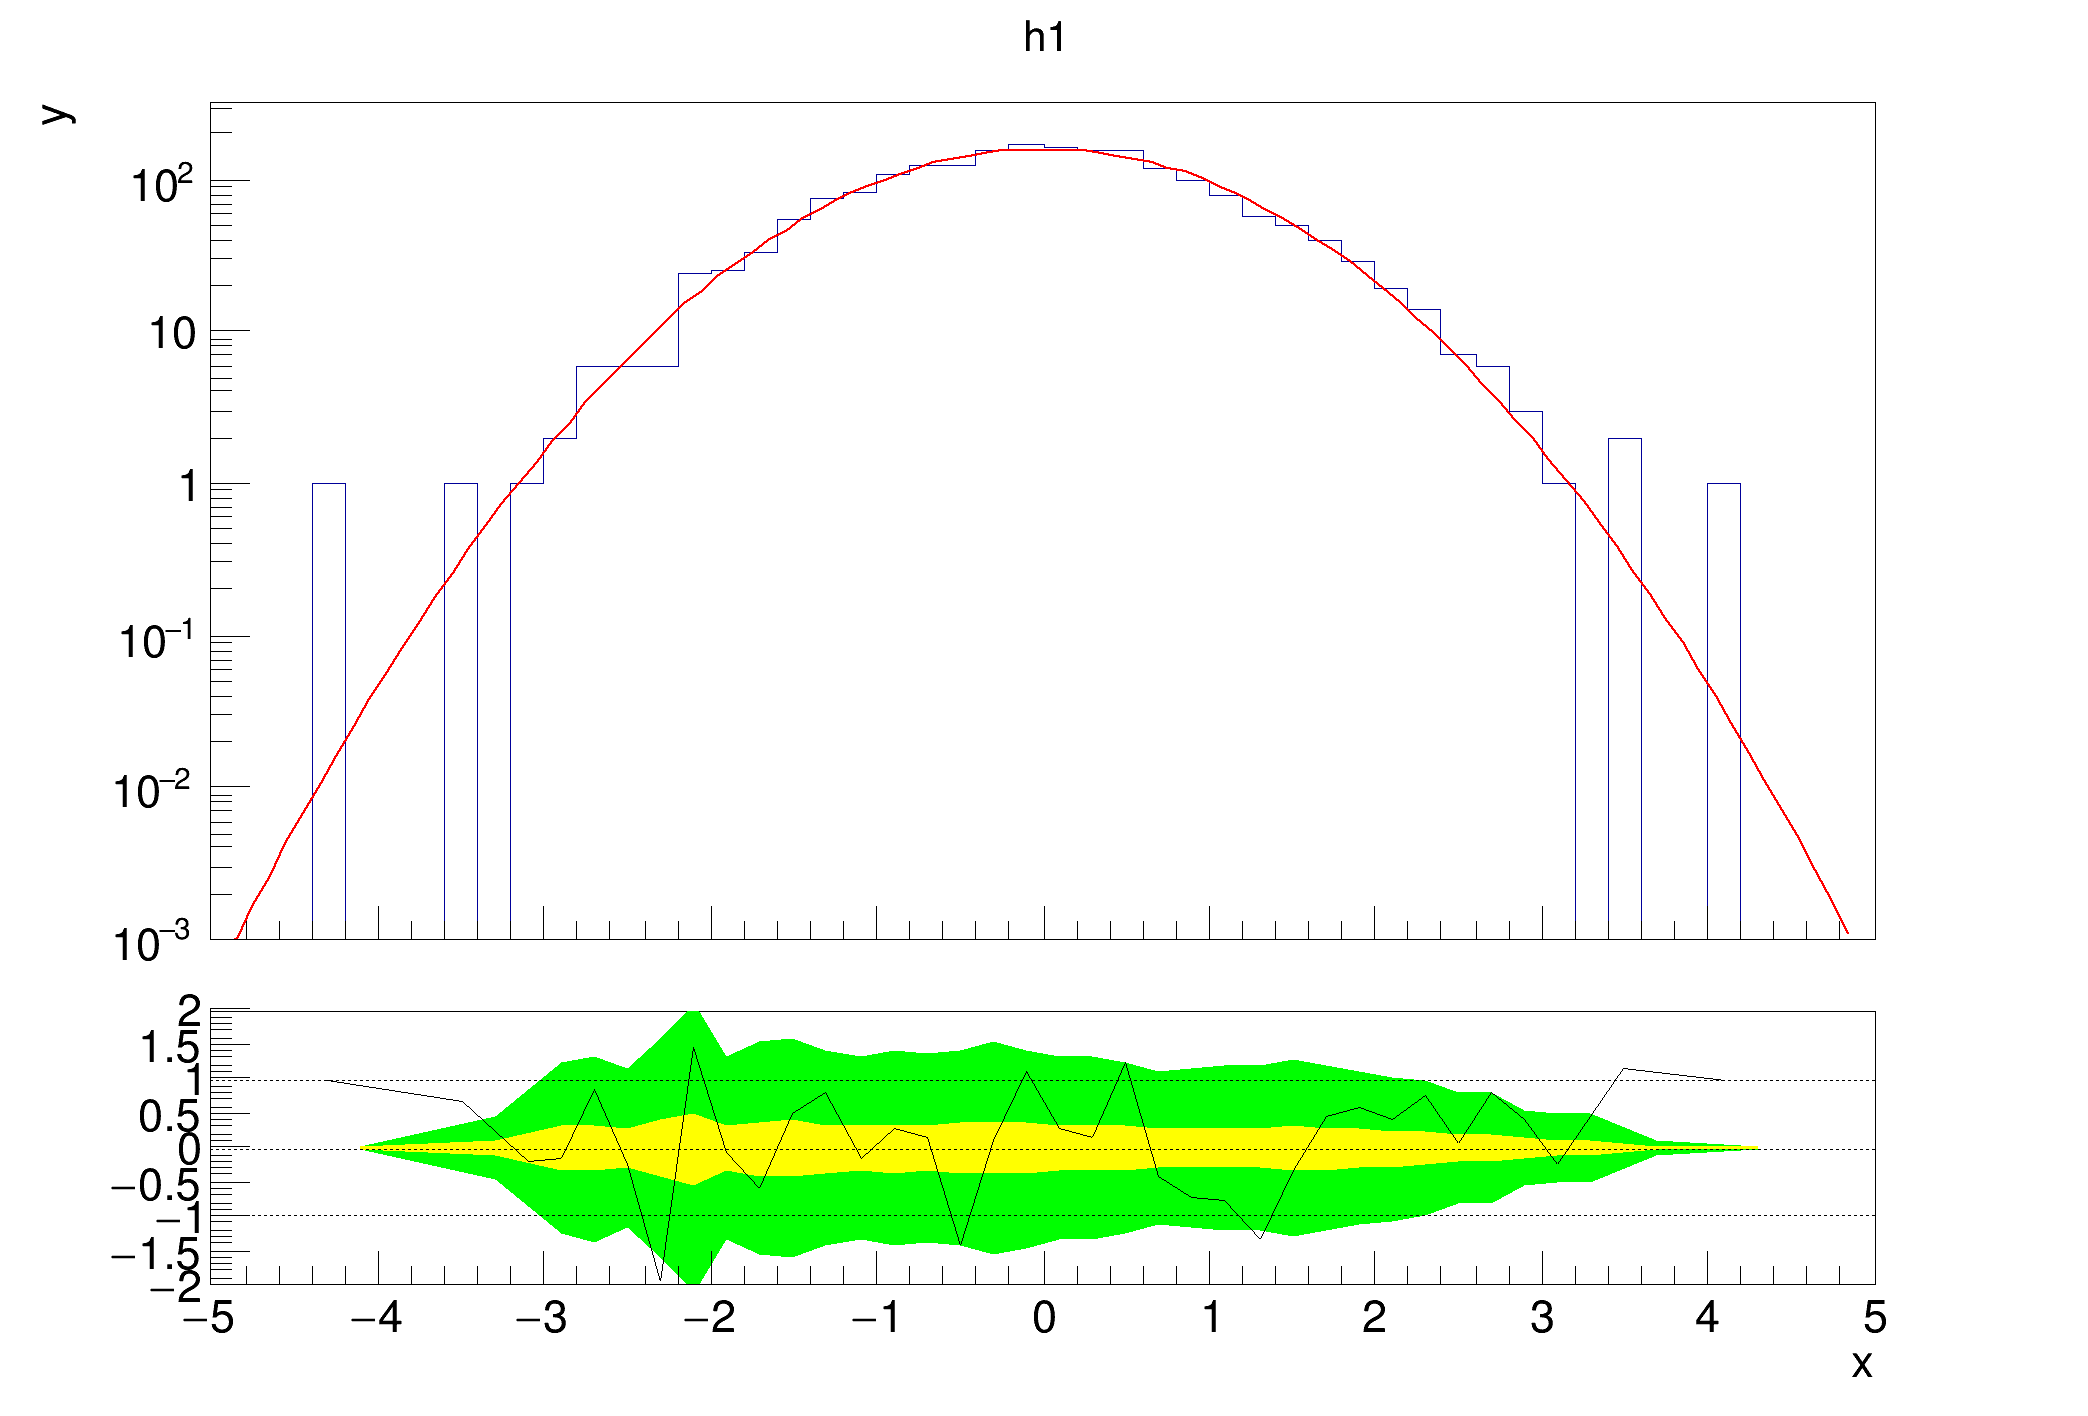
 Example which shows how you can get the graph of the lower plot and set the y axis range for it.
Since the lower plot is not created until TRatioPlot::Draw is called, you can only use the method afterwards.
auto c1 =
new TCanvas(
"c1",
"fit residual simple");
auto h1 =
new TH1D(
"h1",
"h1", 50, -5, 5);
rp1->Draw();
rp1->GetLowerRefGraph()->SetMinimum(-2);
rp1->GetLowerRefGraph()->SetMaximum(2);
}
R__EXTERN TStyle * gStyle
1-D histogram with a double per channel (see TH1 documentation)}
virtual void FillRandom(const char *fname, Int_t ntimes=5000)
Fill histogram following distribution in function fname.
TAxis * GetXaxis()
Get the behaviour adopted by the object about the statoverflows. See EStatOverflows for more informat...
virtual TFitResultPtr Fit(const char *formula, Option_t *option="", Option_t *goption="", Double_t xmin=0, Double_t xmax=0)
Fit histogram with function fname.
virtual void SetMinimum(Double_t minimum=-1111)
virtual void SetTitle(const char *title="")
Set the title of the TNamed.
Class for displaying ratios, differences and fit residuals.
void SetOptStat(Int_t stat=1)
The type of information printed in the histogram statistics box can be selected via the parameter mod...
- Author
- Paul Gessinger
Definition in file ratioplot3.C.


