Loading [MathJax]/extensions/tex2jax.js
Logo ROOT  
Reference Guide
All Classes Namespaces Files Functions Variables Typedefs Enumerations Enumerator Properties Friends Macros Modules Pages
xyplot.C File Reference

Detailed Description

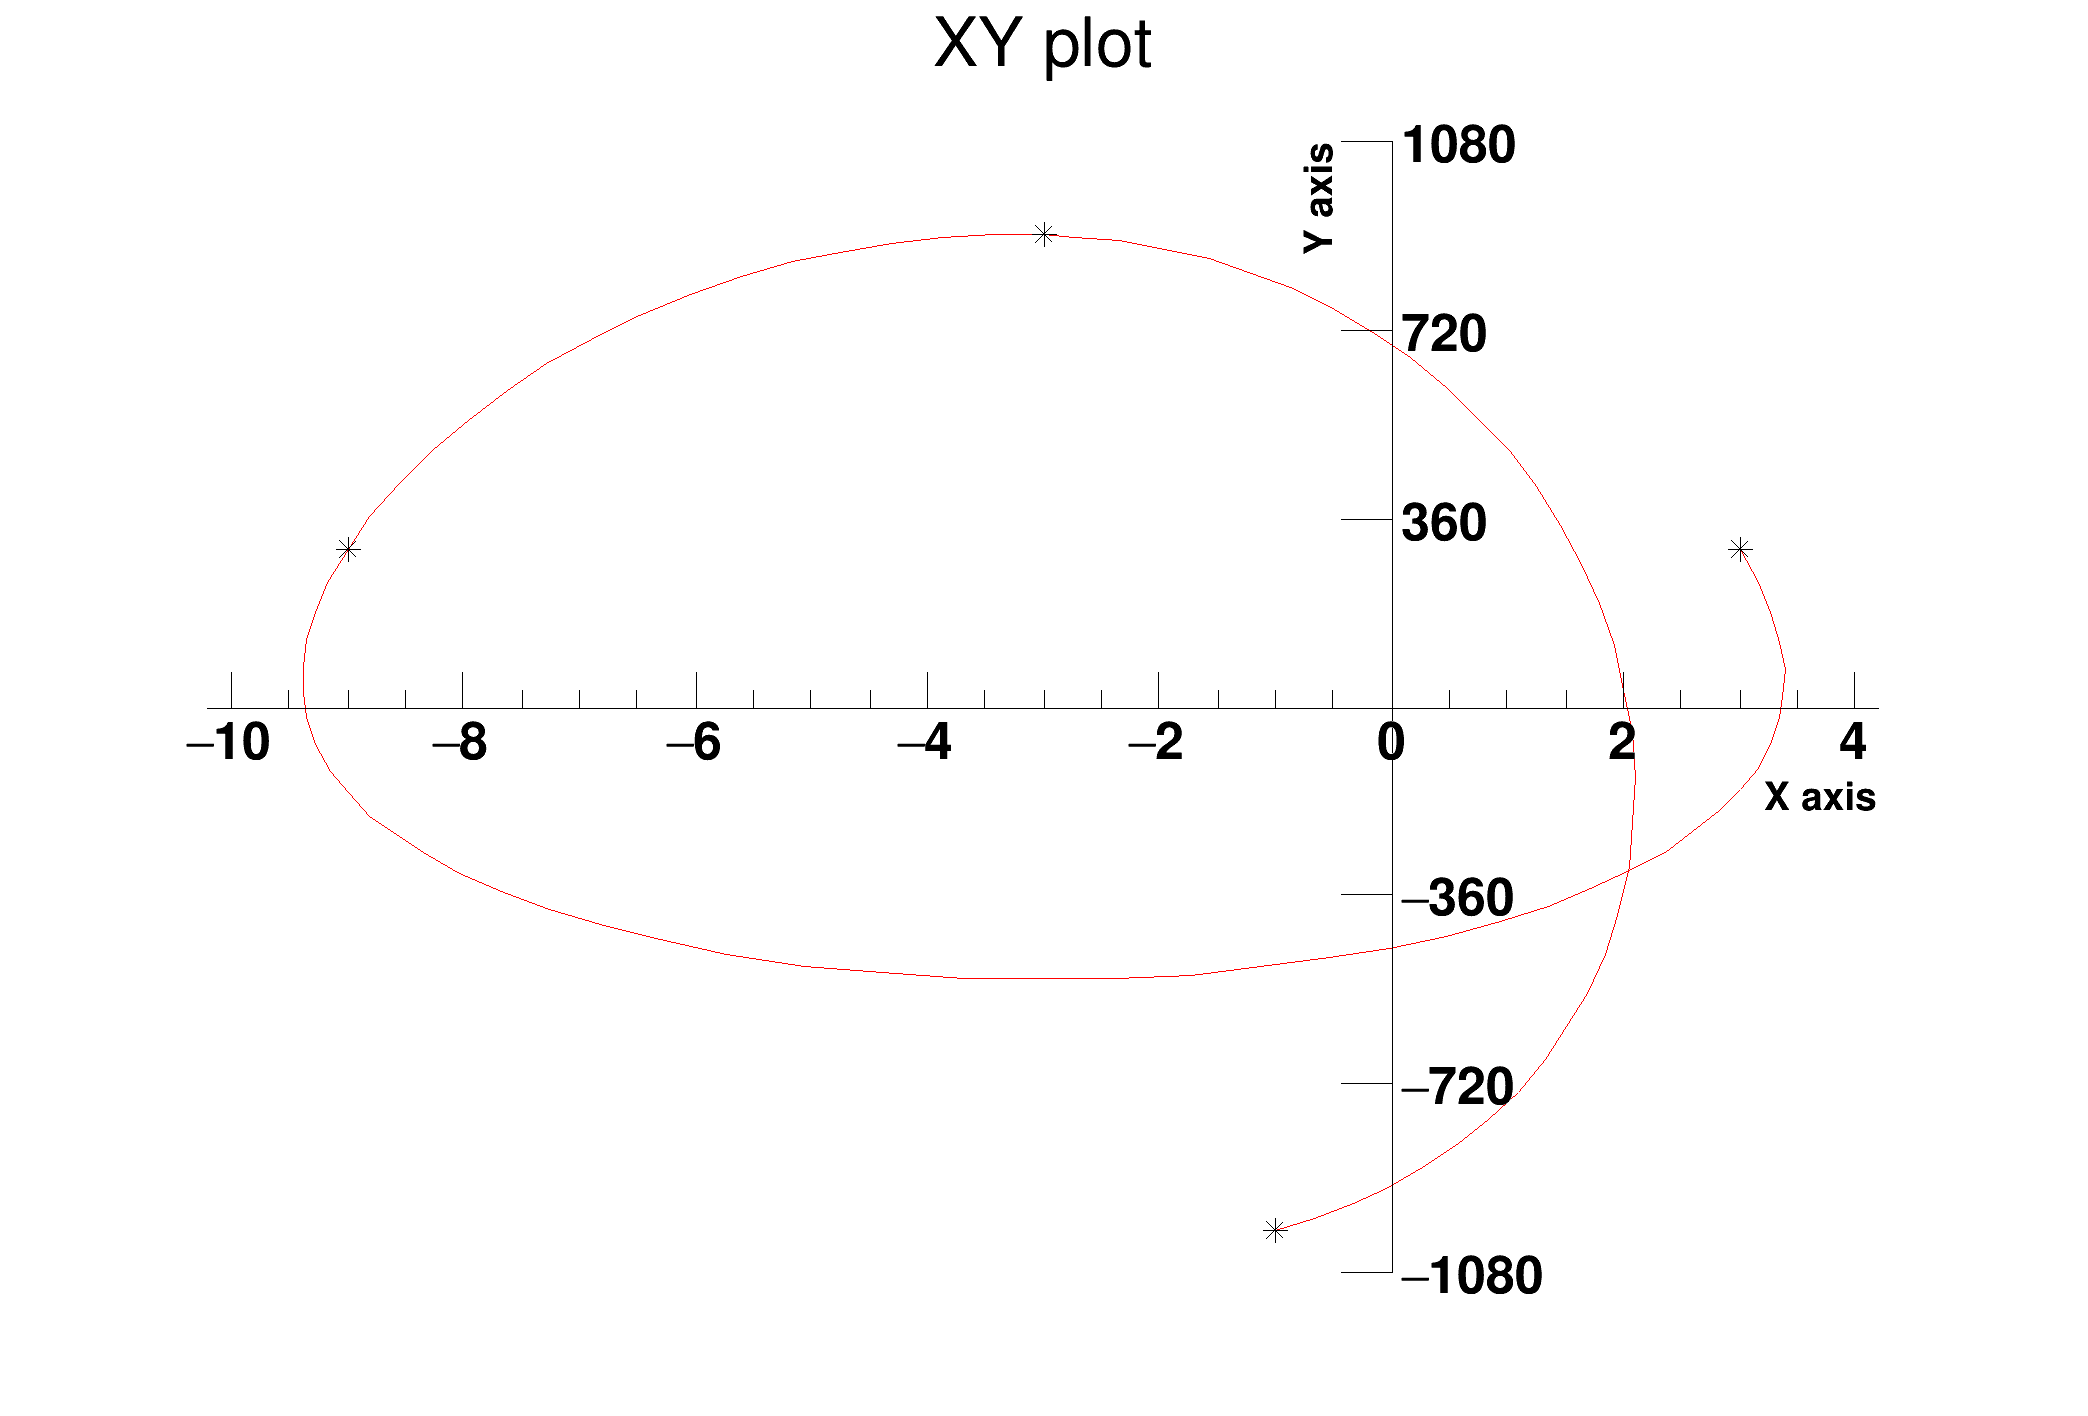
View in nbviewer Open in SWAN Example showing how to produce a plot with an orthogonal axis system centered at (0,0).

void xyplot()
{
TCanvas *c = new TCanvas("c","XY plot",200,10,700,500);
// Remove the frame
c->SetFillColor(kWhite);
c->SetFrameLineColor(kWhite);
c->SetFrameBorderMode(0);
// Define and draw a curve the frame
const Int_t n = 4;
Double_t x[n] = {-1, -3, -9, 3};
Double_t y[n] = {-1000, 900, 300, 300};
TGraph* gr = new TGraph(n,x,y);
gr->SetTitle("XY plot");
gr->SetMinimum(-1080);
gr->SetMaximum(1080);
gr->Draw("AC*");
// Remove the frame's axis
gPad->Update();
// Draw orthogonal axis system centered at (0,0).
// Draw the Y axis. Note the 4th label is erased with SetLabelAttributes
TGaxis *yaxis = new TGaxis(0, gPad->GetUymin(),
0, gPad->GetUymax(),
gPad->GetUymin(),gPad->GetUymax(),6,"+LN");
yaxis->ChangeLabel(4,-1,0.);
yaxis->Draw();
// Draw the Y-axis title.
TLatex *ytitle = new TLatex(-0.5,gPad->GetUymax(),"Y axis");
ytitle->Draw();
ytitle->SetTextSize(0.03);
ytitle->SetTextAngle(90.);
ytitle->SetTextAlign(31);
// Draw the X axis
TGaxis *xaxis = new TGaxis(gPad->GetUxmin(), 0,
gPad->GetUxmax(), 0,
gPad->GetUxmin(),gPad->GetUxmax(),510,"+L");
xaxis->Draw();
// Draw the X axis title.
TLatex *xtitle = new TLatex(gPad->GetUxmax(),-200.,"X axis");
xtitle->Draw();
xtitle->SetTextAlign(31);
xtitle->SetTextSize(0.03);
}
#define c(i)
Definition: RSha256.hxx:101
int Int_t
Definition: RtypesCore.h:43
double Double_t
Definition: RtypesCore.h:57
@ kRed
Definition: Rtypes.h:64
@ kWhite
Definition: Rtypes.h:63
#define gPad
Definition: TVirtualPad.h:287
virtual void SetAxisColor(Color_t color=1, Float_t alpha=1.)
Set color of the line axis and tick marks.
Definition: TAttAxis.cxx:163
virtual void SetLabelSize(Float_t size=0.04)
Set size of axis labels.
Definition: TAttAxis.cxx:204
virtual void SetTickLength(Float_t length=0.03)
Set tick mark length.
Definition: TAttAxis.cxx:280
virtual void SetLineColor(Color_t lcolor)
Set the line color.
Definition: TAttLine.h:40
virtual void SetTextAlign(Short_t align=11)
Set the text alignment.
Definition: TAttText.h:41
virtual void SetTextAngle(Float_t tangle=0)
Set the text angle.
Definition: TAttText.h:42
virtual void SetTextSize(Float_t tsize=1)
Set the text size.
Definition: TAttText.h:46
The Canvas class.
Definition: TCanvas.h:27
The axis painter class.
Definition: TGaxis.h:24
void ChangeLabel(Int_t labNum=0, Double_t labAngle=-1., Double_t labSize=-1., Int_t labAlign=-1, Int_t labColor=-1, Int_t labFont=-1, TString labText="")
Define new text attributes for the label number "labNum".
Definition: TGaxis.cxx:2559
A TGraph is an object made of two arrays X and Y with npoints each.
Definition: TGraph.h:41
virtual void SetMaximum(Double_t maximum=-1111)
Set the maximum of the graph.
Definition: TGraph.cxx:2251
virtual void SetTitle(const char *title="")
Change (i.e.
Definition: TGraph.cxx:2324
virtual void Draw(Option_t *chopt="")
Draw this graph with its current attributes.
Definition: TGraph.cxx:760
TH1F * GetHistogram() const
Returns a pointer to the histogram used to draw the axis Takes into account the two following cases.
Definition: TGraph.cxx:1482
virtual void SetMinimum(Double_t minimum=-1111)
Set the minimum of the graph.
Definition: TGraph.cxx:2260
TAxis * GetXaxis()
Get the behaviour adopted by the object about the statoverflows. See EStatOverflows for more informat...
Definition: TH1.h:316
TAxis * GetYaxis()
Definition: TH1.h:317
To draw Mathematical Formula.
Definition: TLatex.h:18
virtual void Draw(Option_t *option="")
Default Draw method for all objects.
Definition: TObject.cxx:195
Double_t y[n]
Definition: legend1.C:17
Double_t x[n]
Definition: legend1.C:17
const Int_t n
Definition: legend1.C:16
TGraphErrors * gr
Definition: legend1.C:25
Author
Olivier Couet

Definition in file xyplot.C.