

 Plot the Amplitude of a Hydrogen Atom.
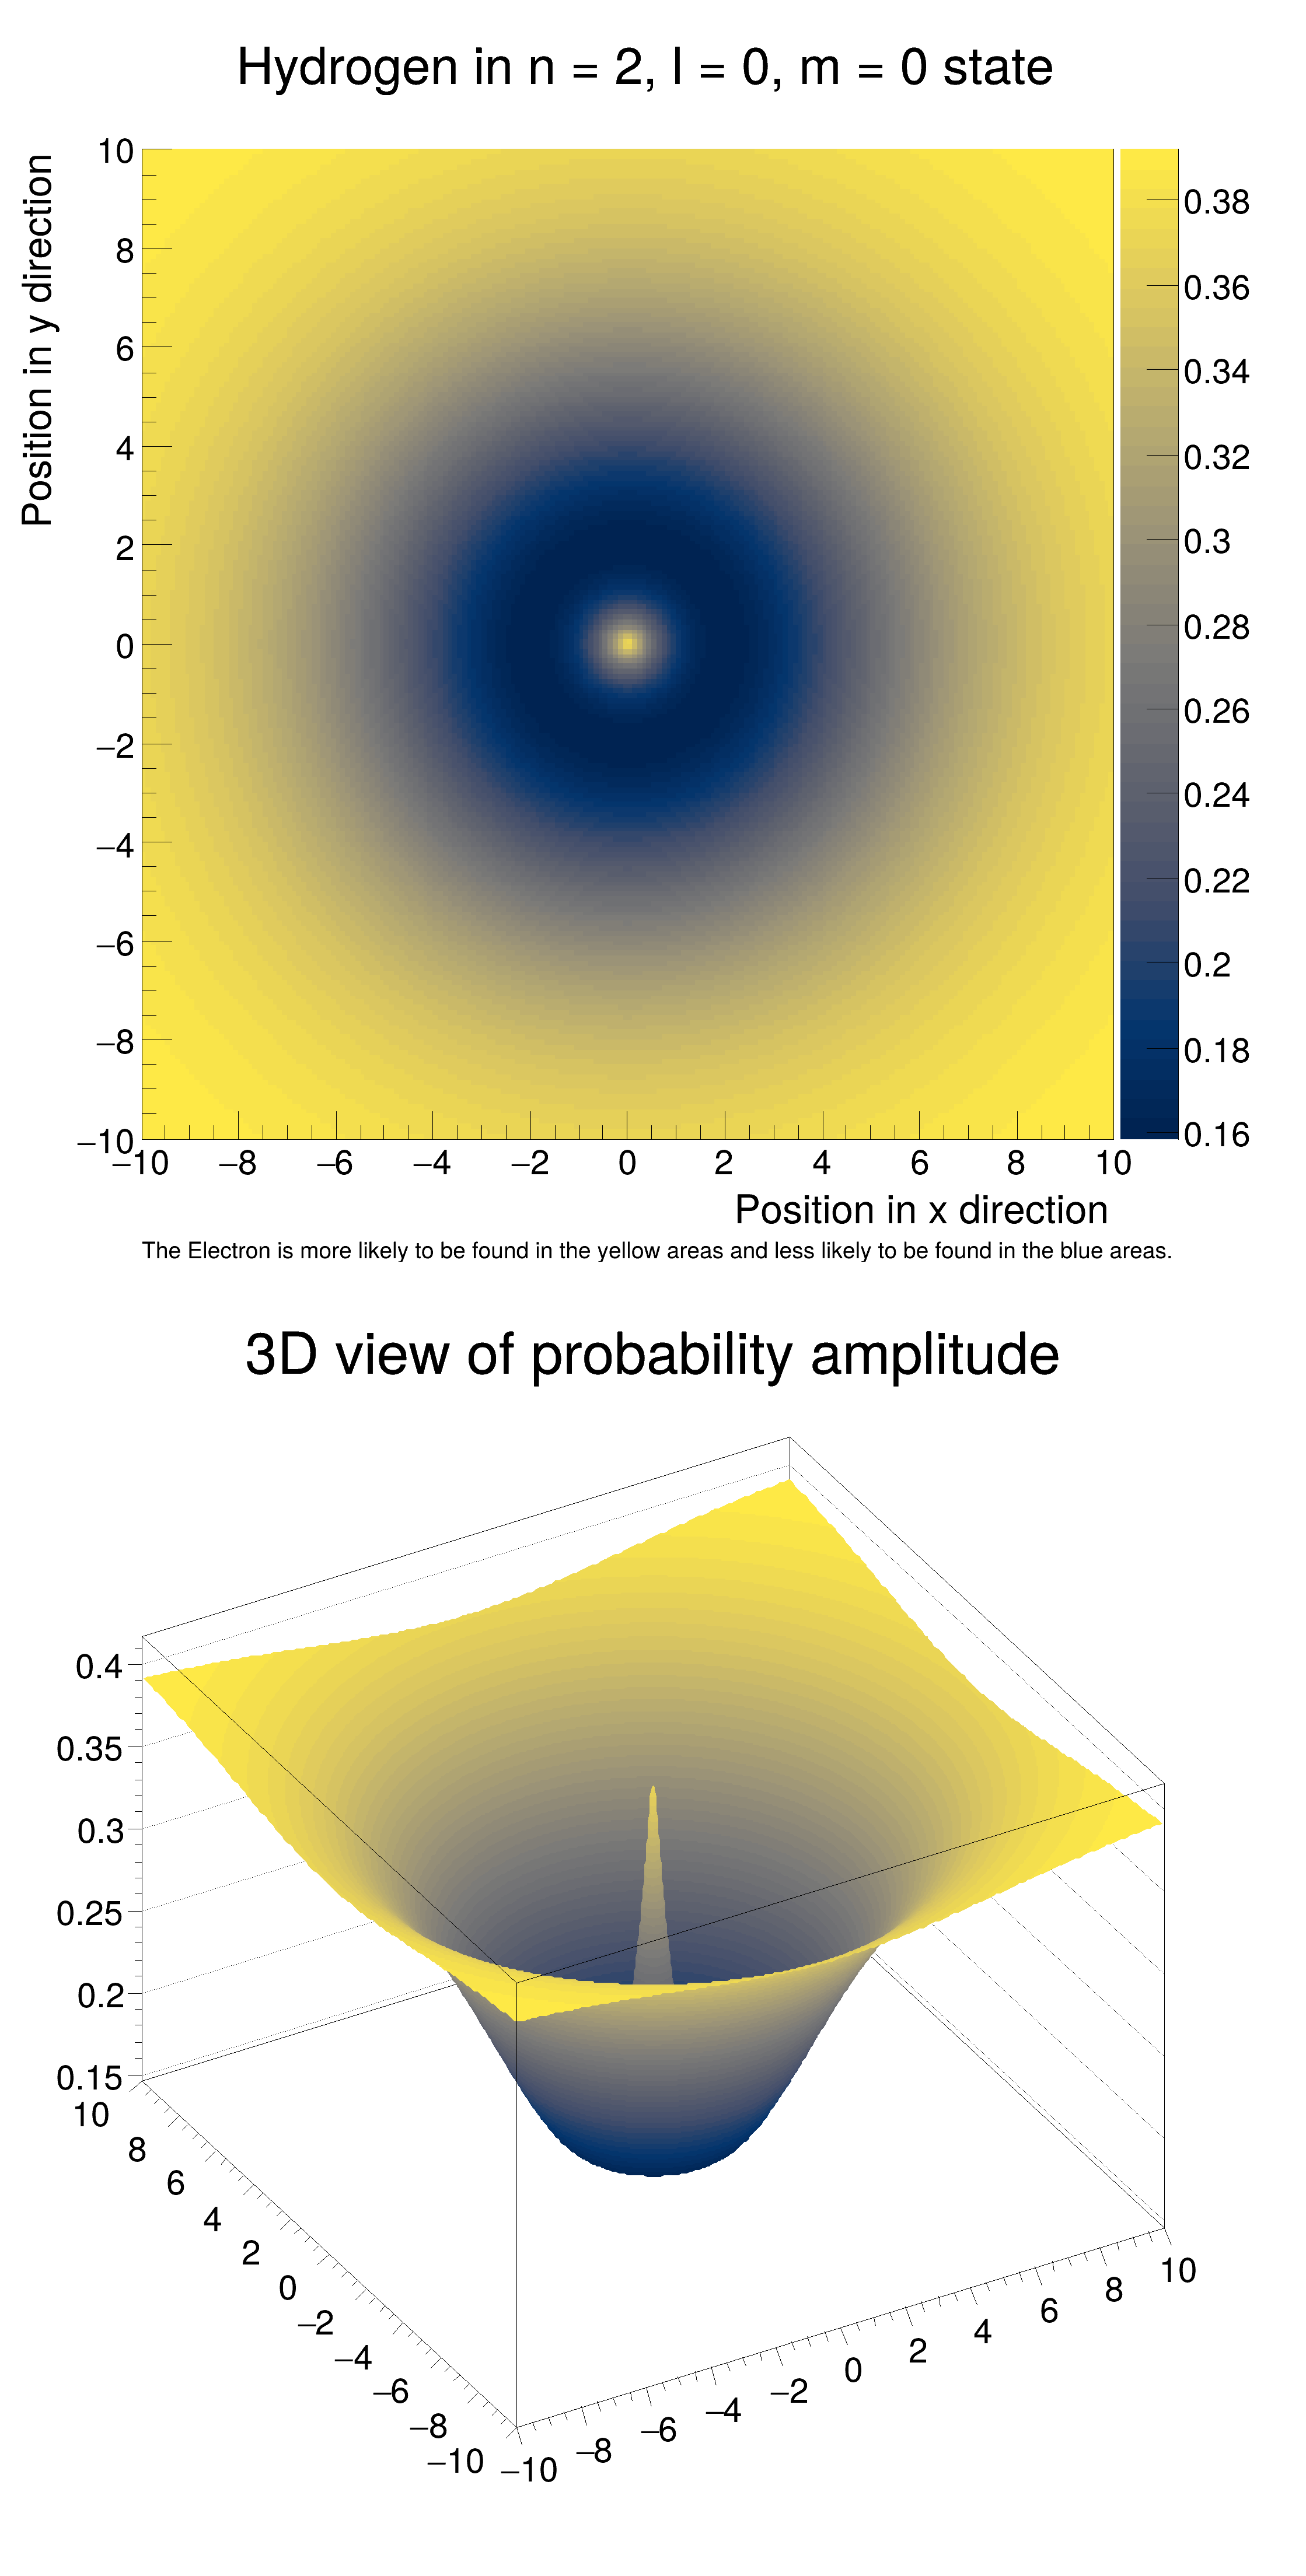
Visualize the Amplitude of a Hydrogen Atom in the n = 2, l = 0, m = 0 state. Demonstrates how TH2F can be used in Quantum Mechanics.
The formula for Hydrogen in this energy state is \( \psi_{200} = \frac{1}{4\sqrt{2\pi}a_0
^{\frac{3}{2}}}(2-\frac{\sqrt{x^2+y^2}}{a_0})e^{-\frac{\sqrt{x^2+y^2}}{2a_0}} \)
#include <cmath>
{
double r = sqrt(
x *
x +
y *
y);
double w = (1 / pow((4 * sqrt(2 *
TMath::Pi()) * 1), 1.5)) *
}
{
"Hydrogen in n = 2, l = 0, m = 0 state; Position in x direction; Position in y direction", 200,
-10, 10, 200, -10, 10);
for (float i = -10; i < 10; i += 0.01) {
for (
float j = -10;
j < 10;
j += 0.01) {
}
}
c1_1->SetRightMargin(0.14);
h2D->GetXaxis()->SetLabelSize(0.03);
h2D->GetYaxis()->SetLabelSize(0.03);
h2D->GetZaxis()->SetLabelSize(0.03);
-10, -12.43,
"The Electron is more likely to be found in the yellow areas and less likely to be found in the blue areas.");
h2Dc->SetTitle(
"3D view of probability amplitude;;");
}
ROOT::Detail::TRangeCast< T, true > TRangeDynCast
TRangeDynCast is an adapter class that allows the typed iteration through a TCollection.
Option_t Option_t TPoint TPoint const char GetTextMagnitude GetFillStyle GetLineColor GetLineWidth GetMarkerStyle GetTextAlign GetTextColor GetTextSize void char Point_t Rectangle_t WindowAttributes_t Float_t r
R__EXTERN TStyle * gStyle
2-D histogram with a double per channel (see TH1 documentation)
2-D histogram with a float per channel (see TH1 documentation)
To draw Mathematical Formula.
virtual void Draw(Option_t *option="")
Default Draw method for all objects.
void SetOptStat(Int_t stat=1)
The type of information printed in the histogram statistics box can be selected via the parameter mod...
void SetPalette(Int_t ncolors=kBird, Int_t *colors=nullptr, Float_t alpha=1.)
See TColor::SetPalette.
constexpr Double_t E()
Base of natural log: .
- Author
- Advait Dhingra
Definition in file schroedinger_hydrogen.C.


