Simple fitting example (1-d histogram with an interpreted function)
Formula based function: sqroot
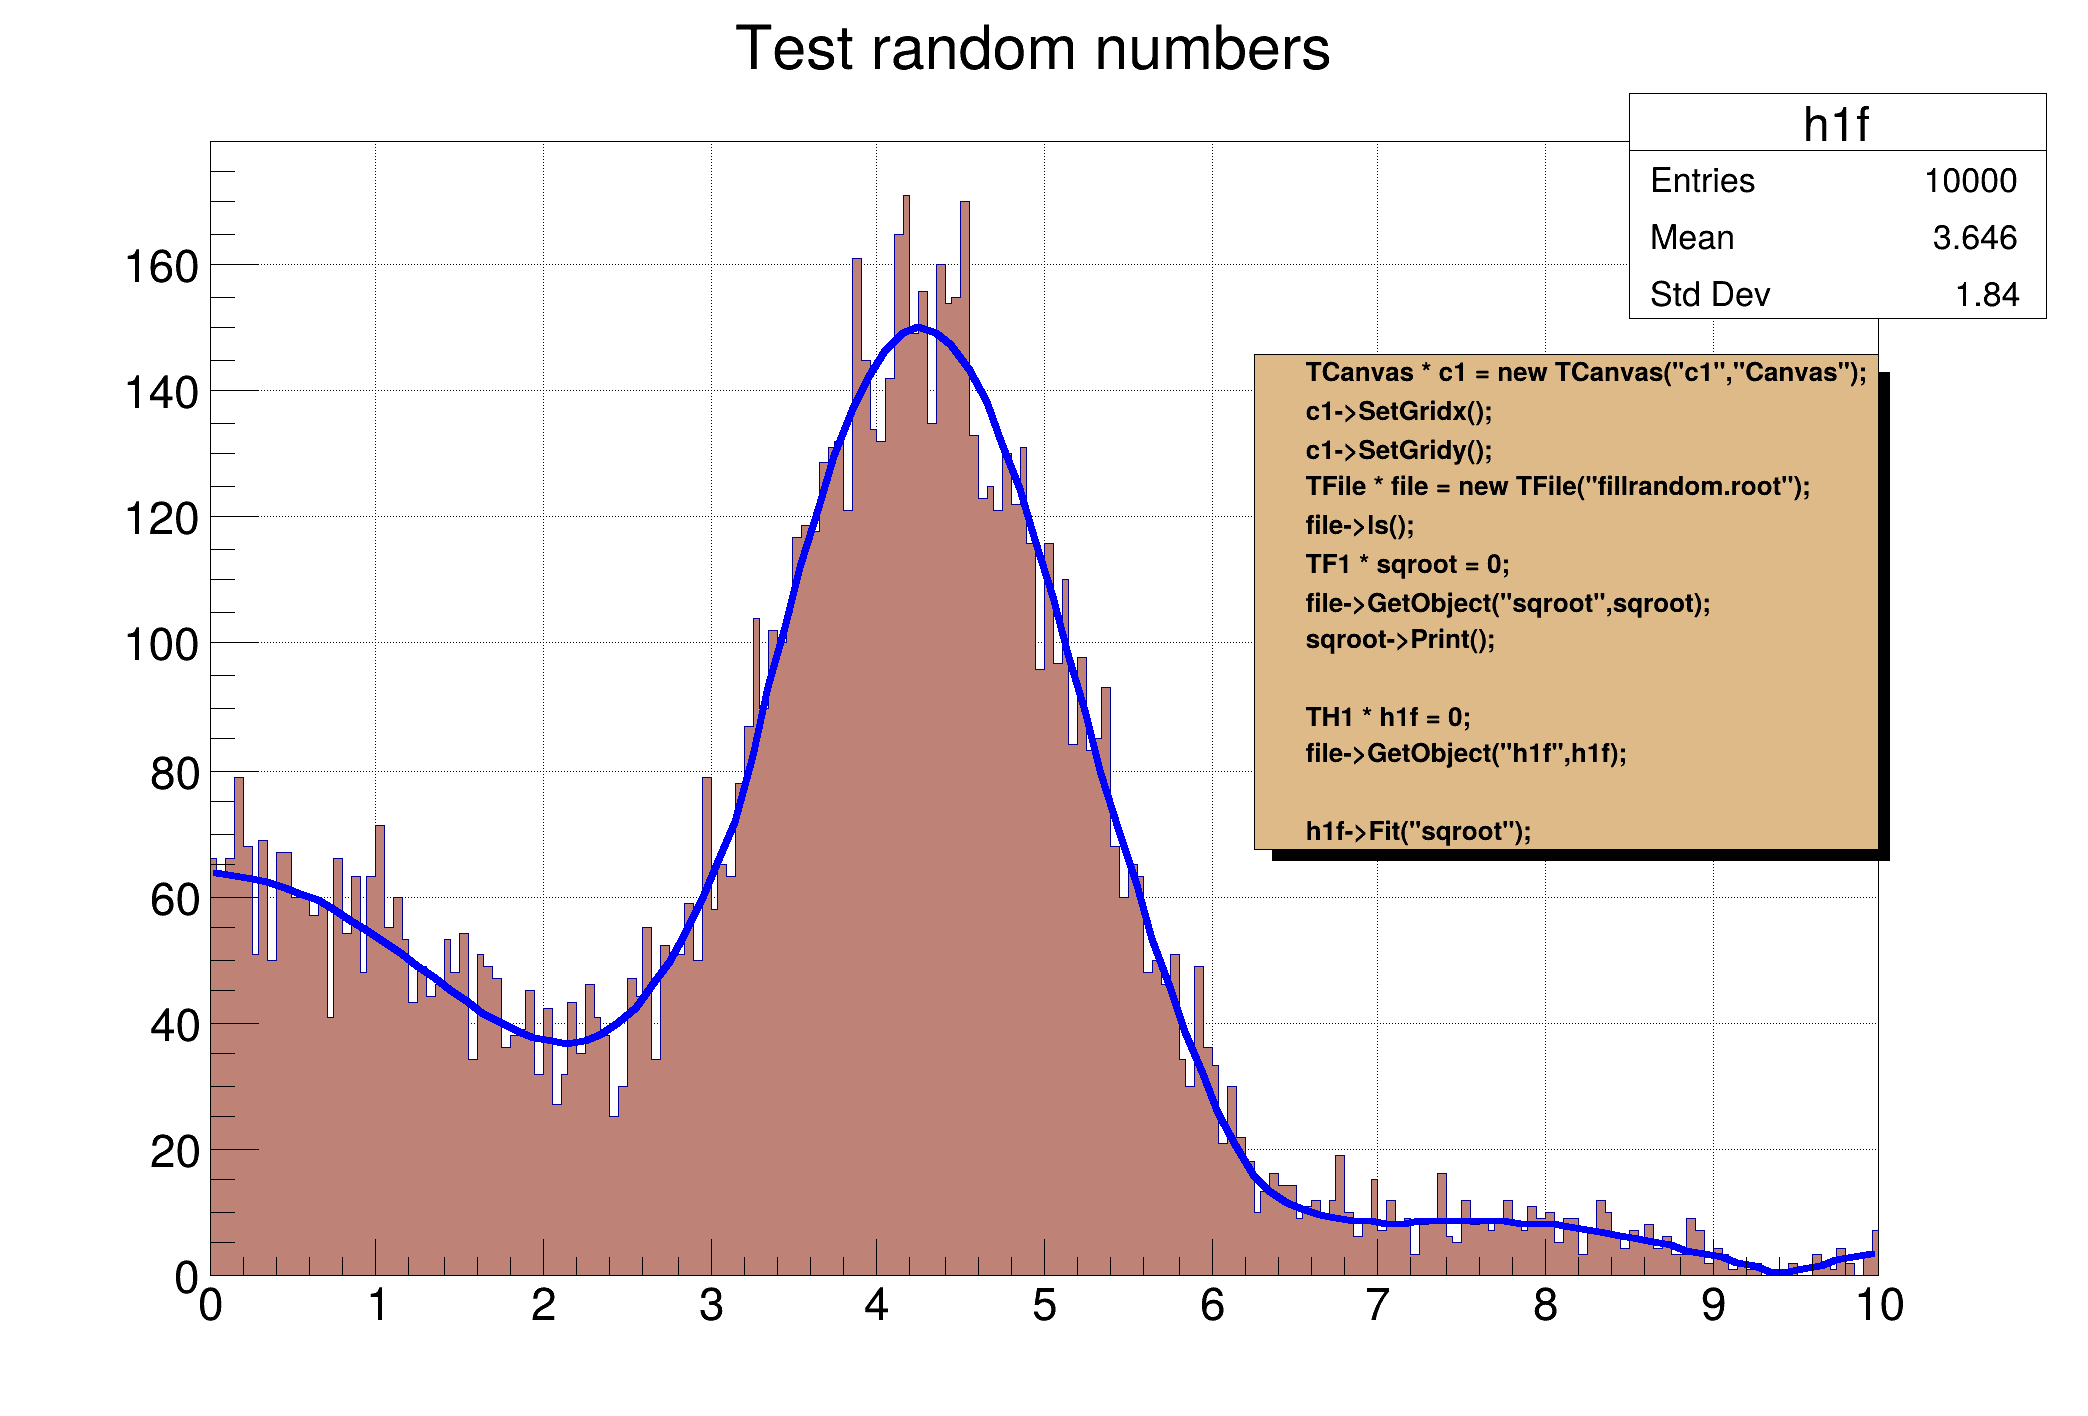
sqroot : x*gaus(0) + [3]*form1 Ndim= 1, Npar= 4, Number= 0
Formula expression:
x*[p0]*exp(-0.5*((x-[p1])/[p2])*((x-[p1])/[p2]))+[p3]*(abs(sin(x)/x))
****************************************
Minimizer is Minuit2 / Migrad
Chi2 = 198.935
NDf = 190
Edm = 1.49283e-07
NCalls = 149
p0 = 33.1658 +/- 0.545703
p1 = 4.00667 +/- 0.0165304
p2 = 0.984663 +/- 0.0128238
p3 = 63.4464 +/- 1.33233
void fit1() {
c1->GetFrame()->SetFillColor(21);
c1->GetFrame()->SetBorderMode(-1);
c1->GetFrame()->SetBorderSize(5);
TF1 *
sqroot =
new TF1(
"sqroot",
"x*gaus(0) + [3]*form1", 0.0, 10.0);
sqroot->SetParameters(10.0, 4.0, 1.0, 20.0);
TH1D *
h1d =
new TH1D(
"h1d",
"Test random numbers", 200, 0.0, 10.0);
h1d->FillRandom(
"sqroot", 10000);
fitlabel->SetTextAlign(12);
fitlabel->SetFillColor(42);
fitlabel->ReadFile(
Form(
"%sfit1_C.txt", dir.
Data()));
fitlabel->Draw();
}
char * Form(const char *fmt,...)
Formats a string in a circular formatting buffer.
1-D histogram with a double per channel (see TH1 documentation)
A Pave (see TPave) with text, lines or/and boxes inside.
const char * Data() const
TString & Append(const char *cs)
- Author
- Rene Brun
Definition in file fit1.C.