Logo ROOT  
Reference Guide
 
Loading...
Searching...
No Matches
distrdf001_spark_connection.py File Reference

Detailed Description

View in nbviewer Open in SWAN
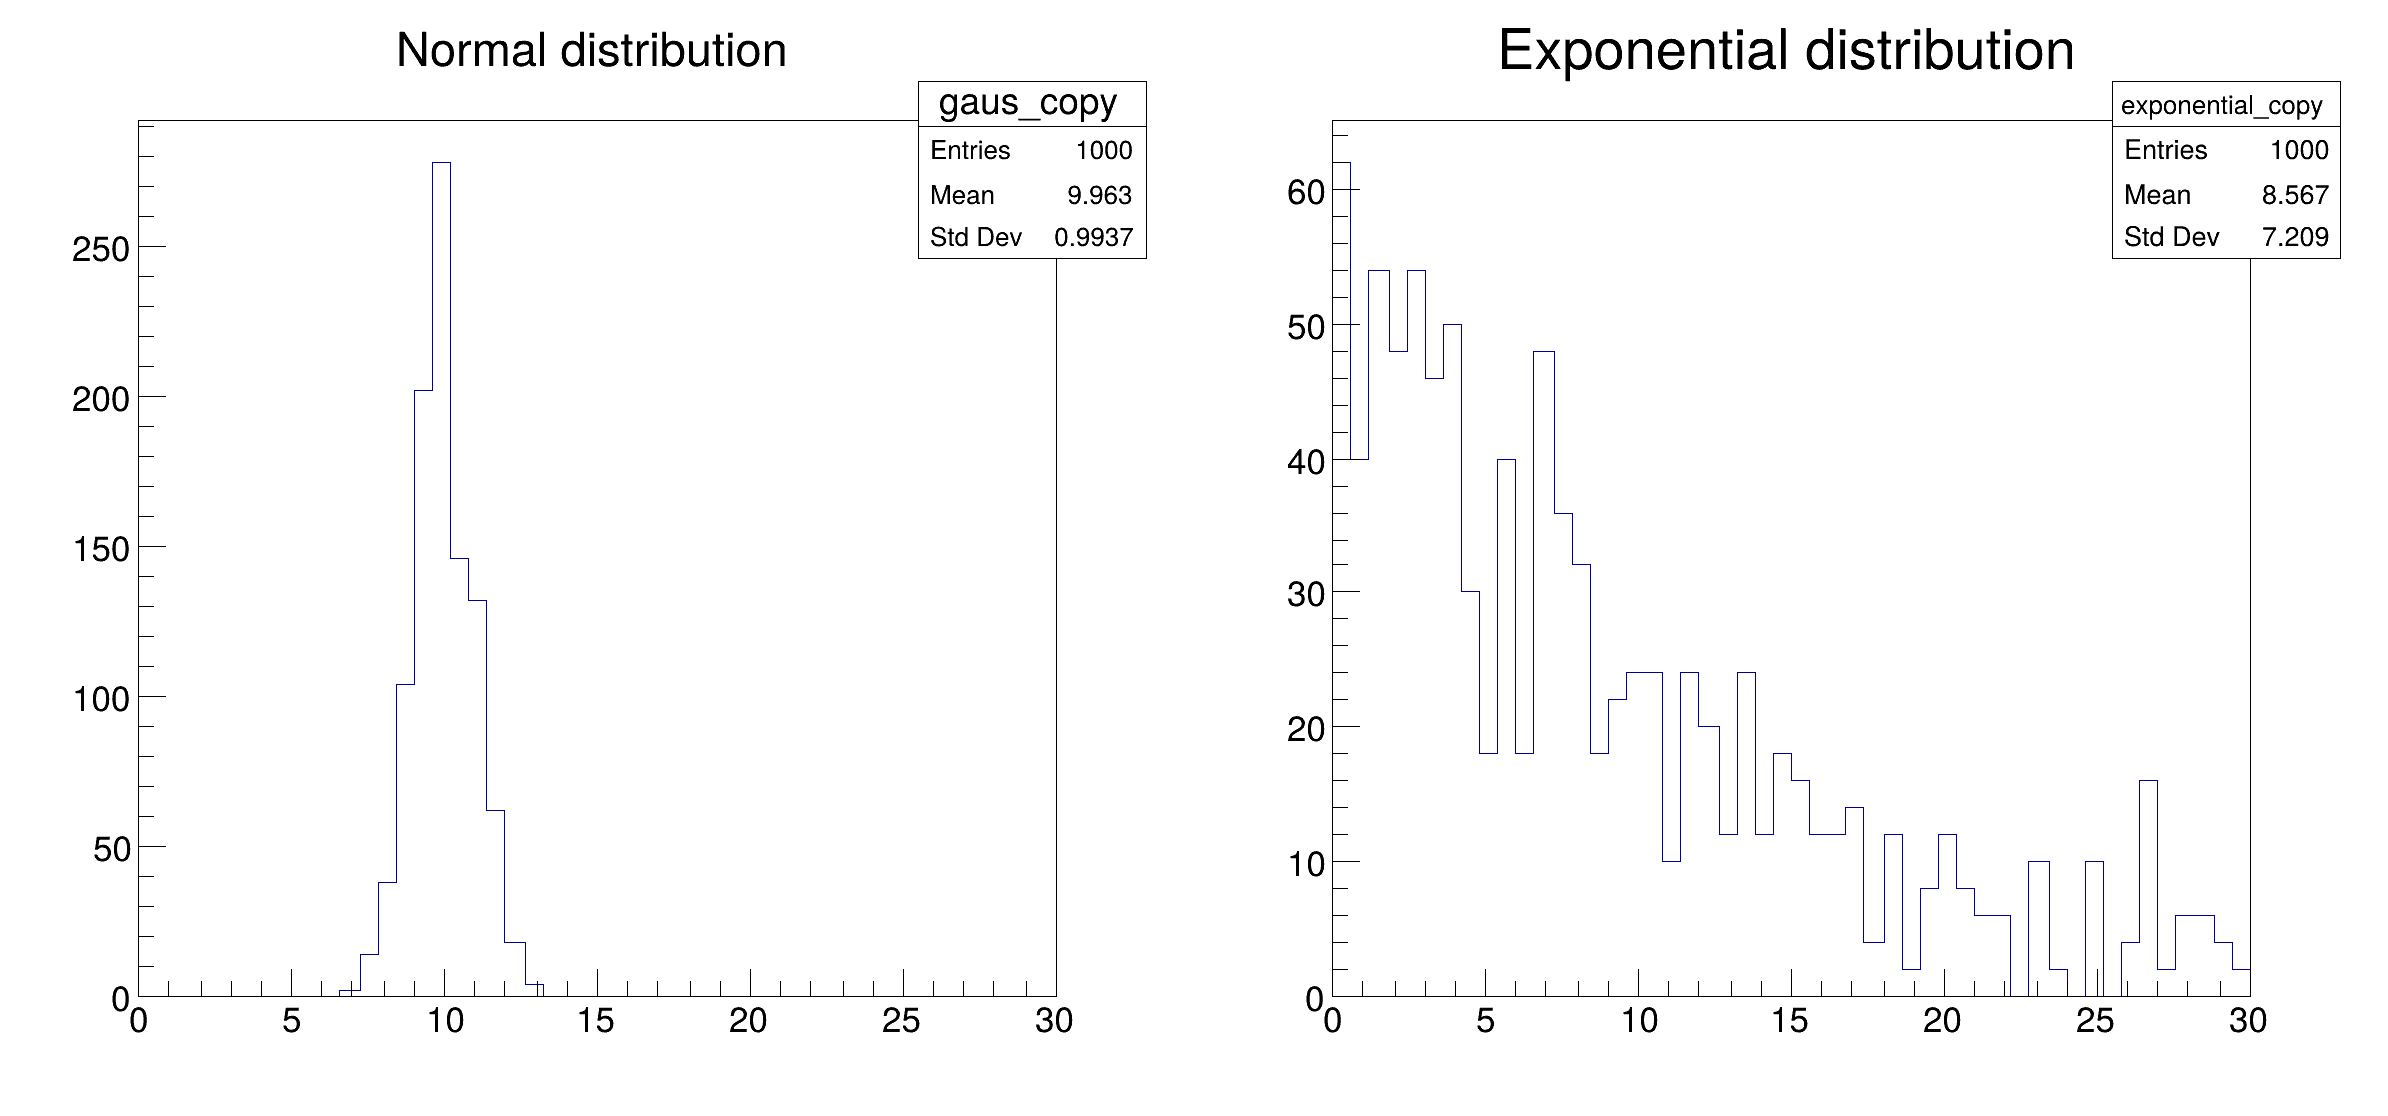
Configure a Spark connection and fill two histograms distributedly.

This tutorial shows the ingredients needed to setup the connection to a Spark cluster, namely a SparkConf object holding configuration parameters and a SparkContext object created with the desired options. After this initial setup, an RDataFrame with distributed capabilities is created and connected to the SparkContext instance. Finally, a couple of histograms are drawn from the created columns in the dataset.

import pyspark
import ROOT
# Point RDataFrame calls to Spark RDataFrame object
RDataFrame = ROOT.RDF.Experimental.Distributed.Spark.RDataFrame
# Setup the connection to Spark
# First create a dictionary with keys representing Spark specific configuration
# parameters. In this tutorial we use the following configuration parameters:
#
# 1. spark.app.name: The name of the Spark application
# 2. spark.master: The Spark endpoint responsible for running the
# application. With the syntax "local[2]" we signal Spark we want to run
# locally on the same machine with 2 cores, each running a separate
# process. The default behaviour of a Spark application would run
# locally on the same machine with as many concurrent processes as
# available cores, that could be also written as "local[*]".
#
# If you have access to a remote cluster you should substitute the endpoint URL
# of your Spark master in the form "spark://HOST:PORT" in the value of
# `spark.master`. Depending on the availability of your cluster you may request
# more computing nodes or cores per node with a similar configuration:
#
# sparkconf = pyspark.SparkConf().setAll(
# {"spark.master": "spark://HOST:PORT",
# "spark.executor.instances": <number_of_nodes>,
# "spark.executor.cores" <cores_per_node>,}.items())
#
# You can find all configuration options and more details in the official Spark
# documentation at https://spark.apache.org/docs/latest/configuration.html .
# Create a SparkConf object with all the desired Spark configuration parameters
sparkconf = pyspark.SparkConf().setAll(
{"spark.app.name": "distrdf001_spark_connection",
"spark.master": "local[2]",
"spark.driver.memory": "4g"}.items())
# Create a SparkContext with the configuration stored in `sparkconf`
sparkcontext = pyspark.SparkContext(conf=sparkconf)
# Create an RDataFrame that will use Spark as a backend for computations
df = RDataFrame(1000, sparkcontext=sparkcontext)
# Set the random seed and define two columns of the dataset with random numbers.
ROOT.gRandom.SetSeed(1)
df_1 = df.Define("gaus", "gRandom->Gaus(10, 1)").Define("exponential", "gRandom->Exp(10)")
# Book an histogram for each column
h_gaus = df_1.Histo1D(("gaus", "Normal distribution", 50, 0, 30), "gaus")
h_exp = df_1.Histo1D(("exponential", "Exponential distribution", 50, 0, 30), "exponential")
# Plot the histograms side by side on a canvas
c = ROOT.TCanvas("distrdf001", "distrdf001", 800, 400)
c.Divide(2, 1)
c.cd(1)
h_gaus.DrawCopy()
c.cd(2)
h_exp.DrawCopy()
# Save the canvas
c.SaveAs("distrdf001_spark_connection.png")
print("Saved figure to distrdf001_spark_connection.png")
Date
March 2021
Author
Vincenzo Eduardo Padulano

Definition in file distrdf001_spark_connection.py.